
Key Insights
The biodegradable polymers market is experiencing robust growth, driven by increasing environmental concerns and stringent regulations regarding plastic waste. A 21.10% CAGR from 2019-2033 indicates a significant expansion, projected to reach a substantial market value. Key drivers include the rising demand for eco-friendly packaging solutions across various sectors, particularly consumer goods and agriculture. The growing awareness of plastic pollution's impact on ecosystems and the push for sustainable alternatives are further accelerating market adoption. Furthermore, advancements in biodegradable polymer technology are leading to improved material properties, making them competitive with conventional plastics in terms of performance and cost-effectiveness. Different types of biodegradable polymers, such as starch-based plastics, PLA, and PHA, cater to diverse applications, reflecting the market's segmentation. While the market faces some restraints, including higher production costs compared to traditional plastics and potential challenges in biodegradability under specific conditions, ongoing research and development efforts are addressing these limitations. The Asia-Pacific region, particularly China and India, is expected to dominate the market due to its large population, growing industrial base, and increasing focus on environmental sustainability. North America and Europe also represent significant markets with established infrastructure and consumer awareness. Major players in the industry, including Total Corbion PLA, Novamont, and BASF, are investing heavily in research and expansion to meet the growing demand.
The market's future trajectory points towards continued expansion, fueled by government policies promoting sustainable materials, corporate sustainability initiatives, and consumer preference for environmentally responsible products. The focus will be on improving the biodegradability and performance characteristics of biodegradable polymers to enhance their applications across a wider range of industries. The development of cost-effective production methods will play a crucial role in expanding market penetration and making these materials accessible to a broader consumer base. Further advancements in technology, such as the development of new biodegradable polymer blends with enhanced properties, will be vital in sustaining the market's growth trajectory. The market is poised to witness increased innovation and competition, driving the development of more sustainable and effective solutions for addressing the global plastic waste crisis.
Biodegradable Polymers Market: A Comprehensive Report (2019-2033)
This in-depth report provides a comprehensive analysis of the Biodegradable Polymers market, offering actionable insights for stakeholders across the value chain. Covering the period from 2019 to 2033, with a base year of 2025, this study explores market dynamics, segmentation, competitive landscape, and future growth prospects. The report leverages extensive primary and secondary research to deliver a detailed overview of this rapidly evolving market, incorporating key trends and developments shaping its future.
Bio-degradable Polymers Market Market Concentration & Innovation
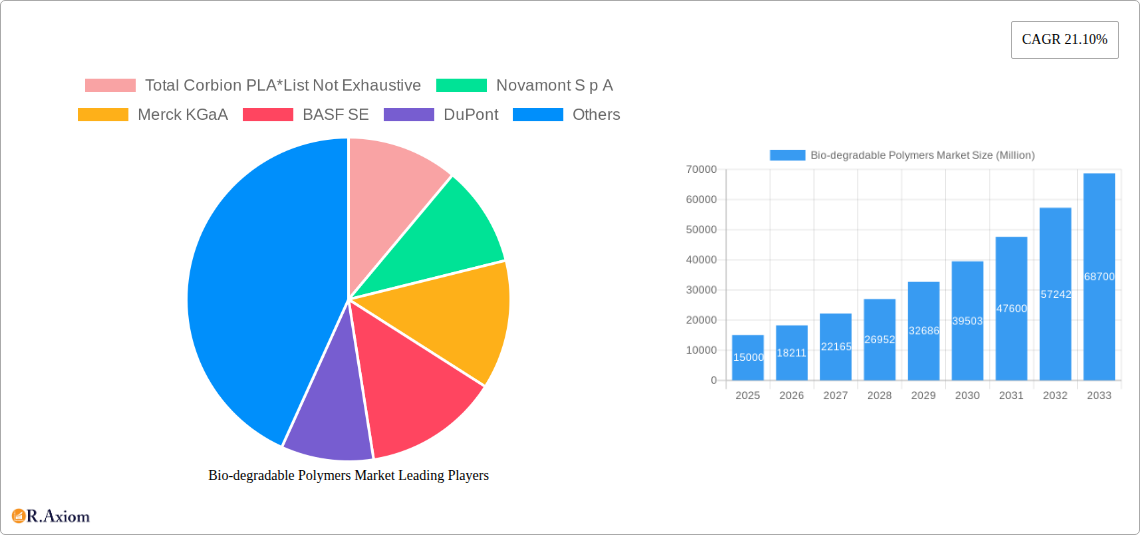
The Biodegradable Polymers market exhibits a moderately concentrated landscape, with several key players holding significant market share. While precise figures vary by segment, companies like Total Corbion PLA, Novamont S.p.A, Merck KGaA, BASF SE, and DuPont collectively account for a substantial portion of the global revenue. However, the market also features several smaller, specialized players focusing on niche applications or innovative biopolymer types.
Innovation is a key driver, fueled by the increasing demand for sustainable materials and stringent environmental regulations. Significant R&D investments are focused on improving biopolymer properties like strength, flexibility, and cost-effectiveness, widening their applicability. The development of new bio-based monomers and polymerization techniques are further driving innovation. M&A activity is also notable, with companies like NatureWorks actively collaborating and forming partnerships to expand their product portfolio and market reach. For example, the partnership between NatureWorks and CJ Bio in May 2022 signifies a strategic move towards commercializing novel biopolymer solutions. While precise M&A deal values are confidential for many transactions, industry analysts estimate a cumulative value of xx Million in deals within the last five years.
- Market Concentration: Moderately concentrated, with several dominant players.
- Innovation Drivers: Demand for sustainable materials, stringent regulations, R&D investments, new monomer and polymerization techniques.
- M&A Activity: Significant, driving market consolidation and expansion.
- Regulatory Framework: Stringent regulations regarding plastic waste and environmental impact influence market growth.
- Product Substitutes: Conventional plastics and other bio-based materials pose competitive threats.
- End-User Trends: Growing consumer preference for eco-friendly products fuels market expansion.
Bio-degradable Polymers Market Industry Trends & Insights
The Biodegradable Polymers market is experiencing robust growth, driven by escalating environmental concerns, government regulations promoting sustainable materials, and rising consumer awareness of plastic waste. The market’s Compound Annual Growth Rate (CAGR) is estimated to be xx% during the forecast period (2025-2033). This growth is particularly evident in packaging and consumer goods sectors where biodegradable polymers are increasingly replacing conventional plastics. Technological advancements are also playing a crucial role, leading to the development of high-performance biopolymers with enhanced properties. Market penetration continues to increase, especially in regions with strict environmental policies. This trend is further enhanced by increasing consumer preference for sustainable and eco-friendly products, leading to a shift in demand from conventional plastics to biodegradable alternatives. Competitive dynamics are characterized by intense rivalry among established players and emerging companies striving for market share through innovation and strategic partnerships.
Dominant Markets & Segments in Bio-degradable Polymers Market
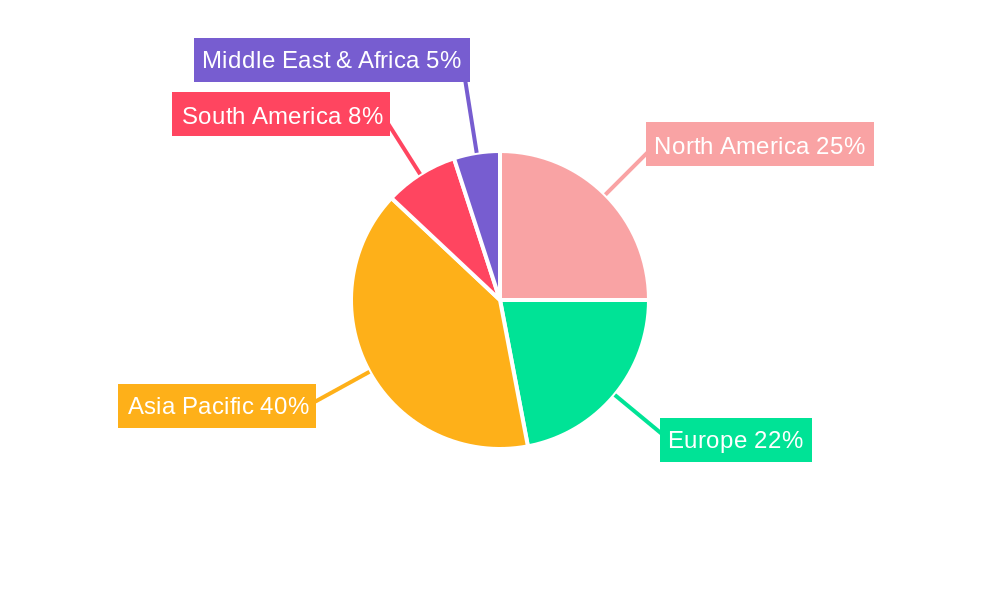
Geographic Dominance: The Asia-Pacific region currently holds a leading position in the Biodegradable Polymers market, driven by factors including rapid industrialization, rising population, and growing awareness of environmental sustainability. Europe follows closely, with strong government support for the bioeconomy and adoption of stringent environmental regulations. North America is another significant market, but growth is slower compared to Asia-Pacific and Europe.
Dominant Segments:
- By Type: Polylactic Acid (PLA) currently dominates the market due to its versatility, established production capabilities, and relatively low cost. However, Polyhydroxyalkanoates (PHA) are witnessing substantial growth owing to their superior biodegradability and diverse applications.
- By End-User Industry: The Packaging sector is a major driver of market growth, followed by the Agriculture and Healthcare industries. This is further fueled by the ongoing development of high-performance biopolymers capable of meeting stringent quality requirements in these sectors.
Key Drivers for Dominant Segments:
- Packaging: Increasing demand for sustainable packaging solutions, stringent regulations concerning plastic waste, and growing consumer awareness of environmental issues.
- Agriculture: Growing use of biodegradable mulching films and other agricultural applications to reduce plastic waste and enhance soil health.
- Asia-Pacific Region: Rapid industrialization, growing population, and supportive government policies encouraging sustainable practices.
Bio-degradable Polymers Market Product Developments
Recent innovations focus on enhancing the properties of existing biopolymers and developing new materials with improved biodegradability, strength, and processability. This includes the development of blends and composites to combine the desirable properties of different biopolymers. For example, NatureWorks' introduction of Ingeo 6500D for nonwoven applications in April 2023 highlights the ongoing efforts to expand the applications of existing biopolymers and address specific market needs, such as strength and softness in hygiene applications. This trend demonstrates a keen focus on creating tailored biopolymer solutions that meet specific performance requirements while remaining environmentally friendly.
Report Scope & Segmentation Analysis
This report segments the Biodegradable Polymers market by type (Starch-based Plastics, Polylactic Acid (PLA), Polyhydroxyalkanoates (PHA), Polyesters (PBS, PBAT, and PCL), Cellulose Derivatives) and end-user industry (Agriculture, Textile, Consumer Goods, Packaging, Healthcare, Other End-User Industries). Each segment's market size, growth projections, and competitive dynamics are thoroughly analyzed. The report presents detailed growth forecasts for each segment, reflecting anticipated market trends and technological advancements. The competitive landscape of each segment is also assessed, highlighting key players, their market share, and their competitive strategies.
Key Drivers of Bio-degradable Polymers Market Growth
The Biodegradable Polymers market is fueled by several factors: growing environmental concerns, increasing government regulations to curb plastic waste, rising consumer demand for eco-friendly products, and the ongoing development of high-performance biopolymers capable of meeting stringent performance requirements. Further boosting this growth is the increasing technological advancements in bio-based monomer production and polymerization techniques. These factors combine to create a substantial push toward the adoption of biodegradable alternatives to conventional plastics across diverse industries.
Challenges in the Bio-degradable Polymers Market Sector
The Biodegradable Polymers market faces challenges including the relatively high cost compared to conventional plastics, limited scalability and availability of raw materials, inconsistencies in biodegradation rates under varying conditions, and the need for improved material properties to match or exceed those of conventional plastics in certain applications. These factors, coupled with potential supply chain issues, hinder widespread adoption. Furthermore, some regulatory frameworks might not be fully adapted to accommodate the specific characteristics of biodegradable polymers.
Emerging Opportunities in Bio-degradable Polymers Market
Emerging opportunities exist in developing new applications for biodegradable polymers in sectors such as electronics, automotive components, and construction. Further potential lies in the development of innovative biopolymer blends and composites with enhanced properties. Growing consumer preference for sustainable products and continued research and development in the field creates a fertile ground for new markets and applications. Moreover, exploring new sources of raw materials for biopolymer production could further reduce production costs and enhance market expansion.
Leading Players in the Bio-degradable Polymers Market Market
- Total Corbion PLA
- Novamont S.p.A
- Merck KGaA
- BASF SE
- DuPont
- Eastman Chemical Company
- FKuR
- Cardia Bioplastics
- Mitsubishi Chemical Group Corporation
- BIOTEC Biologische Naturverpackungen GmbH & Co KG
- Biome Technologies plc
- NatureWorks LLC
- TEIJIN LIMITED
- Danimer Scientific
Key Developments in Bio-degradable Polymers Market Industry
- April 2023: NatureWorks introduced Ingeo 6500D for nonwoven applications, expanding the use of Ingeo biopolymers in hygiene applications. This new material offers improved strength and softness, meeting consumer demand for sustainable products.
- May 2022: NatureWorks and CJ Bio partnered to commercialize novel biopolymer solutions, combining NatureWorks' Ingeo biomaterials technology with CJ Bio's polyhydroxyalkanoate (PHA) technology. This collaboration aims to produce high-performance biopolymers for applications in food packaging, personal care, and other sectors.
Strategic Outlook for Bio-degradable Polymers Market Market
The future of the Biodegradable Polymers market is promising, driven by long-term growth catalysts such as increasing environmental regulations, rising consumer awareness, and ongoing technological advancements. The market's potential lies in its ability to offer sustainable alternatives to conventional plastics across various industries. Continuous innovation in material properties and production processes will be essential for unlocking broader market adoption and achieving significant market penetration in diverse applications.
Bio-degradable Polymers Market Segmentation
-
1. Type
- 1.1. Starch-based Plastics
- 1.2. Polylactic Acid (PLA)
- 1.3. Polyhydroxy Alkanoates (PHA)
- 1.4. Polyesters (PBS, PBAT, and PCL)
- 1.5. Cellulose Derivatives
-
2. End-User Industry
- 2.1. Agriculture
- 2.2. Textile
- 2.3. Consumer Goods (Consumer Electronics)
- 2.4. Packaging
- 2.5. Healthcare
- 2.6. Other End-User Industries
Bio-degradable Polymers Market Segmentation By Geography
-
1. Asia Pacific
- 1.1. China
- 1.2. India
- 1.3. Japan
- 1.4. South Korea
- 1.5. Rest of Asia Pacific
-
2. North America
- 2.1. United States
- 2.2. Canada
- 2.3. Mexico
-
3. Europe
- 3.1. Germany
- 3.2. United Kingdom
- 3.3. Italy
- 3.4. France
- 3.5. Rest of Europe
-
4. South America
- 4.1. Brazil
- 4.2. Argentina
- 4.3. Rest of South America
- 5. Middle East
-
6. Saudi Arabia
- 6.1. South Africa
- 6.2. Rest of Middle East
Bio-degradable Polymers Market REPORT HIGHLIGHTS
| Aspects | Details |
|---|---|
| Study Period | 2019-2033 |
| Base Year | 2024 |
| Estimated Year | 2025 |
| Forecast Period | 2025-2033 |
| Historical Period | 2019-2024 |
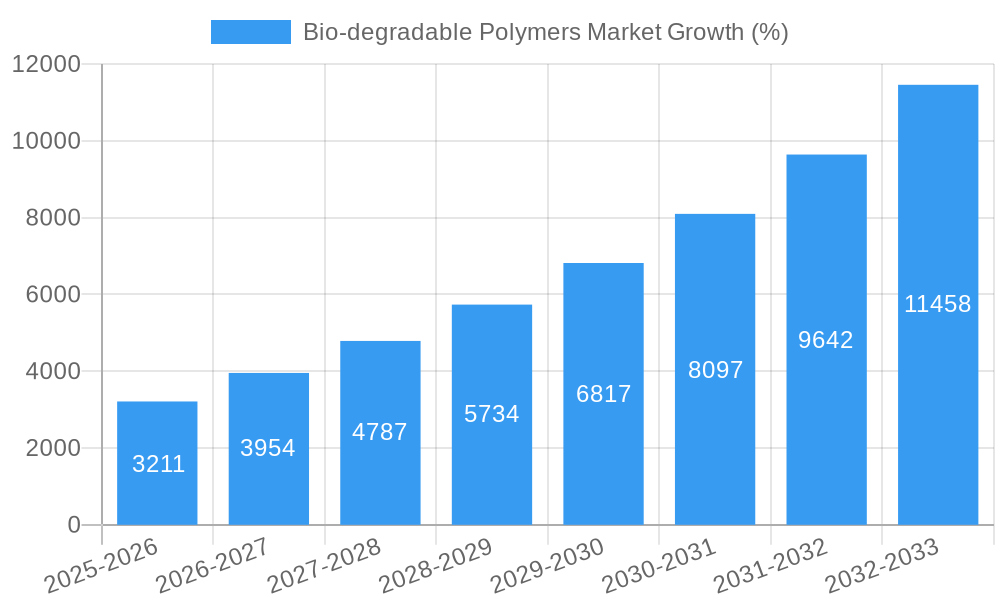
| Growth Rate | CAGR of 21.10% from 2019-2033 |
| Segmentation |
|
Table of Contents
- 1. Introduction
- 1.1. Research Scope
- 1.2. Market Segmentation
- 1.3. Research Methodology
- 1.4. Definitions and Assumptions
- 2. Executive Summary
- 2.1. Introduction
- 3. Market Dynamics
- 3.1. Introduction
- 3.2. Market Drivers
- 3.2.1. Favorable Government Policies Promoting Bio-plastics; Increasing Usage in Flexible Packaging; Other Drivers
- 3.3. Market Restrains
- 3.3.1. Higher Price Compared to Petroleum-based polymers; Other Restraints
- 3.4. Market Trends
- 3.4.1. Increasing Demand from the Packaging Industry
- 4. Market Factor Analysis
- 4.1. Porters Five Forces
- 4.2. Supply/Value Chain
- 4.3. PESTEL analysis
- 4.4. Market Entropy
- 4.5. Patent/Trademark Analysis
- 5. Global Bio-degradable Polymers Market Analysis, Insights and Forecast, 2019-2031
- 5.1. Market Analysis, Insights and Forecast - by Type
- 5.1.1. Starch-based Plastics
- 5.1.2. Polylactic Acid (PLA)
- 5.1.3. Polyhydroxy Alkanoates (PHA)
- 5.1.4. Polyesters (PBS, PBAT, and PCL)
- 5.1.5. Cellulose Derivatives
- 5.2. Market Analysis, Insights and Forecast - by End-User Industry
- 5.2.1. Agriculture
- 5.2.2. Textile
- 5.2.3. Consumer Goods (Consumer Electronics)
- 5.2.4. Packaging
- 5.2.5. Healthcare
- 5.2.6. Other End-User Industries
- 5.3. Market Analysis, Insights and Forecast - by Region
- 5.3.1. Asia Pacific
- 5.3.2. North America
- 5.3.3. Europe
- 5.3.4. South America
- 5.3.5. Middle East
- 5.3.6. Saudi Arabia
- 5.1. Market Analysis, Insights and Forecast - by Type
- 6. Asia Pacific Bio-degradable Polymers Market Analysis, Insights and Forecast, 2019-2031
- 6.1. Market Analysis, Insights and Forecast - by Type
- 6.1.1. Starch-based Plastics
- 6.1.2. Polylactic Acid (PLA)
- 6.1.3. Polyhydroxy Alkanoates (PHA)
- 6.1.4. Polyesters (PBS, PBAT, and PCL)
- 6.1.5. Cellulose Derivatives
- 6.2. Market Analysis, Insights and Forecast - by End-User Industry
- 6.2.1. Agriculture
- 6.2.2. Textile
- 6.2.3. Consumer Goods (Consumer Electronics)
- 6.2.4. Packaging
- 6.2.5. Healthcare
- 6.2.6. Other End-User Industries
- 6.1. Market Analysis, Insights and Forecast - by Type
- 7. North America Bio-degradable Polymers Market Analysis, Insights and Forecast, 2019-2031
- 7.1. Market Analysis, Insights and Forecast - by Type
- 7.1.1. Starch-based Plastics
- 7.1.2. Polylactic Acid (PLA)
- 7.1.3. Polyhydroxy Alkanoates (PHA)
- 7.1.4. Polyesters (PBS, PBAT, and PCL)
- 7.1.5. Cellulose Derivatives
- 7.2. Market Analysis, Insights and Forecast - by End-User Industry
- 7.2.1. Agriculture
- 7.2.2. Textile
- 7.2.3. Consumer Goods (Consumer Electronics)
- 7.2.4. Packaging
- 7.2.5. Healthcare
- 7.2.6. Other End-User Industries
- 7.1. Market Analysis, Insights and Forecast - by Type
- 8. Europe Bio-degradable Polymers Market Analysis, Insights and Forecast, 2019-2031
- 8.1. Market Analysis, Insights and Forecast - by Type
- 8.1.1. Starch-based Plastics
- 8.1.2. Polylactic Acid (PLA)
- 8.1.3. Polyhydroxy Alkanoates (PHA)
- 8.1.4. Polyesters (PBS, PBAT, and PCL)
- 8.1.5. Cellulose Derivatives
- 8.2. Market Analysis, Insights and Forecast - by End-User Industry
- 8.2.1. Agriculture
- 8.2.2. Textile
- 8.2.3. Consumer Goods (Consumer Electronics)
- 8.2.4. Packaging
- 8.2.5. Healthcare
- 8.2.6. Other End-User Industries
- 8.1. Market Analysis, Insights and Forecast - by Type
- 9. South America Bio-degradable Polymers Market Analysis, Insights and Forecast, 2019-2031
- 9.1. Market Analysis, Insights and Forecast - by Type
- 9.1.1. Starch-based Plastics
- 9.1.2. Polylactic Acid (PLA)
- 9.1.3. Polyhydroxy Alkanoates (PHA)
- 9.1.4. Polyesters (PBS, PBAT, and PCL)
- 9.1.5. Cellulose Derivatives
- 9.2. Market Analysis, Insights and Forecast - by End-User Industry
- 9.2.1. Agriculture
- 9.2.2. Textile
- 9.2.3. Consumer Goods (Consumer Electronics)
- 9.2.4. Packaging
- 9.2.5. Healthcare
- 9.2.6. Other End-User Industries
- 9.1. Market Analysis, Insights and Forecast - by Type
- 10. Middle East Bio-degradable Polymers Market Analysis, Insights and Forecast, 2019-2031
- 10.1. Market Analysis, Insights and Forecast - by Type
- 10.1.1. Starch-based Plastics
- 10.1.2. Polylactic Acid (PLA)
- 10.1.3. Polyhydroxy Alkanoates (PHA)
- 10.1.4. Polyesters (PBS, PBAT, and PCL)
- 10.1.5. Cellulose Derivatives
- 10.2. Market Analysis, Insights and Forecast - by End-User Industry
- 10.2.1. Agriculture
- 10.2.2. Textile
- 10.2.3. Consumer Goods (Consumer Electronics)
- 10.2.4. Packaging
- 10.2.5. Healthcare
- 10.2.6. Other End-User Industries
- 10.1. Market Analysis, Insights and Forecast - by Type
- 11. Saudi Arabia Bio-degradable Polymers Market Analysis, Insights and Forecast, 2019-2031
- 11.1. Market Analysis, Insights and Forecast - by Type
- 11.1.1. Starch-based Plastics
- 11.1.2. Polylactic Acid (PLA)
- 11.1.3. Polyhydroxy Alkanoates (PHA)
- 11.1.4. Polyesters (PBS, PBAT, and PCL)
- 11.1.5. Cellulose Derivatives
- 11.2. Market Analysis, Insights and Forecast - by End-User Industry
- 11.2.1. Agriculture
- 11.2.2. Textile
- 11.2.3. Consumer Goods (Consumer Electronics)
- 11.2.4. Packaging
- 11.2.5. Healthcare
- 11.2.6. Other End-User Industries
- 11.1. Market Analysis, Insights and Forecast - by Type
- 12. Asia Pacific Bio-degradable Polymers Market Analysis, Insights and Forecast, 2019-2031
- 12.1. Market Analysis, Insights and Forecast - By Country/Sub-region
- 12.1.1 China
- 12.1.2 India
- 12.1.3 Japan
- 12.1.4 South Korea
- 12.1.5 Rest of Asia Pacific
- 13. North America Bio-degradable Polymers Market Analysis, Insights and Forecast, 2019-2031
- 13.1. Market Analysis, Insights and Forecast - By Country/Sub-region
- 13.1.1 United States
- 13.1.2 Canada
- 13.1.3 Mexico
- 14. Europe Bio-degradable Polymers Market Analysis, Insights and Forecast, 2019-2031
- 14.1. Market Analysis, Insights and Forecast - By Country/Sub-region
- 14.1.1 Germany
- 14.1.2 United Kingdom
- 14.1.3 Italy
- 14.1.4 France
- 14.1.5 Rest of Europe
- 15. South America Bio-degradable Polymers Market Analysis, Insights and Forecast, 2019-2031
- 15.1. Market Analysis, Insights and Forecast - By Country/Sub-region
- 15.1.1 Brazil
- 15.1.2 Argentina
- 15.1.3 Rest of South America
- 16. Middle East Bio-degradable Polymers Market Analysis, Insights and Forecast, 2019-2031
- 16.1. Market Analysis, Insights and Forecast - By Country/Sub-region
- 16.1.1.
- 17. Saudi Arabia Bio-degradable Polymers Market Analysis, Insights and Forecast, 2019-2031
- 17.1. Market Analysis, Insights and Forecast - By Country/Sub-region
- 17.1.1 South Africa
- 17.1.2 Rest of Middle East
- 18. Competitive Analysis
- 18.1. Global Market Share Analysis 2024
- 18.2. Company Profiles
- 18.2.1 Total Corbion PLA*List Not Exhaustive
- 18.2.1.1. Overview
- 18.2.1.2. Products
- 18.2.1.3. SWOT Analysis
- 18.2.1.4. Recent Developments
- 18.2.1.5. Financials (Based on Availability)
- 18.2.2 Novamont S p A
- 18.2.2.1. Overview
- 18.2.2.2. Products
- 18.2.2.3. SWOT Analysis
- 18.2.2.4. Recent Developments
- 18.2.2.5. Financials (Based on Availability)
- 18.2.3 Merck KGaA
- 18.2.3.1. Overview
- 18.2.3.2. Products
- 18.2.3.3. SWOT Analysis
- 18.2.3.4. Recent Developments
- 18.2.3.5. Financials (Based on Availability)
- 18.2.4 BASF SE
- 18.2.4.1. Overview
- 18.2.4.2. Products
- 18.2.4.3. SWOT Analysis
- 18.2.4.4. Recent Developments
- 18.2.4.5. Financials (Based on Availability)
- 18.2.5 DuPont
- 18.2.5.1. Overview
- 18.2.5.2. Products
- 18.2.5.3. SWOT Analysis
- 18.2.5.4. Recent Developments
- 18.2.5.5. Financials (Based on Availability)
- 18.2.6 Eastman Chemical Company
- 18.2.6.1. Overview
- 18.2.6.2. Products
- 18.2.6.3. SWOT Analysis
- 18.2.6.4. Recent Developments
- 18.2.6.5. Financials (Based on Availability)
- 18.2.7 FKuR
- 18.2.7.1. Overview
- 18.2.7.2. Products
- 18.2.7.3. SWOT Analysis
- 18.2.7.4. Recent Developments
- 18.2.7.5. Financials (Based on Availability)
- 18.2.8 Cardia Bioplastics
- 18.2.8.1. Overview
- 18.2.8.2. Products
- 18.2.8.3. SWOT Analysis
- 18.2.8.4. Recent Developments
- 18.2.8.5. Financials (Based on Availability)
- 18.2.9 Mitsubishi Chemical Group Corporation
- 18.2.9.1. Overview
- 18.2.9.2. Products
- 18.2.9.3. SWOT Analysis
- 18.2.9.4. Recent Developments
- 18.2.9.5. Financials (Based on Availability)
- 18.2.10 BIOTEC Biologische Naturverpackungen GmbH & Co KG
- 18.2.10.1. Overview
- 18.2.10.2. Products
- 18.2.10.3. SWOT Analysis
- 18.2.10.4. Recent Developments
- 18.2.10.5. Financials (Based on Availability)
- 18.2.11 Biome Technologies plc
- 18.2.11.1. Overview
- 18.2.11.2. Products
- 18.2.11.3. SWOT Analysis
- 18.2.11.4. Recent Developments
- 18.2.11.5. Financials (Based on Availability)
- 18.2.12 NatureWorks LLC
- 18.2.12.1. Overview
- 18.2.12.2. Products
- 18.2.12.3. SWOT Analysis
- 18.2.12.4. Recent Developments
- 18.2.12.5. Financials (Based on Availability)
- 18.2.13 TEIJIN LIMITED
- 18.2.13.1. Overview
- 18.2.13.2. Products
- 18.2.13.3. SWOT Analysis
- 18.2.13.4. Recent Developments
- 18.2.13.5. Financials (Based on Availability)
- 18.2.14 Danimer Scientific
- 18.2.14.1. Overview
- 18.2.14.2. Products
- 18.2.14.3. SWOT Analysis
- 18.2.14.4. Recent Developments
- 18.2.14.5. Financials (Based on Availability)
- 18.2.1 Total Corbion PLA*List Not Exhaustive
List of Figures
- Figure 1: Global Bio-degradable Polymers Market Revenue Breakdown (Million, %) by Region 2024 & 2032
- Figure 2: Global Bio-degradable Polymers Market Volume Breakdown (Million, %) by Region 2024 & 2032
- Figure 3: Asia Pacific Bio-degradable Polymers Market Revenue (Million), by Country 2024 & 2032
- Figure 4: Asia Pacific Bio-degradable Polymers Market Volume (Million), by Country 2024 & 2032
- Figure 5: Asia Pacific Bio-degradable Polymers Market Revenue Share (%), by Country 2024 & 2032
- Figure 6: Asia Pacific Bio-degradable Polymers Market Volume Share (%), by Country 2024 & 2032
- Figure 7: North America Bio-degradable Polymers Market Revenue (Million), by Country 2024 & 2032
- Figure 8: North America Bio-degradable Polymers Market Volume (Million), by Country 2024 & 2032
- Figure 9: North America Bio-degradable Polymers Market Revenue Share (%), by Country 2024 & 2032
- Figure 10: North America Bio-degradable Polymers Market Volume Share (%), by Country 2024 & 2032
- Figure 11: Europe Bio-degradable Polymers Market Revenue (Million), by Country 2024 & 2032
- Figure 12: Europe Bio-degradable Polymers Market Volume (Million), by Country 2024 & 2032
- Figure 13: Europe Bio-degradable Polymers Market Revenue Share (%), by Country 2024 & 2032
- Figure 14: Europe Bio-degradable Polymers Market Volume Share (%), by Country 2024 & 2032
- Figure 15: South America Bio-degradable Polymers Market Revenue (Million), by Country 2024 & 2032
- Figure 16: South America Bio-degradable Polymers Market Volume (Million), by Country 2024 & 2032
- Figure 17: South America Bio-degradable Polymers Market Revenue Share (%), by Country 2024 & 2032
- Figure 18: South America Bio-degradable Polymers Market Volume Share (%), by Country 2024 & 2032
- Figure 19: Middle East Bio-degradable Polymers Market Revenue (Million), by Country 2024 & 2032
- Figure 20: Middle East Bio-degradable Polymers Market Volume (Million), by Country 2024 & 2032
- Figure 21: Middle East Bio-degradable Polymers Market Revenue Share (%), by Country 2024 & 2032
- Figure 22: Middle East Bio-degradable Polymers Market Volume Share (%), by Country 2024 & 2032
- Figure 23: Saudi Arabia Bio-degradable Polymers Market Revenue (Million), by Country 2024 & 2032
- Figure 24: Saudi Arabia Bio-degradable Polymers Market Volume (Million), by Country 2024 & 2032
- Figure 25: Saudi Arabia Bio-degradable Polymers Market Revenue Share (%), by Country 2024 & 2032
- Figure 26: Saudi Arabia Bio-degradable Polymers Market Volume Share (%), by Country 2024 & 2032
- Figure 27: Asia Pacific Bio-degradable Polymers Market Revenue (Million), by Type 2024 & 2032
- Figure 28: Asia Pacific Bio-degradable Polymers Market Volume (Million), by Type 2024 & 2032
- Figure 29: Asia Pacific Bio-degradable Polymers Market Revenue Share (%), by Type 2024 & 2032
- Figure 30: Asia Pacific Bio-degradable Polymers Market Volume Share (%), by Type 2024 & 2032
- Figure 31: Asia Pacific Bio-degradable Polymers Market Revenue (Million), by End-User Industry 2024 & 2032
- Figure 32: Asia Pacific Bio-degradable Polymers Market Volume (Million), by End-User Industry 2024 & 2032
- Figure 33: Asia Pacific Bio-degradable Polymers Market Revenue Share (%), by End-User Industry 2024 & 2032
- Figure 34: Asia Pacific Bio-degradable Polymers Market Volume Share (%), by End-User Industry 2024 & 2032
- Figure 35: Asia Pacific Bio-degradable Polymers Market Revenue (Million), by Country 2024 & 2032
- Figure 36: Asia Pacific Bio-degradable Polymers Market Volume (Million), by Country 2024 & 2032
- Figure 37: Asia Pacific Bio-degradable Polymers Market Revenue Share (%), by Country 2024 & 2032
- Figure 38: Asia Pacific Bio-degradable Polymers Market Volume Share (%), by Country 2024 & 2032
- Figure 39: North America Bio-degradable Polymers Market Revenue (Million), by Type 2024 & 2032
- Figure 40: North America Bio-degradable Polymers Market Volume (Million), by Type 2024 & 2032
- Figure 41: North America Bio-degradable Polymers Market Revenue Share (%), by Type 2024 & 2032
- Figure 42: North America Bio-degradable Polymers Market Volume Share (%), by Type 2024 & 2032
- Figure 43: North America Bio-degradable Polymers Market Revenue (Million), by End-User Industry 2024 & 2032
- Figure 44: North America Bio-degradable Polymers Market Volume (Million), by End-User Industry 2024 & 2032
- Figure 45: North America Bio-degradable Polymers Market Revenue Share (%), by End-User Industry 2024 & 2032
- Figure 46: North America Bio-degradable Polymers Market Volume Share (%), by End-User Industry 2024 & 2032
- Figure 47: North America Bio-degradable Polymers Market Revenue (Million), by Country 2024 & 2032
- Figure 48: North America Bio-degradable Polymers Market Volume (Million), by Country 2024 & 2032
- Figure 49: North America Bio-degradable Polymers Market Revenue Share (%), by Country 2024 & 2032
- Figure 50: North America Bio-degradable Polymers Market Volume Share (%), by Country 2024 & 2032
- Figure 51: Europe Bio-degradable Polymers Market Revenue (Million), by Type 2024 & 2032
- Figure 52: Europe Bio-degradable Polymers Market Volume (Million), by Type 2024 & 2032
- Figure 53: Europe Bio-degradable Polymers Market Revenue Share (%), by Type 2024 & 2032
- Figure 54: Europe Bio-degradable Polymers Market Volume Share (%), by Type 2024 & 2032
- Figure 55: Europe Bio-degradable Polymers Market Revenue (Million), by End-User Industry 2024 & 2032
- Figure 56: Europe Bio-degradable Polymers Market Volume (Million), by End-User Industry 2024 & 2032
- Figure 57: Europe Bio-degradable Polymers Market Revenue Share (%), by End-User Industry 2024 & 2032
- Figure 58: Europe Bio-degradable Polymers Market Volume Share (%), by End-User Industry 2024 & 2032
- Figure 59: Europe Bio-degradable Polymers Market Revenue (Million), by Country 2024 & 2032
- Figure 60: Europe Bio-degradable Polymers Market Volume (Million), by Country 2024 & 2032
- Figure 61: Europe Bio-degradable Polymers Market Revenue Share (%), by Country 2024 & 2032
- Figure 62: Europe Bio-degradable Polymers Market Volume Share (%), by Country 2024 & 2032
- Figure 63: South America Bio-degradable Polymers Market Revenue (Million), by Type 2024 & 2032
- Figure 64: South America Bio-degradable Polymers Market Volume (Million), by Type 2024 & 2032
- Figure 65: South America Bio-degradable Polymers Market Revenue Share (%), by Type 2024 & 2032
- Figure 66: South America Bio-degradable Polymers Market Volume Share (%), by Type 2024 & 2032
- Figure 67: South America Bio-degradable Polymers Market Revenue (Million), by End-User Industry 2024 & 2032
- Figure 68: South America Bio-degradable Polymers Market Volume (Million), by End-User Industry 2024 & 2032
- Figure 69: South America Bio-degradable Polymers Market Revenue Share (%), by End-User Industry 2024 & 2032
- Figure 70: South America Bio-degradable Polymers Market Volume Share (%), by End-User Industry 2024 & 2032
- Figure 71: South America Bio-degradable Polymers Market Revenue (Million), by Country 2024 & 2032
- Figure 72: South America Bio-degradable Polymers Market Volume (Million), by Country 2024 & 2032
- Figure 73: South America Bio-degradable Polymers Market Revenue Share (%), by Country 2024 & 2032
- Figure 74: South America Bio-degradable Polymers Market Volume Share (%), by Country 2024 & 2032
- Figure 75: Middle East Bio-degradable Polymers Market Revenue (Million), by Type 2024 & 2032
- Figure 76: Middle East Bio-degradable Polymers Market Volume (Million), by Type 2024 & 2032
- Figure 77: Middle East Bio-degradable Polymers Market Revenue Share (%), by Type 2024 & 2032
- Figure 78: Middle East Bio-degradable Polymers Market Volume Share (%), by Type 2024 & 2032
- Figure 79: Middle East Bio-degradable Polymers Market Revenue (Million), by End-User Industry 2024 & 2032
- Figure 80: Middle East Bio-degradable Polymers Market Volume (Million), by End-User Industry 2024 & 2032
- Figure 81: Middle East Bio-degradable Polymers Market Revenue Share (%), by End-User Industry 2024 & 2032
- Figure 82: Middle East Bio-degradable Polymers Market Volume Share (%), by End-User Industry 2024 & 2032
- Figure 83: Middle East Bio-degradable Polymers Market Revenue (Million), by Country 2024 & 2032
- Figure 84: Middle East Bio-degradable Polymers Market Volume (Million), by Country 2024 & 2032
- Figure 85: Middle East Bio-degradable Polymers Market Revenue Share (%), by Country 2024 & 2032
- Figure 86: Middle East Bio-degradable Polymers Market Volume Share (%), by Country 2024 & 2032
- Figure 87: Saudi Arabia Bio-degradable Polymers Market Revenue (Million), by Type 2024 & 2032
- Figure 88: Saudi Arabia Bio-degradable Polymers Market Volume (Million), by Type 2024 & 2032
- Figure 89: Saudi Arabia Bio-degradable Polymers Market Revenue Share (%), by Type 2024 & 2032
- Figure 90: Saudi Arabia Bio-degradable Polymers Market Volume Share (%), by Type 2024 & 2032
- Figure 91: Saudi Arabia Bio-degradable Polymers Market Revenue (Million), by End-User Industry 2024 & 2032
- Figure 92: Saudi Arabia Bio-degradable Polymers Market Volume (Million), by End-User Industry 2024 & 2032
- Figure 93: Saudi Arabia Bio-degradable Polymers Market Revenue Share (%), by End-User Industry 2024 & 2032
- Figure 94: Saudi Arabia Bio-degradable Polymers Market Volume Share (%), by End-User Industry 2024 & 2032
- Figure 95: Saudi Arabia Bio-degradable Polymers Market Revenue (Million), by Country 2024 & 2032
- Figure 96: Saudi Arabia Bio-degradable Polymers Market Volume (Million), by Country 2024 & 2032
- Figure 97: Saudi Arabia Bio-degradable Polymers Market Revenue Share (%), by Country 2024 & 2032
- Figure 98: Saudi Arabia Bio-degradable Polymers Market Volume Share (%), by Country 2024 & 2032
List of Tables
- Table 1: Global Bio-degradable Polymers Market Revenue Million Forecast, by Region 2019 & 2032
- Table 2: Global Bio-degradable Polymers Market Volume Million Forecast, by Region 2019 & 2032
- Table 3: Global Bio-degradable Polymers Market Revenue Million Forecast, by Type 2019 & 2032
- Table 4: Global Bio-degradable Polymers Market Volume Million Forecast, by Type 2019 & 2032
- Table 5: Global Bio-degradable Polymers Market Revenue Million Forecast, by End-User Industry 2019 & 2032
- Table 6: Global Bio-degradable Polymers Market Volume Million Forecast, by End-User Industry 2019 & 2032
- Table 7: Global Bio-degradable Polymers Market Revenue Million Forecast, by Region 2019 & 2032
- Table 8: Global Bio-degradable Polymers Market Volume Million Forecast, by Region 2019 & 2032
- Table 9: Global Bio-degradable Polymers Market Revenue Million Forecast, by Country 2019 & 2032
- Table 10: Global Bio-degradable Polymers Market Volume Million Forecast, by Country 2019 & 2032
- Table 11: China Bio-degradable Polymers Market Revenue (Million) Forecast, by Application 2019 & 2032
- Table 12: China Bio-degradable Polymers Market Volume (Million) Forecast, by Application 2019 & 2032
- Table 13: India Bio-degradable Polymers Market Revenue (Million) Forecast, by Application 2019 & 2032
- Table 14: India Bio-degradable Polymers Market Volume (Million) Forecast, by Application 2019 & 2032
- Table 15: Japan Bio-degradable Polymers Market Revenue (Million) Forecast, by Application 2019 & 2032
- Table 16: Japan Bio-degradable Polymers Market Volume (Million) Forecast, by Application 2019 & 2032
- Table 17: South Korea Bio-degradable Polymers Market Revenue (Million) Forecast, by Application 2019 & 2032
- Table 18: South Korea Bio-degradable Polymers Market Volume (Million) Forecast, by Application 2019 & 2032
- Table 19: Rest of Asia Pacific Bio-degradable Polymers Market Revenue (Million) Forecast, by Application 2019 & 2032
- Table 20: Rest of Asia Pacific Bio-degradable Polymers Market Volume (Million) Forecast, by Application 2019 & 2032
- Table 21: Global Bio-degradable Polymers Market Revenue Million Forecast, by Country 2019 & 2032
- Table 22: Global Bio-degradable Polymers Market Volume Million Forecast, by Country 2019 & 2032
- Table 23: United States Bio-degradable Polymers Market Revenue (Million) Forecast, by Application 2019 & 2032
- Table 24: United States Bio-degradable Polymers Market Volume (Million) Forecast, by Application 2019 & 2032
- Table 25: Canada Bio-degradable Polymers Market Revenue (Million) Forecast, by Application 2019 & 2032
- Table 26: Canada Bio-degradable Polymers Market Volume (Million) Forecast, by Application 2019 & 2032
- Table 27: Mexico Bio-degradable Polymers Market Revenue (Million) Forecast, by Application 2019 & 2032
- Table 28: Mexico Bio-degradable Polymers Market Volume (Million) Forecast, by Application 2019 & 2032
- Table 29: Global Bio-degradable Polymers Market Revenue Million Forecast, by Country 2019 & 2032
- Table 30: Global Bio-degradable Polymers Market Volume Million Forecast, by Country 2019 & 2032
- Table 31: Germany Bio-degradable Polymers Market Revenue (Million) Forecast, by Application 2019 & 2032
- Table 32: Germany Bio-degradable Polymers Market Volume (Million) Forecast, by Application 2019 & 2032
- Table 33: United Kingdom Bio-degradable Polymers Market Revenue (Million) Forecast, by Application 2019 & 2032
- Table 34: United Kingdom Bio-degradable Polymers Market Volume (Million) Forecast, by Application 2019 & 2032
- Table 35: Italy Bio-degradable Polymers Market Revenue (Million) Forecast, by Application 2019 & 2032
- Table 36: Italy Bio-degradable Polymers Market Volume (Million) Forecast, by Application 2019 & 2032
- Table 37: France Bio-degradable Polymers Market Revenue (Million) Forecast, by Application 2019 & 2032
- Table 38: France Bio-degradable Polymers Market Volume (Million) Forecast, by Application 2019 & 2032
- Table 39: Rest of Europe Bio-degradable Polymers Market Revenue (Million) Forecast, by Application 2019 & 2032
- Table 40: Rest of Europe Bio-degradable Polymers Market Volume (Million) Forecast, by Application 2019 & 2032
- Table 41: Global Bio-degradable Polymers Market Revenue Million Forecast, by Country 2019 & 2032
- Table 42: Global Bio-degradable Polymers Market Volume Million Forecast, by Country 2019 & 2032
- Table 43: Brazil Bio-degradable Polymers Market Revenue (Million) Forecast, by Application 2019 & 2032
- Table 44: Brazil Bio-degradable Polymers Market Volume (Million) Forecast, by Application 2019 & 2032
- Table 45: Argentina Bio-degradable Polymers Market Revenue (Million) Forecast, by Application 2019 & 2032
- Table 46: Argentina Bio-degradable Polymers Market Volume (Million) Forecast, by Application 2019 & 2032
- Table 47: Rest of South America Bio-degradable Polymers Market Revenue (Million) Forecast, by Application 2019 & 2032
- Table 48: Rest of South America Bio-degradable Polymers Market Volume (Million) Forecast, by Application 2019 & 2032
- Table 49: Global Bio-degradable Polymers Market Revenue Million Forecast, by Country 2019 & 2032
- Table 50: Global Bio-degradable Polymers Market Volume Million Forecast, by Country 2019 & 2032
- Table 51: Bio-degradable Polymers Market Revenue (Million) Forecast, by Application 2019 & 2032
- Table 52: Bio-degradable Polymers Market Volume (Million) Forecast, by Application 2019 & 2032
- Table 53: Global Bio-degradable Polymers Market Revenue Million Forecast, by Country 2019 & 2032
- Table 54: Global Bio-degradable Polymers Market Volume Million Forecast, by Country 2019 & 2032
- Table 55: South Africa Bio-degradable Polymers Market Revenue (Million) Forecast, by Application 2019 & 2032
- Table 56: South Africa Bio-degradable Polymers Market Volume (Million) Forecast, by Application 2019 & 2032
- Table 57: Rest of Middle East Bio-degradable Polymers Market Revenue (Million) Forecast, by Application 2019 & 2032
- Table 58: Rest of Middle East Bio-degradable Polymers Market Volume (Million) Forecast, by Application 2019 & 2032
- Table 59: Global Bio-degradable Polymers Market Revenue Million Forecast, by Type 2019 & 2032
- Table 60: Global Bio-degradable Polymers Market Volume Million Forecast, by Type 2019 & 2032
- Table 61: Global Bio-degradable Polymers Market Revenue Million Forecast, by End-User Industry 2019 & 2032
- Table 62: Global Bio-degradable Polymers Market Volume Million Forecast, by End-User Industry 2019 & 2032
- Table 63: Global Bio-degradable Polymers Market Revenue Million Forecast, by Country 2019 & 2032
- Table 64: Global Bio-degradable Polymers Market Volume Million Forecast, by Country 2019 & 2032
- Table 65: China Bio-degradable Polymers Market Revenue (Million) Forecast, by Application 2019 & 2032
- Table 66: China Bio-degradable Polymers Market Volume (Million) Forecast, by Application 2019 & 2032
- Table 67: India Bio-degradable Polymers Market Revenue (Million) Forecast, by Application 2019 & 2032
- Table 68: India Bio-degradable Polymers Market Volume (Million) Forecast, by Application 2019 & 2032
- Table 69: Japan Bio-degradable Polymers Market Revenue (Million) Forecast, by Application 2019 & 2032
- Table 70: Japan Bio-degradable Polymers Market Volume (Million) Forecast, by Application 2019 & 2032
- Table 71: South Korea Bio-degradable Polymers Market Revenue (Million) Forecast, by Application 2019 & 2032
- Table 72: South Korea Bio-degradable Polymers Market Volume (Million) Forecast, by Application 2019 & 2032
- Table 73: Rest of Asia Pacific Bio-degradable Polymers Market Revenue (Million) Forecast, by Application 2019 & 2032
- Table 74: Rest of Asia Pacific Bio-degradable Polymers Market Volume (Million) Forecast, by Application 2019 & 2032
- Table 75: Global Bio-degradable Polymers Market Revenue Million Forecast, by Type 2019 & 2032
- Table 76: Global Bio-degradable Polymers Market Volume Million Forecast, by Type 2019 & 2032
- Table 77: Global Bio-degradable Polymers Market Revenue Million Forecast, by End-User Industry 2019 & 2032
- Table 78: Global Bio-degradable Polymers Market Volume Million Forecast, by End-User Industry 2019 & 2032
- Table 79: Global Bio-degradable Polymers Market Revenue Million Forecast, by Country 2019 & 2032
- Table 80: Global Bio-degradable Polymers Market Volume Million Forecast, by Country 2019 & 2032
- Table 81: United States Bio-degradable Polymers Market Revenue (Million) Forecast, by Application 2019 & 2032
- Table 82: United States Bio-degradable Polymers Market Volume (Million) Forecast, by Application 2019 & 2032
- Table 83: Canada Bio-degradable Polymers Market Revenue (Million) Forecast, by Application 2019 & 2032
- Table 84: Canada Bio-degradable Polymers Market Volume (Million) Forecast, by Application 2019 & 2032
- Table 85: Mexico Bio-degradable Polymers Market Revenue (Million) Forecast, by Application 2019 & 2032
- Table 86: Mexico Bio-degradable Polymers Market Volume (Million) Forecast, by Application 2019 & 2032
- Table 87: Global Bio-degradable Polymers Market Revenue Million Forecast, by Type 2019 & 2032
- Table 88: Global Bio-degradable Polymers Market Volume Million Forecast, by Type 2019 & 2032
- Table 89: Global Bio-degradable Polymers Market Revenue Million Forecast, by End-User Industry 2019 & 2032
- Table 90: Global Bio-degradable Polymers Market Volume Million Forecast, by End-User Industry 2019 & 2032
- Table 91: Global Bio-degradable Polymers Market Revenue Million Forecast, by Country 2019 & 2032
- Table 92: Global Bio-degradable Polymers Market Volume Million Forecast, by Country 2019 & 2032
- Table 93: Germany Bio-degradable Polymers Market Revenue (Million) Forecast, by Application 2019 & 2032
- Table 94: Germany Bio-degradable Polymers Market Volume (Million) Forecast, by Application 2019 & 2032
- Table 95: United Kingdom Bio-degradable Polymers Market Revenue (Million) Forecast, by Application 2019 & 2032
- Table 96: United Kingdom Bio-degradable Polymers Market Volume (Million) Forecast, by Application 2019 & 2032
- Table 97: Italy Bio-degradable Polymers Market Revenue (Million) Forecast, by Application 2019 & 2032
- Table 98: Italy Bio-degradable Polymers Market Volume (Million) Forecast, by Application 2019 & 2032
- Table 99: France Bio-degradable Polymers Market Revenue (Million) Forecast, by Application 2019 & 2032
- Table 100: France Bio-degradable Polymers Market Volume (Million) Forecast, by Application 2019 & 2032
- Table 101: Rest of Europe Bio-degradable Polymers Market Revenue (Million) Forecast, by Application 2019 & 2032
- Table 102: Rest of Europe Bio-degradable Polymers Market Volume (Million) Forecast, by Application 2019 & 2032
- Table 103: Global Bio-degradable Polymers Market Revenue Million Forecast, by Type 2019 & 2032
- Table 104: Global Bio-degradable Polymers Market Volume Million Forecast, by Type 2019 & 2032
- Table 105: Global Bio-degradable Polymers Market Revenue Million Forecast, by End-User Industry 2019 & 2032
- Table 106: Global Bio-degradable Polymers Market Volume Million Forecast, by End-User Industry 2019 & 2032
- Table 107: Global Bio-degradable Polymers Market Revenue Million Forecast, by Country 2019 & 2032
- Table 108: Global Bio-degradable Polymers Market Volume Million Forecast, by Country 2019 & 2032
- Table 109: Brazil Bio-degradable Polymers Market Revenue (Million) Forecast, by Application 2019 & 2032
- Table 110: Brazil Bio-degradable Polymers Market Volume (Million) Forecast, by Application 2019 & 2032
- Table 111: Argentina Bio-degradable Polymers Market Revenue (Million) Forecast, by Application 2019 & 2032
- Table 112: Argentina Bio-degradable Polymers Market Volume (Million) Forecast, by Application 2019 & 2032
- Table 113: Rest of South America Bio-degradable Polymers Market Revenue (Million) Forecast, by Application 2019 & 2032
- Table 114: Rest of South America Bio-degradable Polymers Market Volume (Million) Forecast, by Application 2019 & 2032
- Table 115: Global Bio-degradable Polymers Market Revenue Million Forecast, by Type 2019 & 2032
- Table 116: Global Bio-degradable Polymers Market Volume Million Forecast, by Type 2019 & 2032
- Table 117: Global Bio-degradable Polymers Market Revenue Million Forecast, by End-User Industry 2019 & 2032
- Table 118: Global Bio-degradable Polymers Market Volume Million Forecast, by End-User Industry 2019 & 2032
- Table 119: Global Bio-degradable Polymers Market Revenue Million Forecast, by Country 2019 & 2032
- Table 120: Global Bio-degradable Polymers Market Volume Million Forecast, by Country 2019 & 2032
- Table 121: Global Bio-degradable Polymers Market Revenue Million Forecast, by Type 2019 & 2032
- Table 122: Global Bio-degradable Polymers Market Volume Million Forecast, by Type 2019 & 2032
- Table 123: Global Bio-degradable Polymers Market Revenue Million Forecast, by End-User Industry 2019 & 2032
- Table 124: Global Bio-degradable Polymers Market Volume Million Forecast, by End-User Industry 2019 & 2032
- Table 125: Global Bio-degradable Polymers Market Revenue Million Forecast, by Country 2019 & 2032
- Table 126: Global Bio-degradable Polymers Market Volume Million Forecast, by Country 2019 & 2032
- Table 127: South Africa Bio-degradable Polymers Market Revenue (Million) Forecast, by Application 2019 & 2032
- Table 128: South Africa Bio-degradable Polymers Market Volume (Million) Forecast, by Application 2019 & 2032
- Table 129: Rest of Middle East Bio-degradable Polymers Market Revenue (Million) Forecast, by Application 2019 & 2032
- Table 130: Rest of Middle East Bio-degradable Polymers Market Volume (Million) Forecast, by Application 2019 & 2032
Frequently Asked Questions
1. What is the projected Compound Annual Growth Rate (CAGR) of the Bio-degradable Polymers Market?
The projected CAGR is approximately 21.10%.
2. Which companies are prominent players in the Bio-degradable Polymers Market?
Key companies in the market include Total Corbion PLA*List Not Exhaustive, Novamont S p A, Merck KGaA, BASF SE, DuPont, Eastman Chemical Company, FKuR, Cardia Bioplastics, Mitsubishi Chemical Group Corporation, BIOTEC Biologische Naturverpackungen GmbH & Co KG, Biome Technologies plc, NatureWorks LLC, TEIJIN LIMITED, Danimer Scientific.
3. What are the main segments of the Bio-degradable Polymers Market?
The market segments include Type, End-User Industry.
4. Can you provide details about the market size?
The market size is estimated to be USD XX Million as of 2022.
5. What are some drivers contributing to market growth?
Favorable Government Policies Promoting Bio-plastics; Increasing Usage in Flexible Packaging; Other Drivers.
6. What are the notable trends driving market growth?
Increasing Demand from the Packaging Industry.
7. Are there any restraints impacting market growth?
Higher Price Compared to Petroleum-based polymers; Other Restraints.
8. Can you provide examples of recent developments in the market?
April 2023: NatureWorks introduced Ingeo 6500D for nonwoven applications, and with this, the company expanded the use of Ingeo biopolymers in hygiene applications. The Ingeo 6500D offers strength and softness and meets the demand from consumers and brands for products manufactured using sustainable materials.
9. What pricing options are available for accessing the report?
Pricing options include single-user, multi-user, and enterprise licenses priced at USD 4750, USD 5250, and USD 8750 respectively.
10. Is the market size provided in terms of value or volume?
The market size is provided in terms of value, measured in Million and volume, measured in Million.
11. Are there any specific market keywords associated with the report?
Yes, the market keyword associated with the report is "Bio-degradable Polymers Market," which aids in identifying and referencing the specific market segment covered.
12. How do I determine which pricing option suits my needs best?
The pricing options vary based on user requirements and access needs. Individual users may opt for single-user licenses, while businesses requiring broader access may choose multi-user or enterprise licenses for cost-effective access to the report.
13. Are there any additional resources or data provided in the Bio-degradable Polymers Market report?
While the report offers comprehensive insights, it's advisable to review the specific contents or supplementary materials provided to ascertain if additional resources or data are available.
14. How can I stay updated on further developments or reports in the Bio-degradable Polymers Market?
To stay informed about further developments, trends, and reports in the Bio-degradable Polymers Market, consider subscribing to industry newsletters, following relevant companies and organizations, or regularly checking reputable industry news sources and publications.
Methodology
Step 1 - Identification of Relevant Samples Size from Population Database


Step 2 - Approaches for Defining Global Market Size (Value, Volume* & Price*)

Note*: In applicable scenarios
Step 3 - Data Sources
Primary Research
- Web Analytics
- Survey Reports
- Research Institute
- Latest Research Reports
- Opinion Leaders
Secondary Research
- Annual Reports
- White Paper
- Latest Press Release
- Industry Association
- Paid Database
- Investor Presentations

Step 4 - Data Triangulation
Involves using different sources of information in order to increase the validity of a study
These sources are likely to be stakeholders in a program - participants, other researchers, program staff, other community members, and so on.
Then we put all data in single framework & apply various statistical tools to find out the dynamic on the market.
During the analysis stage, feedback from the stakeholder groups would be compared to determine areas of agreement as well as areas of divergence


