
Key Insights
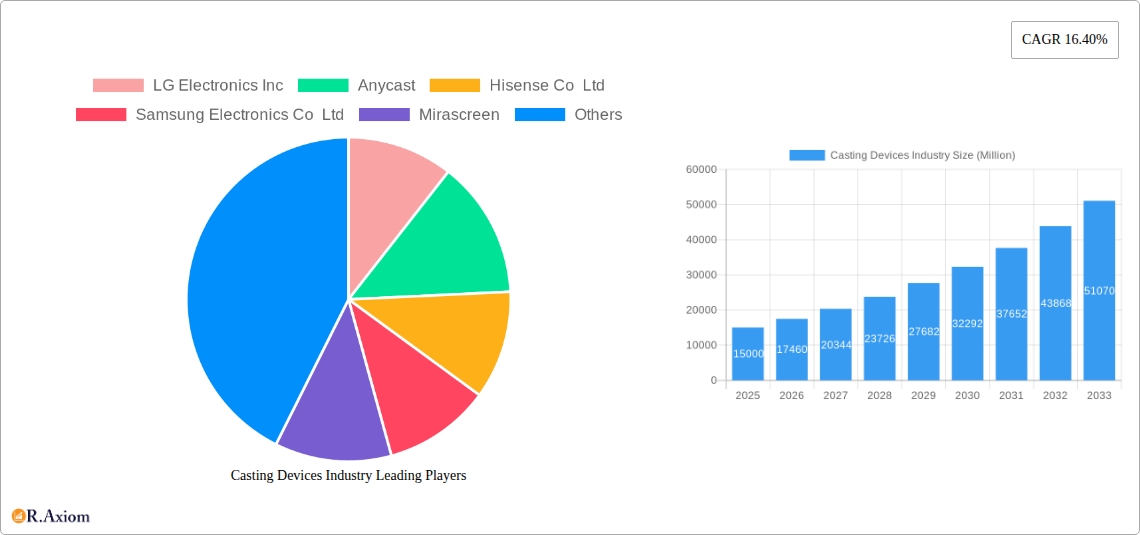
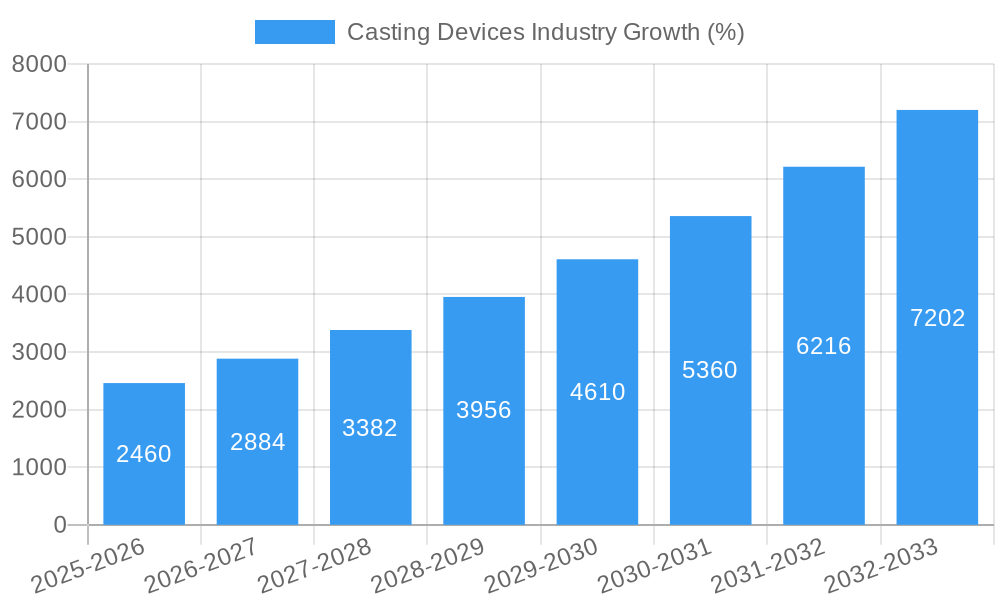
The global casting devices market, encompassing products like game consoles, media streamers, and smart TVs, is experiencing robust growth, projected to maintain a Compound Annual Growth Rate (CAGR) of 16.40% from 2025 to 2033. This expansion is fueled by several key drivers: the increasing popularity of streaming services, the rising demand for high-quality home entertainment, and the proliferation of smart homes integrated with seamless casting capabilities. Technological advancements, such as improved Wi-Fi standards and the development of more sophisticated casting protocols, are further accelerating market penetration. The market is segmented by type (Game Consoles, Media Streamers, Smart TVs) and end-user (Commercial, Residential), with residential applications currently dominating, driven by consumer adoption of convenient entertainment solutions. While challenges exist, such as potential network congestion and compatibility issues across different devices and platforms, the overall market trajectory remains positive. The competitive landscape is characterized by a blend of established tech giants like Google, Apple, and Amazon, alongside specialized manufacturers such as Roku and Chromecast, creating a dynamic market with diverse offerings.
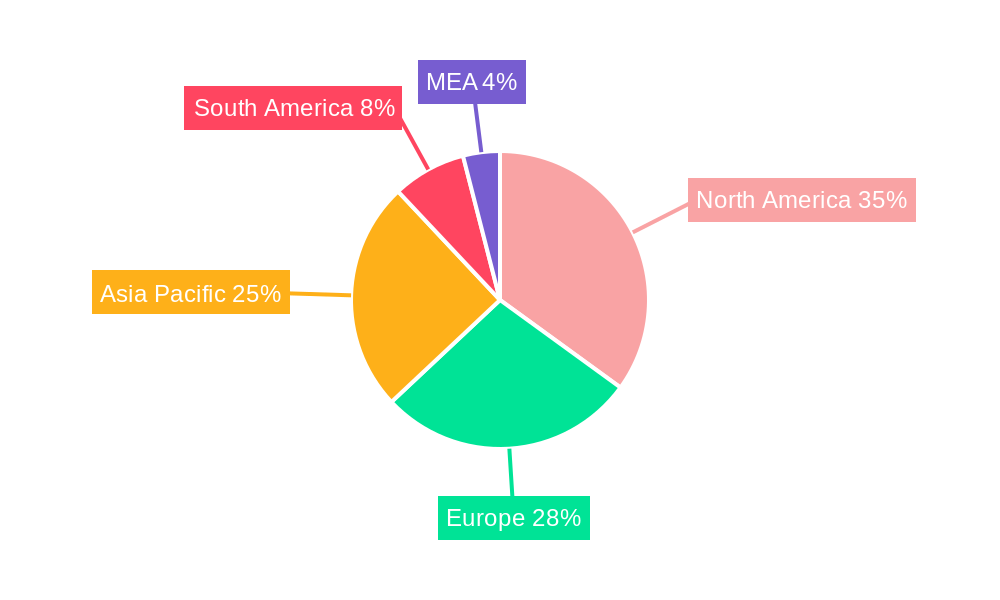
The regional distribution of the market reveals significant variations in growth potential. North America and Europe currently hold substantial market share, owing to high technological adoption rates and a well-developed infrastructure. However, Asia-Pacific is expected to witness rapid growth driven by increasing disposable incomes, expanding internet penetration, and a burgeoning middle class with a strong appetite for entertainment technologies. South America and the Middle East & Africa also present significant opportunities, though at a slightly slower pace due to factors such as varying levels of economic development and digital infrastructure. The forecast period (2025-2033) suggests sustained market expansion, with continued innovation, strategic partnerships, and aggressive marketing initiatives likely shaping the future competitive dynamics of this vibrant sector. Key players will need to focus on improving user experience, expanding device compatibility, and addressing potential challenges in network infrastructure to fully capitalize on the growth opportunities.
This detailed report provides a comprehensive analysis of the global Casting Devices industry, offering invaluable insights for stakeholders across the value chain. The report covers the period 2019-2033, with a focus on the estimated year 2025 and a forecast period of 2025-2033. The study meticulously examines market size, growth drivers, challenges, opportunities, and competitive dynamics, providing actionable intelligence for strategic decision-making. The report's analysis is supported by robust data, insightful commentary, and expert forecasts, delivering a complete picture of the Casting Devices landscape.
Casting Devices Industry Market Concentration & Innovation
The global Casting Devices market exhibits a moderately concentrated structure, with a few dominant players commanding significant market share. In 2024, the top five companies—Samsung Electronics Co Ltd, LG Electronics Inc, Amazon com Inc, Google Inc, and Apple Inc—held an estimated xx% of the total market share. This concentration is driven by the substantial investments these companies have made in R&D, resulting in continuous product innovation and robust brand recognition. Smaller players, such as Anycast, Hisense Co Ltd, Mirascreen, Microsoft Corporation, Airtame ApS, Roku Inc, Nvidia Corporation, and EZCast, compete primarily through niche product offerings and competitive pricing.
Innovation is a key driver of market growth, with ongoing advancements in streaming technologies, improved user interfaces, and enhanced connectivity features. Regulatory frameworks, particularly those related to data privacy and cybersecurity, are increasingly shaping the industry landscape. Product substitutes, such as traditional wired connections, pose a challenge, but the convenience and versatility of casting devices continue to drive adoption. End-user trends, particularly the shift towards smart homes and the increasing demand for high-quality streaming experiences, are fueling market expansion. M&A activity has been moderate, with deal values totaling an estimated xx Million in the last five years. These transactions have primarily focused on consolidating market share and expanding product portfolios.
- Key Metrics:
- Top 5 companies market share: xx% (2024)
- Total M&A deal value (2019-2024): xx Million
Casting Devices Industry Industry Trends & Insights
The global Casting Devices market is experiencing robust growth, driven by several key factors. The increasing penetration of smart TVs and smartphones has significantly boosted the demand for seamless content streaming. The rising adoption of streaming services, coupled with the desire for convenient access to entertainment content, is a primary growth catalyst. Technological advancements, including the development of higher bandwidth technologies and improved wireless protocols, are enhancing the streaming experience, thereby driving market expansion. Consumer preferences are shifting towards devices offering greater versatility, seamless integration with other smart home devices, and enhanced user interfaces.
Competitive dynamics are intense, with established players and new entrants vying for market share through continuous innovation, strategic partnerships, and competitive pricing strategies. The market is projected to experience a Compound Annual Growth Rate (CAGR) of xx% during the forecast period (2025-2033), reaching a market size of xx Million by 2033. Market penetration is expected to increase significantly, particularly in emerging markets, driven by rising disposable incomes and increasing internet connectivity. Technological disruptions, such as the introduction of new streaming protocols and advancements in artificial intelligence, are expected to reshape the industry landscape.
Dominant Markets & Segments in Casting Devices Industry
The North American region currently dominates the global Casting Devices market, driven by high consumer spending on electronics, widespread internet penetration, and the early adoption of smart home technologies. This dominance is further reinforced by the strong presence of major players such as Apple Inc, Google Inc, Amazon.com Inc., and Roku Inc. Within the product segments, Smart TVs contribute the largest share of the market, followed by Media Streamers and Game Consoles. Residential end-users constitute the largest segment, though the commercial sector is exhibiting strong growth, driven by demand for digital signage and corporate presentations.
Key Drivers of North American Dominance:
- High disposable incomes
- Advanced digital infrastructure
- Strong presence of major tech companies
- Early adoption of smart home technology
Key Drivers of Smart TV Segment Dominance:
- High demand for large-screen entertainment
- Integration with streaming services
- Enhanced user experience
Key Drivers of Residential Segment Dominance:
- Rising disposable incomes
- Increased adoption of smart home technologies
- Desire for convenient entertainment access
Casting Devices Industry Product Developments
Recent product innovations have focused on enhancing the streaming experience through improved video quality, reduced latency, and seamless integration with various devices and platforms. New features such as voice control, enhanced user interfaces, and expanded compatibility with various streaming services have enhanced the user experience. The market is witnessing a growing trend towards devices that integrate seamlessly with smart home ecosystems, offering enhanced convenience and control. These advancements are aimed at improving market fit by addressing consumer demand for a superior and user-friendly streaming experience.
Report Scope & Segmentation Analysis
This report segments the Casting Devices market based on Type (Game Consoles, Media Streamers, Smart TVs) and End-User (Commercial, Residential). The Smart TV segment is projected to experience the highest growth, driven by the increasing demand for large-screen, high-resolution displays and seamless integration with streaming services. The Media Streamers segment is also expected to show significant growth due to the rising popularity of streaming services and online content consumption. The Game Console segment is projected to demonstrate steady growth propelled by the ongoing popularity of video games and esports. The Residential segment represents the largest market share, while the Commercial segment is exhibiting rapid growth, driven by demand for digital signage solutions in retail, hospitality, and corporate environments.
Key Drivers of Casting Devices Industry Growth
The Casting Devices industry is experiencing strong growth, driven by several factors: The proliferation of streaming services is a key driver, as consumers increasingly rely on streaming for entertainment. The rise of smart homes and interconnected devices provides convenient and seamless integration for casting devices. Technological advancements, such as improved wireless protocols (Wi-Fi 6E, etc.) and higher bandwidth capabilities, lead to better streaming quality and reduced latency. Favorable economic conditions in several regions, particularly in developed economies, further boost consumer spending on electronics. Government initiatives promoting digital infrastructure development also support market growth.
Challenges in the Casting Devices Industry Sector
The Casting Devices industry faces several challenges. Competition is intense, with numerous established players and new entrants vying for market share. The industry is also susceptible to fluctuations in consumer spending due to economic downturns. Supply chain disruptions, particularly in the manufacturing and component supply, can significantly impact product availability and cost. Regulatory hurdles, such as data privacy regulations, add complexity to operations. The dependence on stable internet connectivity can limit adoption in areas with limited infrastructure.
Emerging Opportunities in Casting Devices Industry
Several emerging opportunities exist for the Casting Devices industry. The growth of the Internet of Things (IoT) offers opportunities for integrating casting devices into smart home ecosystems. The expansion into emerging markets with rising internet penetration and increasing disposable incomes presents considerable market potential. The development of more energy-efficient and environmentally friendly devices aligns with the growing global focus on sustainability. The demand for high-quality streaming experiences in VR and AR applications offers new market opportunities.
Leading Players in the Casting Devices Industry Market
- LG Electronics Inc
- Anycast
- Hisense Co Ltd
- Samsung Electronics Co Ltd
- Mirascreen
- Microsoft Corporation
- Amazon com Inc
- Airtame ApS
- Roku Inc
- Nvidia Corporation
- Google Inc
- Apple Inc
- EZCast
Key Developments in Casting Devices Industry Industry
- Q1 2023: Amazon launched its new Fire TV Stick 4K Max with enhanced processing power and features.
- Q3 2022: Google announced new Chromecast with Google TV features, focusing on improved user interface and voice control.
- Q4 2021: Samsung integrated advanced casting capabilities into its new Neo QLED TV range.
- Q2 2020: LG launched a new range of webOS-powered smart TVs with improved casting functionality.
Strategic Outlook for Casting Devices Industry Market
The Casting Devices industry is poised for continued growth driven by ongoing technological advancements, increasing consumer demand for convenient and high-quality streaming experiences, and expansion into new markets. The integration of casting technologies into smart home ecosystems, advancements in wireless technologies, and the rising adoption of streaming services will further propel market expansion. Companies that focus on innovation, strategic partnerships, and efficient supply chain management are expected to gain a competitive advantage in this dynamic market. The market holds substantial potential for future growth, particularly in emerging economies and with the ongoing development of new technologies and applications.
Casting Devices Industry Segmentation
-
1. Type
- 1.1. Game Consoles
- 1.2. Media Streamers
- 1.3. Smart TVs
-
2. End-User
- 2.1. Commercial
- 2.2. Residential
Casting Devices Industry Segmentation By Geography
- 1. North America
- 2. Europe
- 3. Asia Pacific
- 4. Rest of the World
Casting Devices Industry REPORT HIGHLIGHTS
| Aspects | Details |
|---|---|
| Study Period | 2019-2033 |
| Base Year | 2024 |
| Estimated Year | 2025 |
| Forecast Period | 2025-2033 |
| Historical Period | 2019-2024 |
| Growth Rate | CAGR of 16.40% from 2019-2033 |
| Segmentation |
|
Table of Contents
- 1. Introduction
- 1.1. Research Scope
- 1.2. Market Segmentation
- 1.3. Research Methodology
- 1.4. Definitions and Assumptions
- 2. Executive Summary
- 2.1. Introduction
- 3. Market Dynamics
- 3.1. Introduction
- 3.2. Market Drivers
- 3.2.1. ; Growing Consumption of Video-on-Demand (VoD) Services; Increasing Adoption of Casting Devices with Changing Consumer Behavior
- 3.3. Market Restrains
- 3.3.1. ; Increasing Availability of Native Smart TV Apps
- 3.4. Market Trends
- 3.4.1. Smart TV Segment is expected to occupy a Significant Market Share during the Forecast Period
- 4. Market Factor Analysis
- 4.1. Porters Five Forces
- 4.2. Supply/Value Chain
- 4.3. PESTEL analysis
- 4.4. Market Entropy
- 4.5. Patent/Trademark Analysis
- 5. Global Casting Devices Industry Analysis, Insights and Forecast, 2019-2031
- 5.1. Market Analysis, Insights and Forecast - by Type
- 5.1.1. Game Consoles
- 5.1.2. Media Streamers
- 5.1.3. Smart TVs
- 5.2. Market Analysis, Insights and Forecast - by End-User
- 5.2.1. Commercial
- 5.2.2. Residential
- 5.3. Market Analysis, Insights and Forecast - by Region
- 5.3.1. North America
- 5.3.2. Europe
- 5.3.3. Asia Pacific
- 5.3.4. Rest of the World
- 5.1. Market Analysis, Insights and Forecast - by Type
- 6. North America Casting Devices Industry Analysis, Insights and Forecast, 2019-2031
- 6.1. Market Analysis, Insights and Forecast - by Type
- 6.1.1. Game Consoles
- 6.1.2. Media Streamers
- 6.1.3. Smart TVs
- 6.2. Market Analysis, Insights and Forecast - by End-User
- 6.2.1. Commercial
- 6.2.2. Residential
- 6.1. Market Analysis, Insights and Forecast - by Type
- 7. Europe Casting Devices Industry Analysis, Insights and Forecast, 2019-2031
- 7.1. Market Analysis, Insights and Forecast - by Type
- 7.1.1. Game Consoles
- 7.1.2. Media Streamers
- 7.1.3. Smart TVs
- 7.2. Market Analysis, Insights and Forecast - by End-User
- 7.2.1. Commercial
- 7.2.2. Residential
- 7.1. Market Analysis, Insights and Forecast - by Type
- 8. Asia Pacific Casting Devices Industry Analysis, Insights and Forecast, 2019-2031
- 8.1. Market Analysis, Insights and Forecast - by Type
- 8.1.1. Game Consoles
- 8.1.2. Media Streamers
- 8.1.3. Smart TVs
- 8.2. Market Analysis, Insights and Forecast - by End-User
- 8.2.1. Commercial
- 8.2.2. Residential
- 8.1. Market Analysis, Insights and Forecast - by Type
- 9. Rest of the World Casting Devices Industry Analysis, Insights and Forecast, 2019-2031
- 9.1. Market Analysis, Insights and Forecast - by Type
- 9.1.1. Game Consoles
- 9.1.2. Media Streamers
- 9.1.3. Smart TVs
- 9.2. Market Analysis, Insights and Forecast - by End-User
- 9.2.1. Commercial
- 9.2.2. Residential
- 9.1. Market Analysis, Insights and Forecast - by Type
- 10. North America Casting Devices Industry Analysis, Insights and Forecast, 2019-2031
- 10.1. Market Analysis, Insights and Forecast - By Country/Sub-region
- 10.1.1 United States
- 10.1.2 Canada
- 10.1.3 Mexico
- 11. Europe Casting Devices Industry Analysis, Insights and Forecast, 2019-2031
- 11.1. Market Analysis, Insights and Forecast - By Country/Sub-region
- 11.1.1 Germany
- 11.1.2 United Kingdom
- 11.1.3 France
- 11.1.4 Spain
- 11.1.5 Italy
- 11.1.6 Spain
- 11.1.7 Belgium
- 11.1.8 Netherland
- 11.1.9 Nordics
- 11.1.10 Rest of Europe
- 12. Asia Pacific Casting Devices Industry Analysis, Insights and Forecast, 2019-2031
- 12.1. Market Analysis, Insights and Forecast - By Country/Sub-region
- 12.1.1 China
- 12.1.2 Japan
- 12.1.3 India
- 12.1.4 South Korea
- 12.1.5 Southeast Asia
- 12.1.6 Australia
- 12.1.7 Indonesia
- 12.1.8 Phillipes
- 12.1.9 Singapore
- 12.1.10 Thailandc
- 12.1.11 Rest of Asia Pacific
- 13. South America Casting Devices Industry Analysis, Insights and Forecast, 2019-2031
- 13.1. Market Analysis, Insights and Forecast - By Country/Sub-region
- 13.1.1 Brazil
- 13.1.2 Argentina
- 13.1.3 Peru
- 13.1.4 Chile
- 13.1.5 Colombia
- 13.1.6 Ecuador
- 13.1.7 Venezuela
- 13.1.8 Rest of South America
- 14. North America Casting Devices Industry Analysis, Insights and Forecast, 2019-2031
- 14.1. Market Analysis, Insights and Forecast - By Country/Sub-region
- 14.1.1 United States
- 14.1.2 Canada
- 14.1.3 Mexico
- 15. MEA Casting Devices Industry Analysis, Insights and Forecast, 2019-2031
- 15.1. Market Analysis, Insights and Forecast - By Country/Sub-region
- 15.1.1 United Arab Emirates
- 15.1.2 Saudi Arabia
- 15.1.3 South Africa
- 15.1.4 Rest of Middle East and Africa
- 16. Competitive Analysis
- 16.1. Global Market Share Analysis 2024
- 16.2. Company Profiles
- 16.2.1 LG Electronics Inc
- 16.2.1.1. Overview
- 16.2.1.2. Products
- 16.2.1.3. SWOT Analysis
- 16.2.1.4. Recent Developments
- 16.2.1.5. Financials (Based on Availability)
- 16.2.2 Anycast
- 16.2.2.1. Overview
- 16.2.2.2. Products
- 16.2.2.3. SWOT Analysis
- 16.2.2.4. Recent Developments
- 16.2.2.5. Financials (Based on Availability)
- 16.2.3 Hisense Co Ltd
- 16.2.3.1. Overview
- 16.2.3.2. Products
- 16.2.3.3. SWOT Analysis
- 16.2.3.4. Recent Developments
- 16.2.3.5. Financials (Based on Availability)
- 16.2.4 Samsung Electronics Co Ltd
- 16.2.4.1. Overview
- 16.2.4.2. Products
- 16.2.4.3. SWOT Analysis
- 16.2.4.4. Recent Developments
- 16.2.4.5. Financials (Based on Availability)
- 16.2.5 Mirascreen
- 16.2.5.1. Overview
- 16.2.5.2. Products
- 16.2.5.3. SWOT Analysis
- 16.2.5.4. Recent Developments
- 16.2.5.5. Financials (Based on Availability)
- 16.2.6 Microsoft Corporation
- 16.2.6.1. Overview
- 16.2.6.2. Products
- 16.2.6.3. SWOT Analysis
- 16.2.6.4. Recent Developments
- 16.2.6.5. Financials (Based on Availability)
- 16.2.7 Amazon com Inc
- 16.2.7.1. Overview
- 16.2.7.2. Products
- 16.2.7.3. SWOT Analysis
- 16.2.7.4. Recent Developments
- 16.2.7.5. Financials (Based on Availability)
- 16.2.8 Airtame ApS
- 16.2.8.1. Overview
- 16.2.8.2. Products
- 16.2.8.3. SWOT Analysis
- 16.2.8.4. Recent Developments
- 16.2.8.5. Financials (Based on Availability)
- 16.2.9 Roku Inc
- 16.2.9.1. Overview
- 16.2.9.2. Products
- 16.2.9.3. SWOT Analysis
- 16.2.9.4. Recent Developments
- 16.2.9.5. Financials (Based on Availability)
- 16.2.10 Nvidia Corporation
- 16.2.10.1. Overview
- 16.2.10.2. Products
- 16.2.10.3. SWOT Analysis
- 16.2.10.4. Recent Developments
- 16.2.10.5. Financials (Based on Availability)
- 16.2.11 Google Inc
- 16.2.11.1. Overview
- 16.2.11.2. Products
- 16.2.11.3. SWOT Analysis
- 16.2.11.4. Recent Developments
- 16.2.11.5. Financials (Based on Availability)
- 16.2.12 Apple Inc
- 16.2.12.1. Overview
- 16.2.12.2. Products
- 16.2.12.3. SWOT Analysis
- 16.2.12.4. Recent Developments
- 16.2.12.5. Financials (Based on Availability)
- 16.2.13 EZCast
- 16.2.13.1. Overview
- 16.2.13.2. Products
- 16.2.13.3. SWOT Analysis
- 16.2.13.4. Recent Developments
- 16.2.13.5. Financials (Based on Availability)
- 16.2.1 LG Electronics Inc
List of Figures
- Figure 1: Global Casting Devices Industry Revenue Breakdown (Million, %) by Region 2024 & 2032
- Figure 2: Global Casting Devices Industry Volume Breakdown (K Unit, %) by Region 2024 & 2032
- Figure 3: North America Casting Devices Industry Revenue (Million), by Country 2024 & 2032
- Figure 4: North America Casting Devices Industry Volume (K Unit), by Country 2024 & 2032
- Figure 5: North America Casting Devices Industry Revenue Share (%), by Country 2024 & 2032
- Figure 6: North America Casting Devices Industry Volume Share (%), by Country 2024 & 2032
- Figure 7: Europe Casting Devices Industry Revenue (Million), by Country 2024 & 2032
- Figure 8: Europe Casting Devices Industry Volume (K Unit), by Country 2024 & 2032
- Figure 9: Europe Casting Devices Industry Revenue Share (%), by Country 2024 & 2032
- Figure 10: Europe Casting Devices Industry Volume Share (%), by Country 2024 & 2032
- Figure 11: Asia Pacific Casting Devices Industry Revenue (Million), by Country 2024 & 2032
- Figure 12: Asia Pacific Casting Devices Industry Volume (K Unit), by Country 2024 & 2032
- Figure 13: Asia Pacific Casting Devices Industry Revenue Share (%), by Country 2024 & 2032
- Figure 14: Asia Pacific Casting Devices Industry Volume Share (%), by Country 2024 & 2032
- Figure 15: South America Casting Devices Industry Revenue (Million), by Country 2024 & 2032
- Figure 16: South America Casting Devices Industry Volume (K Unit), by Country 2024 & 2032
- Figure 17: South America Casting Devices Industry Revenue Share (%), by Country 2024 & 2032
- Figure 18: South America Casting Devices Industry Volume Share (%), by Country 2024 & 2032
- Figure 19: North America Casting Devices Industry Revenue (Million), by Country 2024 & 2032
- Figure 20: North America Casting Devices Industry Volume (K Unit), by Country 2024 & 2032
- Figure 21: North America Casting Devices Industry Revenue Share (%), by Country 2024 & 2032
- Figure 22: North America Casting Devices Industry Volume Share (%), by Country 2024 & 2032
- Figure 23: MEA Casting Devices Industry Revenue (Million), by Country 2024 & 2032
- Figure 24: MEA Casting Devices Industry Volume (K Unit), by Country 2024 & 2032
- Figure 25: MEA Casting Devices Industry Revenue Share (%), by Country 2024 & 2032
- Figure 26: MEA Casting Devices Industry Volume Share (%), by Country 2024 & 2032
- Figure 27: North America Casting Devices Industry Revenue (Million), by Type 2024 & 2032
- Figure 28: North America Casting Devices Industry Volume (K Unit), by Type 2024 & 2032
- Figure 29: North America Casting Devices Industry Revenue Share (%), by Type 2024 & 2032
- Figure 30: North America Casting Devices Industry Volume Share (%), by Type 2024 & 2032
- Figure 31: North America Casting Devices Industry Revenue (Million), by End-User 2024 & 2032
- Figure 32: North America Casting Devices Industry Volume (K Unit), by End-User 2024 & 2032
- Figure 33: North America Casting Devices Industry Revenue Share (%), by End-User 2024 & 2032
- Figure 34: North America Casting Devices Industry Volume Share (%), by End-User 2024 & 2032
- Figure 35: North America Casting Devices Industry Revenue (Million), by Country 2024 & 2032
- Figure 36: North America Casting Devices Industry Volume (K Unit), by Country 2024 & 2032
- Figure 37: North America Casting Devices Industry Revenue Share (%), by Country 2024 & 2032
- Figure 38: North America Casting Devices Industry Volume Share (%), by Country 2024 & 2032
- Figure 39: Europe Casting Devices Industry Revenue (Million), by Type 2024 & 2032
- Figure 40: Europe Casting Devices Industry Volume (K Unit), by Type 2024 & 2032
- Figure 41: Europe Casting Devices Industry Revenue Share (%), by Type 2024 & 2032
- Figure 42: Europe Casting Devices Industry Volume Share (%), by Type 2024 & 2032
- Figure 43: Europe Casting Devices Industry Revenue (Million), by End-User 2024 & 2032
- Figure 44: Europe Casting Devices Industry Volume (K Unit), by End-User 2024 & 2032
- Figure 45: Europe Casting Devices Industry Revenue Share (%), by End-User 2024 & 2032
- Figure 46: Europe Casting Devices Industry Volume Share (%), by End-User 2024 & 2032
- Figure 47: Europe Casting Devices Industry Revenue (Million), by Country 2024 & 2032
- Figure 48: Europe Casting Devices Industry Volume (K Unit), by Country 2024 & 2032
- Figure 49: Europe Casting Devices Industry Revenue Share (%), by Country 2024 & 2032
- Figure 50: Europe Casting Devices Industry Volume Share (%), by Country 2024 & 2032
- Figure 51: Asia Pacific Casting Devices Industry Revenue (Million), by Type 2024 & 2032
- Figure 52: Asia Pacific Casting Devices Industry Volume (K Unit), by Type 2024 & 2032
- Figure 53: Asia Pacific Casting Devices Industry Revenue Share (%), by Type 2024 & 2032
- Figure 54: Asia Pacific Casting Devices Industry Volume Share (%), by Type 2024 & 2032
- Figure 55: Asia Pacific Casting Devices Industry Revenue (Million), by End-User 2024 & 2032
- Figure 56: Asia Pacific Casting Devices Industry Volume (K Unit), by End-User 2024 & 2032
- Figure 57: Asia Pacific Casting Devices Industry Revenue Share (%), by End-User 2024 & 2032
- Figure 58: Asia Pacific Casting Devices Industry Volume Share (%), by End-User 2024 & 2032
- Figure 59: Asia Pacific Casting Devices Industry Revenue (Million), by Country 2024 & 2032
- Figure 60: Asia Pacific Casting Devices Industry Volume (K Unit), by Country 2024 & 2032
- Figure 61: Asia Pacific Casting Devices Industry Revenue Share (%), by Country 2024 & 2032
- Figure 62: Asia Pacific Casting Devices Industry Volume Share (%), by Country 2024 & 2032
- Figure 63: Rest of the World Casting Devices Industry Revenue (Million), by Type 2024 & 2032
- Figure 64: Rest of the World Casting Devices Industry Volume (K Unit), by Type 2024 & 2032
- Figure 65: Rest of the World Casting Devices Industry Revenue Share (%), by Type 2024 & 2032
- Figure 66: Rest of the World Casting Devices Industry Volume Share (%), by Type 2024 & 2032
- Figure 67: Rest of the World Casting Devices Industry Revenue (Million), by End-User 2024 & 2032
- Figure 68: Rest of the World Casting Devices Industry Volume (K Unit), by End-User 2024 & 2032
- Figure 69: Rest of the World Casting Devices Industry Revenue Share (%), by End-User 2024 & 2032
- Figure 70: Rest of the World Casting Devices Industry Volume Share (%), by End-User 2024 & 2032
- Figure 71: Rest of the World Casting Devices Industry Revenue (Million), by Country 2024 & 2032
- Figure 72: Rest of the World Casting Devices Industry Volume (K Unit), by Country 2024 & 2032
- Figure 73: Rest of the World Casting Devices Industry Revenue Share (%), by Country 2024 & 2032
- Figure 74: Rest of the World Casting Devices Industry Volume Share (%), by Country 2024 & 2032
List of Tables
- Table 1: Global Casting Devices Industry Revenue Million Forecast, by Region 2019 & 2032
- Table 2: Global Casting Devices Industry Volume K Unit Forecast, by Region 2019 & 2032
- Table 3: Global Casting Devices Industry Revenue Million Forecast, by Type 2019 & 2032
- Table 4: Global Casting Devices Industry Volume K Unit Forecast, by Type 2019 & 2032
- Table 5: Global Casting Devices Industry Revenue Million Forecast, by End-User 2019 & 2032
- Table 6: Global Casting Devices Industry Volume K Unit Forecast, by End-User 2019 & 2032
- Table 7: Global Casting Devices Industry Revenue Million Forecast, by Region 2019 & 2032
- Table 8: Global Casting Devices Industry Volume K Unit Forecast, by Region 2019 & 2032
- Table 9: Global Casting Devices Industry Revenue Million Forecast, by Country 2019 & 2032
- Table 10: Global Casting Devices Industry Volume K Unit Forecast, by Country 2019 & 2032
- Table 11: United States Casting Devices Industry Revenue (Million) Forecast, by Application 2019 & 2032
- Table 12: United States Casting Devices Industry Volume (K Unit) Forecast, by Application 2019 & 2032
- Table 13: Canada Casting Devices Industry Revenue (Million) Forecast, by Application 2019 & 2032
- Table 14: Canada Casting Devices Industry Volume (K Unit) Forecast, by Application 2019 & 2032
- Table 15: Mexico Casting Devices Industry Revenue (Million) Forecast, by Application 2019 & 2032
- Table 16: Mexico Casting Devices Industry Volume (K Unit) Forecast, by Application 2019 & 2032
- Table 17: Global Casting Devices Industry Revenue Million Forecast, by Country 2019 & 2032
- Table 18: Global Casting Devices Industry Volume K Unit Forecast, by Country 2019 & 2032
- Table 19: Germany Casting Devices Industry Revenue (Million) Forecast, by Application 2019 & 2032
- Table 20: Germany Casting Devices Industry Volume (K Unit) Forecast, by Application 2019 & 2032
- Table 21: United Kingdom Casting Devices Industry Revenue (Million) Forecast, by Application 2019 & 2032
- Table 22: United Kingdom Casting Devices Industry Volume (K Unit) Forecast, by Application 2019 & 2032
- Table 23: France Casting Devices Industry Revenue (Million) Forecast, by Application 2019 & 2032
- Table 24: France Casting Devices Industry Volume (K Unit) Forecast, by Application 2019 & 2032
- Table 25: Spain Casting Devices Industry Revenue (Million) Forecast, by Application 2019 & 2032
- Table 26: Spain Casting Devices Industry Volume (K Unit) Forecast, by Application 2019 & 2032
- Table 27: Italy Casting Devices Industry Revenue (Million) Forecast, by Application 2019 & 2032
- Table 28: Italy Casting Devices Industry Volume (K Unit) Forecast, by Application 2019 & 2032
- Table 29: Spain Casting Devices Industry Revenue (Million) Forecast, by Application 2019 & 2032
- Table 30: Spain Casting Devices Industry Volume (K Unit) Forecast, by Application 2019 & 2032
- Table 31: Belgium Casting Devices Industry Revenue (Million) Forecast, by Application 2019 & 2032
- Table 32: Belgium Casting Devices Industry Volume (K Unit) Forecast, by Application 2019 & 2032
- Table 33: Netherland Casting Devices Industry Revenue (Million) Forecast, by Application 2019 & 2032
- Table 34: Netherland Casting Devices Industry Volume (K Unit) Forecast, by Application 2019 & 2032
- Table 35: Nordics Casting Devices Industry Revenue (Million) Forecast, by Application 2019 & 2032
- Table 36: Nordics Casting Devices Industry Volume (K Unit) Forecast, by Application 2019 & 2032
- Table 37: Rest of Europe Casting Devices Industry Revenue (Million) Forecast, by Application 2019 & 2032
- Table 38: Rest of Europe Casting Devices Industry Volume (K Unit) Forecast, by Application 2019 & 2032
- Table 39: Global Casting Devices Industry Revenue Million Forecast, by Country 2019 & 2032
- Table 40: Global Casting Devices Industry Volume K Unit Forecast, by Country 2019 & 2032
- Table 41: China Casting Devices Industry Revenue (Million) Forecast, by Application 2019 & 2032
- Table 42: China Casting Devices Industry Volume (K Unit) Forecast, by Application 2019 & 2032
- Table 43: Japan Casting Devices Industry Revenue (Million) Forecast, by Application 2019 & 2032
- Table 44: Japan Casting Devices Industry Volume (K Unit) Forecast, by Application 2019 & 2032
- Table 45: India Casting Devices Industry Revenue (Million) Forecast, by Application 2019 & 2032
- Table 46: India Casting Devices Industry Volume (K Unit) Forecast, by Application 2019 & 2032
- Table 47: South Korea Casting Devices Industry Revenue (Million) Forecast, by Application 2019 & 2032
- Table 48: South Korea Casting Devices Industry Volume (K Unit) Forecast, by Application 2019 & 2032
- Table 49: Southeast Asia Casting Devices Industry Revenue (Million) Forecast, by Application 2019 & 2032
- Table 50: Southeast Asia Casting Devices Industry Volume (K Unit) Forecast, by Application 2019 & 2032
- Table 51: Australia Casting Devices Industry Revenue (Million) Forecast, by Application 2019 & 2032
- Table 52: Australia Casting Devices Industry Volume (K Unit) Forecast, by Application 2019 & 2032
- Table 53: Indonesia Casting Devices Industry Revenue (Million) Forecast, by Application 2019 & 2032
- Table 54: Indonesia Casting Devices Industry Volume (K Unit) Forecast, by Application 2019 & 2032
- Table 55: Phillipes Casting Devices Industry Revenue (Million) Forecast, by Application 2019 & 2032
- Table 56: Phillipes Casting Devices Industry Volume (K Unit) Forecast, by Application 2019 & 2032
- Table 57: Singapore Casting Devices Industry Revenue (Million) Forecast, by Application 2019 & 2032
- Table 58: Singapore Casting Devices Industry Volume (K Unit) Forecast, by Application 2019 & 2032
- Table 59: Thailandc Casting Devices Industry Revenue (Million) Forecast, by Application 2019 & 2032
- Table 60: Thailandc Casting Devices Industry Volume (K Unit) Forecast, by Application 2019 & 2032
- Table 61: Rest of Asia Pacific Casting Devices Industry Revenue (Million) Forecast, by Application 2019 & 2032
- Table 62: Rest of Asia Pacific Casting Devices Industry Volume (K Unit) Forecast, by Application 2019 & 2032
- Table 63: Global Casting Devices Industry Revenue Million Forecast, by Country 2019 & 2032
- Table 64: Global Casting Devices Industry Volume K Unit Forecast, by Country 2019 & 2032
- Table 65: Brazil Casting Devices Industry Revenue (Million) Forecast, by Application 2019 & 2032
- Table 66: Brazil Casting Devices Industry Volume (K Unit) Forecast, by Application 2019 & 2032
- Table 67: Argentina Casting Devices Industry Revenue (Million) Forecast, by Application 2019 & 2032
- Table 68: Argentina Casting Devices Industry Volume (K Unit) Forecast, by Application 2019 & 2032
- Table 69: Peru Casting Devices Industry Revenue (Million) Forecast, by Application 2019 & 2032
- Table 70: Peru Casting Devices Industry Volume (K Unit) Forecast, by Application 2019 & 2032
- Table 71: Chile Casting Devices Industry Revenue (Million) Forecast, by Application 2019 & 2032
- Table 72: Chile Casting Devices Industry Volume (K Unit) Forecast, by Application 2019 & 2032
- Table 73: Colombia Casting Devices Industry Revenue (Million) Forecast, by Application 2019 & 2032
- Table 74: Colombia Casting Devices Industry Volume (K Unit) Forecast, by Application 2019 & 2032
- Table 75: Ecuador Casting Devices Industry Revenue (Million) Forecast, by Application 2019 & 2032
- Table 76: Ecuador Casting Devices Industry Volume (K Unit) Forecast, by Application 2019 & 2032
- Table 77: Venezuela Casting Devices Industry Revenue (Million) Forecast, by Application 2019 & 2032
- Table 78: Venezuela Casting Devices Industry Volume (K Unit) Forecast, by Application 2019 & 2032
- Table 79: Rest of South America Casting Devices Industry Revenue (Million) Forecast, by Application 2019 & 2032
- Table 80: Rest of South America Casting Devices Industry Volume (K Unit) Forecast, by Application 2019 & 2032
- Table 81: Global Casting Devices Industry Revenue Million Forecast, by Country 2019 & 2032
- Table 82: Global Casting Devices Industry Volume K Unit Forecast, by Country 2019 & 2032
- Table 83: United States Casting Devices Industry Revenue (Million) Forecast, by Application 2019 & 2032
- Table 84: United States Casting Devices Industry Volume (K Unit) Forecast, by Application 2019 & 2032
- Table 85: Canada Casting Devices Industry Revenue (Million) Forecast, by Application 2019 & 2032
- Table 86: Canada Casting Devices Industry Volume (K Unit) Forecast, by Application 2019 & 2032
- Table 87: Mexico Casting Devices Industry Revenue (Million) Forecast, by Application 2019 & 2032
- Table 88: Mexico Casting Devices Industry Volume (K Unit) Forecast, by Application 2019 & 2032
- Table 89: Global Casting Devices Industry Revenue Million Forecast, by Country 2019 & 2032
- Table 90: Global Casting Devices Industry Volume K Unit Forecast, by Country 2019 & 2032
- Table 91: United Arab Emirates Casting Devices Industry Revenue (Million) Forecast, by Application 2019 & 2032
- Table 92: United Arab Emirates Casting Devices Industry Volume (K Unit) Forecast, by Application 2019 & 2032
- Table 93: Saudi Arabia Casting Devices Industry Revenue (Million) Forecast, by Application 2019 & 2032
- Table 94: Saudi Arabia Casting Devices Industry Volume (K Unit) Forecast, by Application 2019 & 2032
- Table 95: South Africa Casting Devices Industry Revenue (Million) Forecast, by Application 2019 & 2032
- Table 96: South Africa Casting Devices Industry Volume (K Unit) Forecast, by Application 2019 & 2032
- Table 97: Rest of Middle East and Africa Casting Devices Industry Revenue (Million) Forecast, by Application 2019 & 2032
- Table 98: Rest of Middle East and Africa Casting Devices Industry Volume (K Unit) Forecast, by Application 2019 & 2032
- Table 99: Global Casting Devices Industry Revenue Million Forecast, by Type 2019 & 2032
- Table 100: Global Casting Devices Industry Volume K Unit Forecast, by Type 2019 & 2032
- Table 101: Global Casting Devices Industry Revenue Million Forecast, by End-User 2019 & 2032
- Table 102: Global Casting Devices Industry Volume K Unit Forecast, by End-User 2019 & 2032
- Table 103: Global Casting Devices Industry Revenue Million Forecast, by Country 2019 & 2032
- Table 104: Global Casting Devices Industry Volume K Unit Forecast, by Country 2019 & 2032
- Table 105: Global Casting Devices Industry Revenue Million Forecast, by Type 2019 & 2032
- Table 106: Global Casting Devices Industry Volume K Unit Forecast, by Type 2019 & 2032
- Table 107: Global Casting Devices Industry Revenue Million Forecast, by End-User 2019 & 2032
- Table 108: Global Casting Devices Industry Volume K Unit Forecast, by End-User 2019 & 2032
- Table 109: Global Casting Devices Industry Revenue Million Forecast, by Country 2019 & 2032
- Table 110: Global Casting Devices Industry Volume K Unit Forecast, by Country 2019 & 2032
- Table 111: Global Casting Devices Industry Revenue Million Forecast, by Type 2019 & 2032
- Table 112: Global Casting Devices Industry Volume K Unit Forecast, by Type 2019 & 2032
- Table 113: Global Casting Devices Industry Revenue Million Forecast, by End-User 2019 & 2032
- Table 114: Global Casting Devices Industry Volume K Unit Forecast, by End-User 2019 & 2032
- Table 115: Global Casting Devices Industry Revenue Million Forecast, by Country 2019 & 2032
- Table 116: Global Casting Devices Industry Volume K Unit Forecast, by Country 2019 & 2032
- Table 117: Global Casting Devices Industry Revenue Million Forecast, by Type 2019 & 2032
- Table 118: Global Casting Devices Industry Volume K Unit Forecast, by Type 2019 & 2032
- Table 119: Global Casting Devices Industry Revenue Million Forecast, by End-User 2019 & 2032
- Table 120: Global Casting Devices Industry Volume K Unit Forecast, by End-User 2019 & 2032
- Table 121: Global Casting Devices Industry Revenue Million Forecast, by Country 2019 & 2032
- Table 122: Global Casting Devices Industry Volume K Unit Forecast, by Country 2019 & 2032
Frequently Asked Questions
1. What is the projected Compound Annual Growth Rate (CAGR) of the Casting Devices Industry?
The projected CAGR is approximately 16.40%.
2. Which companies are prominent players in the Casting Devices Industry?
Key companies in the market include LG Electronics Inc, Anycast, Hisense Co Ltd, Samsung Electronics Co Ltd, Mirascreen, Microsoft Corporation, Amazon com Inc , Airtame ApS, Roku Inc, Nvidia Corporation, Google Inc, Apple Inc, EZCast.
3. What are the main segments of the Casting Devices Industry?
The market segments include Type, End-User.
4. Can you provide details about the market size?
The market size is estimated to be USD XX Million as of 2022.
5. What are some drivers contributing to market growth?
; Growing Consumption of Video-on-Demand (VoD) Services; Increasing Adoption of Casting Devices with Changing Consumer Behavior.
6. What are the notable trends driving market growth?
Smart TV Segment is expected to occupy a Significant Market Share during the Forecast Period.
7. Are there any restraints impacting market growth?
; Increasing Availability of Native Smart TV Apps.
8. Can you provide examples of recent developments in the market?
N/A
9. What pricing options are available for accessing the report?
Pricing options include single-user, multi-user, and enterprise licenses priced at USD 4750, USD 5250, and USD 8750 respectively.
10. Is the market size provided in terms of value or volume?
The market size is provided in terms of value, measured in Million and volume, measured in K Unit.
11. Are there any specific market keywords associated with the report?
Yes, the market keyword associated with the report is "Casting Devices Industry," which aids in identifying and referencing the specific market segment covered.
12. How do I determine which pricing option suits my needs best?
The pricing options vary based on user requirements and access needs. Individual users may opt for single-user licenses, while businesses requiring broader access may choose multi-user or enterprise licenses for cost-effective access to the report.
13. Are there any additional resources or data provided in the Casting Devices Industry report?
While the report offers comprehensive insights, it's advisable to review the specific contents or supplementary materials provided to ascertain if additional resources or data are available.
14. How can I stay updated on further developments or reports in the Casting Devices Industry?
To stay informed about further developments, trends, and reports in the Casting Devices Industry, consider subscribing to industry newsletters, following relevant companies and organizations, or regularly checking reputable industry news sources and publications.
Methodology
Step 1 - Identification of Relevant Samples Size from Population Database


Step 2 - Approaches for Defining Global Market Size (Value, Volume* & Price*)

Note*: In applicable scenarios
Step 3 - Data Sources
Primary Research
- Web Analytics
- Survey Reports
- Research Institute
- Latest Research Reports
- Opinion Leaders
Secondary Research
- Annual Reports
- White Paper
- Latest Press Release
- Industry Association
- Paid Database
- Investor Presentations

Step 4 - Data Triangulation
Involves using different sources of information in order to increase the validity of a study
These sources are likely to be stakeholders in a program - participants, other researchers, program staff, other community members, and so on.
Then we put all data in single framework & apply various statistical tools to find out the dynamic on the market.
During the analysis stage, feedback from the stakeholder groups would be compared to determine areas of agreement as well as areas of divergence


