
Key Insights
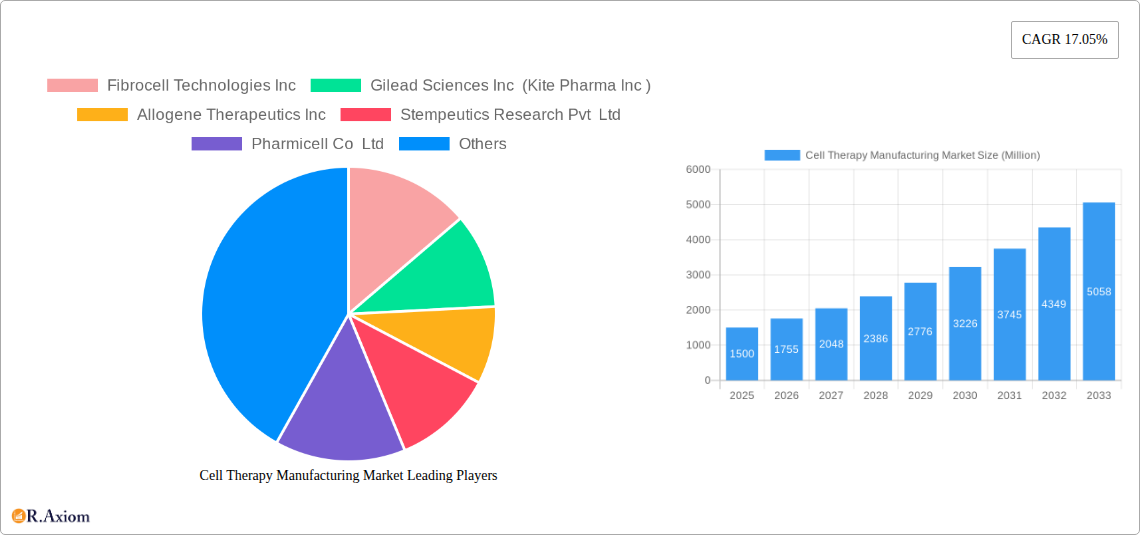
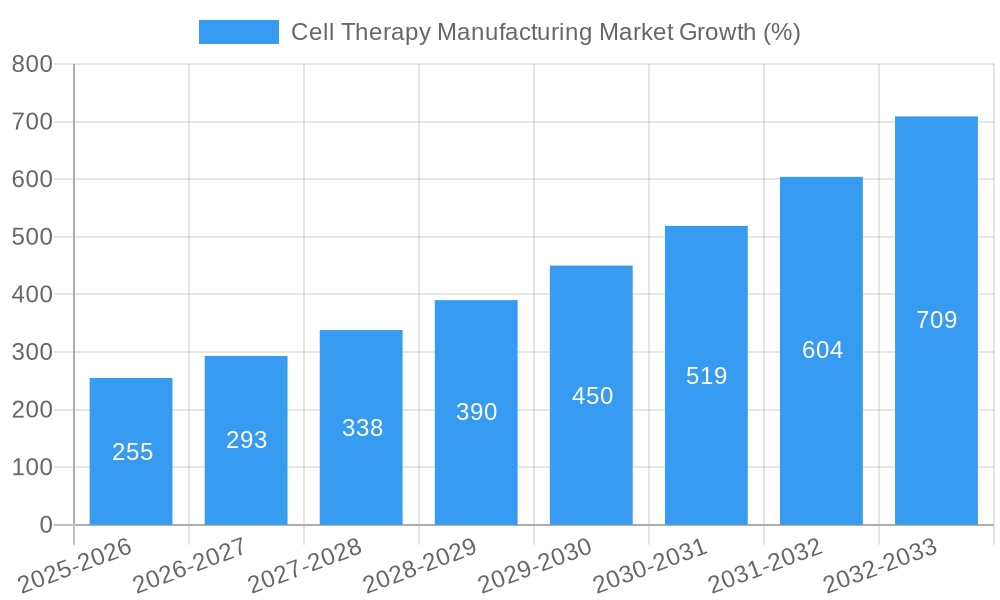
The Cell Therapy Manufacturing market is experiencing robust growth, projected to reach a significant value by 2033, driven by a 17.05% CAGR from 2019 to 2024. This expansion is fueled by several key factors. Advancements in cell processing technologies, coupled with increased understanding of cellular mechanisms and improved clinical outcomes, are significantly boosting market adoption. The rising prevalence of chronic diseases like cardiovascular conditions, musculoskeletal disorders, and malignancies is creating a substantial demand for effective cell therapies. Regulatory approvals for novel cell therapy products are further accelerating market penetration, encouraging investment in research and development and expanding manufacturing capacities. The increasing accessibility of advanced therapies and the growing emphasis on personalized medicine contribute to the market's positive trajectory. Different cell types, including mesenchymal stem cells, fibroblasts, and hematopoietic stem cells are used in diverse applications such as musculoskeletal regeneration, cancer treatment, and dermatological applications, driving segmental growth. The significant investments made by major pharmaceutical companies in developing and commercializing these therapies further validate the market's potential.
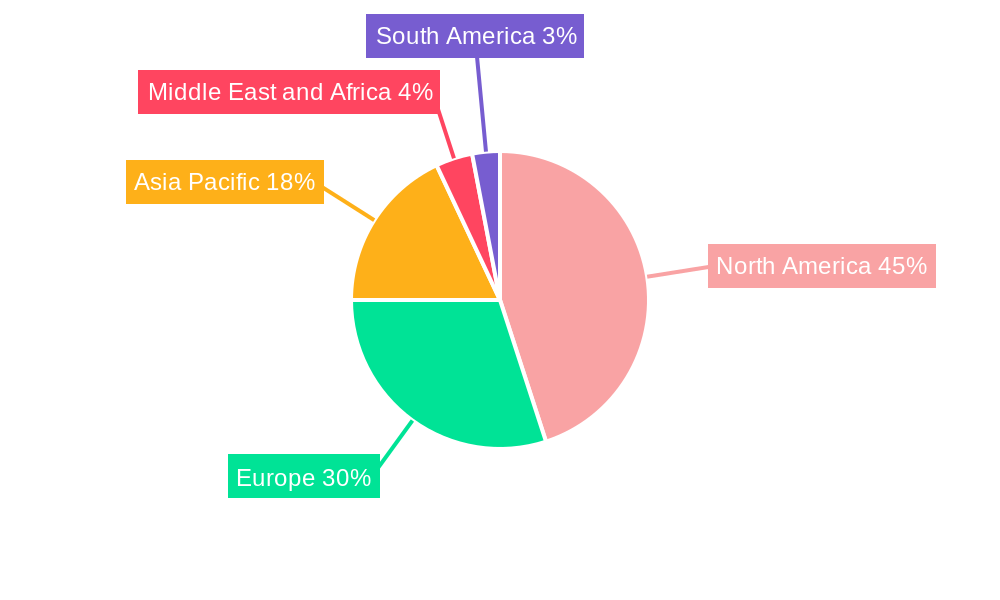
Geographical distribution shows a strong presence in North America and Europe, with regions like the United States and Germany leading the way due to established healthcare infrastructure and robust regulatory frameworks. However, Asia Pacific is emerging as a rapidly growing market, driven by increasing healthcare expenditure and a burgeoning population with a high incidence of target diseases. While challenges exist, such as high production costs, stringent regulatory compliance requirements and the complexity of manufacturing processes, ongoing innovation and collaborative efforts across industry and research institutions are addressing these limitations and promising to further fuel market growth in the forecast period (2025-2033). The increasing adoption of automated manufacturing systems is also streamlining production, thus lowering costs and enhancing efficiency.
This comprehensive report provides a detailed analysis of the Cell Therapy Manufacturing Market, offering valuable insights for industry stakeholders, investors, and researchers. Covering the period from 2019 to 2033, with a focus on the base year 2025 and a forecast period of 2025-2033, this report examines market size, growth drivers, challenges, and emerging opportunities. The analysis includes detailed segmentation by type (autologous, allogeneic), therapy (mesenchymal stem cell therapy, fibroblast cell therapy, hematopoietic stem cell therapy, other therapies), and application (musculoskeletal, malignancies, cardiovascular, dermatology and wounds, other applications). Key players such as Fibrocell Technologies Inc, Gilead Sciences Inc (Kite Pharma Inc), and others are profiled, highlighting their market strategies and contributions to innovation. The report's projections are based on rigorous data analysis and expert opinions, providing actionable intelligence to navigate the dynamic landscape of the cell therapy manufacturing sector. The market is expected to reach xx Million by 2033, with a CAGR of xx% during the forecast period.
Cell Therapy Manufacturing Market Concentration & Innovation
The Cell Therapy Manufacturing market exhibits a moderately concentrated landscape, with a few major players holding significant market share. However, the emergence of numerous smaller companies focused on niche therapies and innovative manufacturing techniques is increasing competition. The market is characterized by a high level of innovation driven by advancements in cell processing technologies, bioreactor design, and quality control methodologies. Stringent regulatory frameworks, particularly from agencies like the FDA, play a significant role in shaping market dynamics. Product substitutes, such as traditional pharmaceuticals and other regenerative medicine approaches, pose a competitive threat. End-user trends, particularly the growing demand for personalized therapies and improved patient outcomes, are strong market drivers. Significant M&A activity is reshaping the market landscape, with larger companies acquiring smaller firms to expand their product portfolios and technological capabilities. Deal values have varied greatly, ranging from tens of millions to billions of dollars, depending on the target company's size and technology. Several key metrics highlight the market's dynamics:
- Market Share: Top 5 players account for approximately xx% of the market.
- M&A Activity: xx major deals have been recorded in the past 5 years, with an average deal value of xx Million.
- Innovation Focus: Major investments are observed in areas like automated cell processing, closed-system manufacturing, and advanced analytics for quality control.
Cell Therapy Manufacturing Market Industry Trends & Insights
The Cell Therapy Manufacturing market is experiencing significant growth, driven by several key factors. The increasing prevalence of chronic diseases like cancer, cardiovascular conditions, and musculoskeletal disorders is fueling demand for effective therapies. Advancements in cell biology, genetic engineering, and bioprocessing technologies are enabling the development of more efficient and safer cell therapies. This is complemented by increasing investment in R&D and the growing adoption of advanced manufacturing techniques. Consumer preferences are shifting towards personalized and targeted therapies, which are key attributes of many cell therapies. The competitive landscape is characterized by intense competition among established players and emerging biotech companies. This rivalry is driving innovation and contributing to the market's growth. The market is characterized by a substantial number of clinical trials, indicating a robust pipeline of new cell therapies that are expected to enter the market soon. The CAGR is projected at xx% during the forecast period, reflecting a healthy growth trajectory. Market penetration remains relatively low in comparison to potential but is expected to improve significantly within the forecast period, driven by factors including regulatory approvals, reimbursement policies and increasing acceptance among healthcare providers and patients.
Dominant Markets & Segments in Cell Therapy Manufacturing Market
The Cell Therapy Manufacturing market is geographically diverse, with North America and Europe currently representing the largest markets. However, Asia Pacific is expected to exhibit robust growth in the coming years, driven by increasing healthcare expenditure, rising prevalence of target diseases, and supportive government policies. Within the market segmentation:
- Type: The allogeneic segment is projected to hold a larger market share compared to autologous, due to its potential for scalability and cost-effectiveness.
- Therapy: Mesenchymal stem cell therapy currently dominates the market, followed by hematopoietic stem cell therapy. Fibroblast cell therapy also holds a significant share.
- Application: Malignancies, musculoskeletal disorders, and cardiovascular diseases represent the largest application segments.
Key Drivers:
- North America: Strong R&D infrastructure, high healthcare expenditure, and early adoption of new technologies.
- Europe: Government support for regenerative medicine, well-established regulatory frameworks.
- Asia Pacific: Rapidly growing healthcare sector, rising disposable incomes, and increasing prevalence of chronic diseases.
Cell Therapy Manufacturing Market Product Developments
Recent product developments focus on improving cell manufacturing efficiency, scalability, and safety. Innovations include the development of closed-system manufacturing processes to reduce contamination risks, the implementation of automation to improve throughput and reduce labor costs, and the use of advanced analytics to monitor and control the cell manufacturing process. These advancements enhance the cost-effectiveness and overall quality of cell therapies, creating a better market fit and increased patient access. The integration of advanced bioreactors and innovative cell processing technologies are also key to advancing the field.
Report Scope & Segmentation Analysis
This report comprehensively segments the Cell Therapy Manufacturing market by:
Type: Autologous (growth projection xx%, market size xx Million in 2025) and Allogeneic (growth projection xx%, market size xx Million in 2025). The allogeneic segment is expected to exhibit faster growth due to its scalable nature.
Therapy: Mesenchymal Stem Cell Therapy (growth projection xx%, market size xx Million in 2025), Fibroblast Cell Therapy (growth projection xx%, market size xx Million in 2025), Hematopoietic Stem Cell Therapy (growth projection xx%, market size xx Million in 2025), and Other Therapies (growth projection xx%, market size xx Million in 2025).
Application: Musculoskeletal (growth projection xx%, market size xx Million in 2025), Malignancies (growth projection xx%, market size xx Million in 2025), Cardiovascular (growth projection xx%, market size xx Million in 2025), Dermatology and Wounds (growth projection xx%, market size xx Million in 2025), and Other Applications (growth projection xx%, market size xx Million in 2025). Each segment's growth is influenced by factors such as disease prevalence, technological advancements, and regulatory approvals.
Key Drivers of Cell Therapy Manufacturing Market Growth
Technological advancements in cell processing, bioreactor design, and quality control are major drivers. Economic factors, such as increasing healthcare expenditure and investments in R&D, further stimulate market growth. Supportive regulatory frameworks that streamline the approval process for cell therapies also contribute to market expansion. The increasing prevalence of chronic diseases demanding novel treatment options is a powerful catalyst for market growth.
Challenges in the Cell Therapy Manufacturing Market Sector
High manufacturing costs associated with cell therapies present a significant barrier to market penetration. Complex and stringent regulatory requirements increase the time and cost of bringing new therapies to market. Supply chain issues, particularly the availability of high-quality raw materials and specialized equipment, may also hamper growth. Intense competition among numerous players could further impact individual company profitability.
Emerging Opportunities in Cell Therapy Manufacturing Market
The development of new cell types and therapies for previously untreatable diseases presents significant opportunities. The growing adoption of advanced manufacturing techniques, such as automation and closed-system processing, offers avenues for increased efficiency and cost reduction. The expansion into emerging markets in Asia and Latin America presents further growth potential. New research into using cell therapies for chronic diseases offers considerable opportunity.
Leading Players in the Cell Therapy Manufacturing Market Market
- Fibrocell Technologies Inc
- Gilead Sciences Inc (Kite Pharma Inc)
- Allogene Therapeutics Inc
- Stempeutics Research Pvt Ltd
- Pharmicell Co Ltd
- Novartis AG
- Anterogen Co Ltd
- Chiesi Farmaceutici SpA
- Nipro Corporation
- TiGenix (Takeda Pharmaceuticals)
- Organogenesis Inc
- Vericel Corporation
- Tego Science
- MEDIPOST Co Ltd
- Corestem Inc
Key Developments in Cell Therapy Manufacturing Market Industry
- January 2022: Immunocore received FDA approval for KIMMTRAK (tebentafusp-tebn) for uveal melanoma. This approval expands treatment options and boosts market confidence.
- March 2021: Novadip Biosciences received IND approval for NVD-003, a regenerative bone product for rare pediatric bone diseases. This signifies progress in addressing unmet medical needs and expanding the application of cell therapies.
Strategic Outlook for Cell Therapy Manufacturing Market Market
The Cell Therapy Manufacturing market is poised for significant growth, driven by ongoing technological advancements, increasing investment in R&D, and the growing prevalence of chronic diseases. The focus on personalized medicine and the development of novel cell therapies will continue to shape the market's trajectory. The successful navigation of regulatory hurdles and addressing manufacturing challenges will be crucial for realizing the full market potential. Expanding into emerging markets and developing cost-effective manufacturing processes will be key strategic priorities for companies in the industry.
Cell Therapy Manufacturing Market Segmentation
-
1. Type
- 1.1. Autologous
- 1.2. Allogeneic
-
2. Therapy
- 2.1. Mesenchymal Stem Cell Therapy
- 2.2. Fibroblast Cell Therapy
- 2.3. Hematopoietic Stem Cell Therapy
- 2.4. Other Therapies
-
3. Application
- 3.1. Musculoskeletal
- 3.2. Malignancies
- 3.3. Cardiovascular
- 3.4. Dermatology and Wounds
- 3.5. Other Applications
Cell Therapy Manufacturing Market Segmentation By Geography
-
1. North America
- 1.1. United States
- 1.2. Canada
- 1.3. Mexico
-
2. Europe
- 2.1. Germany
- 2.2. United Kingdom
- 2.3. France
- 2.4. Italy
- 2.5. Spain
- 2.6. Rest of Europe
-
3. Asia Pacific
- 3.1. China
- 3.2. Japan
- 3.3. India
- 3.4. Australia
- 3.5. South Korea
- 3.6. Rest of Asia Pacific
-
4. Middle East and Africa
- 4.1. GCC
- 4.2. South Africa
- 4.3. Rest of Middle East and Africa
-
5. South America
- 5.1. Brazil
- 5.2. Argentina
- 5.3. Rest of South America
Cell Therapy Manufacturing Market REPORT HIGHLIGHTS
| Aspects | Details |
|---|---|
| Study Period | 2019-2033 |
| Base Year | 2024 |
| Estimated Year | 2025 |
| Forecast Period | 2025-2033 |
| Historical Period | 2019-2024 |
| Growth Rate | CAGR of 17.05% from 2019-2033 |
| Segmentation |
|
Table of Contents
- 1. Introduction
- 1.1. Research Scope
- 1.2. Market Segmentation
- 1.3. Research Methodology
- 1.4. Definitions and Assumptions
- 2. Executive Summary
- 2.1. Introduction
- 3. Market Dynamics
- 3.1. Introduction
- 3.2. Market Drivers
- 3.2.1. Increasing Prevalence of Chronic Conditions; Rising Adoption of Regenerative Medicine; Rise in Number of Clinical Studies Pertaining to the Development of Cellular Therapies
- 3.3. Market Restrains
- 3.3.1. High Cost of Therapies
- 3.4. Market Trends
- 3.4.1. The Allogeneic Therapies Segment is Expected to Account for a Significant Share in the Cell Therapy Market
- 4. Market Factor Analysis
- 4.1. Porters Five Forces
- 4.2. Supply/Value Chain
- 4.3. PESTEL analysis
- 4.4. Market Entropy
- 4.5. Patent/Trademark Analysis
- 5. Global Cell Therapy Manufacturing Market Analysis, Insights and Forecast, 2019-2031
- 5.1. Market Analysis, Insights and Forecast - by Type
- 5.1.1. Autologous
- 5.1.2. Allogeneic
- 5.2. Market Analysis, Insights and Forecast - by Therapy
- 5.2.1. Mesenchymal Stem Cell Therapy
- 5.2.2. Fibroblast Cell Therapy
- 5.2.3. Hematopoietic Stem Cell Therapy
- 5.2.4. Other Therapies
- 5.3. Market Analysis, Insights and Forecast - by Application
- 5.3.1. Musculoskeletal
- 5.3.2. Malignancies
- 5.3.3. Cardiovascular
- 5.3.4. Dermatology and Wounds
- 5.3.5. Other Applications
- 5.4. Market Analysis, Insights and Forecast - by Region
- 5.4.1. North America
- 5.4.2. Europe
- 5.4.3. Asia Pacific
- 5.4.4. Middle East and Africa
- 5.4.5. South America
- 5.1. Market Analysis, Insights and Forecast - by Type
- 6. North America Cell Therapy Manufacturing Market Analysis, Insights and Forecast, 2019-2031
- 6.1. Market Analysis, Insights and Forecast - by Type
- 6.1.1. Autologous
- 6.1.2. Allogeneic
- 6.2. Market Analysis, Insights and Forecast - by Therapy
- 6.2.1. Mesenchymal Stem Cell Therapy
- 6.2.2. Fibroblast Cell Therapy
- 6.2.3. Hematopoietic Stem Cell Therapy
- 6.2.4. Other Therapies
- 6.3. Market Analysis, Insights and Forecast - by Application
- 6.3.1. Musculoskeletal
- 6.3.2. Malignancies
- 6.3.3. Cardiovascular
- 6.3.4. Dermatology and Wounds
- 6.3.5. Other Applications
- 6.1. Market Analysis, Insights and Forecast - by Type
- 7. Europe Cell Therapy Manufacturing Market Analysis, Insights and Forecast, 2019-2031
- 7.1. Market Analysis, Insights and Forecast - by Type
- 7.1.1. Autologous
- 7.1.2. Allogeneic
- 7.2. Market Analysis, Insights and Forecast - by Therapy
- 7.2.1. Mesenchymal Stem Cell Therapy
- 7.2.2. Fibroblast Cell Therapy
- 7.2.3. Hematopoietic Stem Cell Therapy
- 7.2.4. Other Therapies
- 7.3. Market Analysis, Insights and Forecast - by Application
- 7.3.1. Musculoskeletal
- 7.3.2. Malignancies
- 7.3.3. Cardiovascular
- 7.3.4. Dermatology and Wounds
- 7.3.5. Other Applications
- 7.1. Market Analysis, Insights and Forecast - by Type
- 8. Asia Pacific Cell Therapy Manufacturing Market Analysis, Insights and Forecast, 2019-2031
- 8.1. Market Analysis, Insights and Forecast - by Type
- 8.1.1. Autologous
- 8.1.2. Allogeneic
- 8.2. Market Analysis, Insights and Forecast - by Therapy
- 8.2.1. Mesenchymal Stem Cell Therapy
- 8.2.2. Fibroblast Cell Therapy
- 8.2.3. Hematopoietic Stem Cell Therapy
- 8.2.4. Other Therapies
- 8.3. Market Analysis, Insights and Forecast - by Application
- 8.3.1. Musculoskeletal
- 8.3.2. Malignancies
- 8.3.3. Cardiovascular
- 8.3.4. Dermatology and Wounds
- 8.3.5. Other Applications
- 8.1. Market Analysis, Insights and Forecast - by Type
- 9. Middle East and Africa Cell Therapy Manufacturing Market Analysis, Insights and Forecast, 2019-2031
- 9.1. Market Analysis, Insights and Forecast - by Type
- 9.1.1. Autologous
- 9.1.2. Allogeneic
- 9.2. Market Analysis, Insights and Forecast - by Therapy
- 9.2.1. Mesenchymal Stem Cell Therapy
- 9.2.2. Fibroblast Cell Therapy
- 9.2.3. Hematopoietic Stem Cell Therapy
- 9.2.4. Other Therapies
- 9.3. Market Analysis, Insights and Forecast - by Application
- 9.3.1. Musculoskeletal
- 9.3.2. Malignancies
- 9.3.3. Cardiovascular
- 9.3.4. Dermatology and Wounds
- 9.3.5. Other Applications
- 9.1. Market Analysis, Insights and Forecast - by Type
- 10. South America Cell Therapy Manufacturing Market Analysis, Insights and Forecast, 2019-2031
- 10.1. Market Analysis, Insights and Forecast - by Type
- 10.1.1. Autologous
- 10.1.2. Allogeneic
- 10.2. Market Analysis, Insights and Forecast - by Therapy
- 10.2.1. Mesenchymal Stem Cell Therapy
- 10.2.2. Fibroblast Cell Therapy
- 10.2.3. Hematopoietic Stem Cell Therapy
- 10.2.4. Other Therapies
- 10.3. Market Analysis, Insights and Forecast - by Application
- 10.3.1. Musculoskeletal
- 10.3.2. Malignancies
- 10.3.3. Cardiovascular
- 10.3.4. Dermatology and Wounds
- 10.3.5. Other Applications
- 10.1. Market Analysis, Insights and Forecast - by Type
- 11. North America Cell Therapy Manufacturing Market Analysis, Insights and Forecast, 2019-2031
- 11.1. Market Analysis, Insights and Forecast - By Country/Sub-region
- 11.1.1 United States
- 11.1.2 Canada
- 11.1.3 Mexico
- 12. Europe Cell Therapy Manufacturing Market Analysis, Insights and Forecast, 2019-2031
- 12.1. Market Analysis, Insights and Forecast - By Country/Sub-region
- 12.1.1 Germany
- 12.1.2 United Kingdom
- 12.1.3 France
- 12.1.4 Italy
- 12.1.5 Spain
- 12.1.6 Rest of Europe
- 13. Asia Pacific Cell Therapy Manufacturing Market Analysis, Insights and Forecast, 2019-2031
- 13.1. Market Analysis, Insights and Forecast - By Country/Sub-region
- 13.1.1 China
- 13.1.2 Japan
- 13.1.3 India
- 13.1.4 Australia
- 13.1.5 South Korea
- 13.1.6 Rest of Asia Pacific
- 14. Middle East and Africa Cell Therapy Manufacturing Market Analysis, Insights and Forecast, 2019-2031
- 14.1. Market Analysis, Insights and Forecast - By Country/Sub-region
- 14.1.1 GCC
- 14.1.2 South Africa
- 14.1.3 Rest of Middle East and Africa
- 15. South America Cell Therapy Manufacturing Market Analysis, Insights and Forecast, 2019-2031
- 15.1. Market Analysis, Insights and Forecast - By Country/Sub-region
- 15.1.1 Brazil
- 15.1.2 Argentina
- 15.1.3 Rest of South America
- 16. Competitive Analysis
- 16.1. Global Market Share Analysis 2024
- 16.2. Company Profiles
- 16.2.1 Fibrocell Technologies Inc
- 16.2.1.1. Overview
- 16.2.1.2. Products
- 16.2.1.3. SWOT Analysis
- 16.2.1.4. Recent Developments
- 16.2.1.5. Financials (Based on Availability)
- 16.2.2 Gilead Sciences Inc (Kite Pharma Inc )
- 16.2.2.1. Overview
- 16.2.2.2. Products
- 16.2.2.3. SWOT Analysis
- 16.2.2.4. Recent Developments
- 16.2.2.5. Financials (Based on Availability)
- 16.2.3 Allogene Therapeutics Inc
- 16.2.3.1. Overview
- 16.2.3.2. Products
- 16.2.3.3. SWOT Analysis
- 16.2.3.4. Recent Developments
- 16.2.3.5. Financials (Based on Availability)
- 16.2.4 Stempeutics Research Pvt Ltd
- 16.2.4.1. Overview
- 16.2.4.2. Products
- 16.2.4.3. SWOT Analysis
- 16.2.4.4. Recent Developments
- 16.2.4.5. Financials (Based on Availability)
- 16.2.5 Pharmicell Co Ltd
- 16.2.5.1. Overview
- 16.2.5.2. Products
- 16.2.5.3. SWOT Analysis
- 16.2.5.4. Recent Developments
- 16.2.5.5. Financials (Based on Availability)
- 16.2.6 Novartis AG
- 16.2.6.1. Overview
- 16.2.6.2. Products
- 16.2.6.3. SWOT Analysis
- 16.2.6.4. Recent Developments
- 16.2.6.5. Financials (Based on Availability)
- 16.2.7 Anterogen Co Ltd
- 16.2.7.1. Overview
- 16.2.7.2. Products
- 16.2.7.3. SWOT Analysis
- 16.2.7.4. Recent Developments
- 16.2.7.5. Financials (Based on Availability)
- 16.2.8 Chiesi Farmaceutici SpA
- 16.2.8.1. Overview
- 16.2.8.2. Products
- 16.2.8.3. SWOT Analysis
- 16.2.8.4. Recent Developments
- 16.2.8.5. Financials (Based on Availability)
- 16.2.9 Nipro Corporation
- 16.2.9.1. Overview
- 16.2.9.2. Products
- 16.2.9.3. SWOT Analysis
- 16.2.9.4. Recent Developments
- 16.2.9.5. Financials (Based on Availability)
- 16.2.10 TiGenix (Takeda Pharmaceuticals)
- 16.2.10.1. Overview
- 16.2.10.2. Products
- 16.2.10.3. SWOT Analysis
- 16.2.10.4. Recent Developments
- 16.2.10.5. Financials (Based on Availability)
- 16.2.11 Organogenesis Inc
- 16.2.11.1. Overview
- 16.2.11.2. Products
- 16.2.11.3. SWOT Analysis
- 16.2.11.4. Recent Developments
- 16.2.11.5. Financials (Based on Availability)
- 16.2.12 Vericel Corporation
- 16.2.12.1. Overview
- 16.2.12.2. Products
- 16.2.12.3. SWOT Analysis
- 16.2.12.4. Recent Developments
- 16.2.12.5. Financials (Based on Availability)
- 16.2.13 Tego Science
- 16.2.13.1. Overview
- 16.2.13.2. Products
- 16.2.13.3. SWOT Analysis
- 16.2.13.4. Recent Developments
- 16.2.13.5. Financials (Based on Availability)
- 16.2.14 MEDIPOST Co Ltd
- 16.2.14.1. Overview
- 16.2.14.2. Products
- 16.2.14.3. SWOT Analysis
- 16.2.14.4. Recent Developments
- 16.2.14.5. Financials (Based on Availability)
- 16.2.15 Corestem Inc
- 16.2.15.1. Overview
- 16.2.15.2. Products
- 16.2.15.3. SWOT Analysis
- 16.2.15.4. Recent Developments
- 16.2.15.5. Financials (Based on Availability)
- 16.2.1 Fibrocell Technologies Inc
List of Figures
- Figure 1: Global Cell Therapy Manufacturing Market Revenue Breakdown (Million, %) by Region 2024 & 2032
- Figure 2: Global Cell Therapy Manufacturing Market Volume Breakdown (K Unit, %) by Region 2024 & 2032
- Figure 3: North America Cell Therapy Manufacturing Market Revenue (Million), by Country 2024 & 2032
- Figure 4: North America Cell Therapy Manufacturing Market Volume (K Unit), by Country 2024 & 2032
- Figure 5: North America Cell Therapy Manufacturing Market Revenue Share (%), by Country 2024 & 2032
- Figure 6: North America Cell Therapy Manufacturing Market Volume Share (%), by Country 2024 & 2032
- Figure 7: Europe Cell Therapy Manufacturing Market Revenue (Million), by Country 2024 & 2032
- Figure 8: Europe Cell Therapy Manufacturing Market Volume (K Unit), by Country 2024 & 2032
- Figure 9: Europe Cell Therapy Manufacturing Market Revenue Share (%), by Country 2024 & 2032
- Figure 10: Europe Cell Therapy Manufacturing Market Volume Share (%), by Country 2024 & 2032
- Figure 11: Asia Pacific Cell Therapy Manufacturing Market Revenue (Million), by Country 2024 & 2032
- Figure 12: Asia Pacific Cell Therapy Manufacturing Market Volume (K Unit), by Country 2024 & 2032
- Figure 13: Asia Pacific Cell Therapy Manufacturing Market Revenue Share (%), by Country 2024 & 2032
- Figure 14: Asia Pacific Cell Therapy Manufacturing Market Volume Share (%), by Country 2024 & 2032
- Figure 15: Middle East and Africa Cell Therapy Manufacturing Market Revenue (Million), by Country 2024 & 2032
- Figure 16: Middle East and Africa Cell Therapy Manufacturing Market Volume (K Unit), by Country 2024 & 2032
- Figure 17: Middle East and Africa Cell Therapy Manufacturing Market Revenue Share (%), by Country 2024 & 2032
- Figure 18: Middle East and Africa Cell Therapy Manufacturing Market Volume Share (%), by Country 2024 & 2032
- Figure 19: South America Cell Therapy Manufacturing Market Revenue (Million), by Country 2024 & 2032
- Figure 20: South America Cell Therapy Manufacturing Market Volume (K Unit), by Country 2024 & 2032
- Figure 21: South America Cell Therapy Manufacturing Market Revenue Share (%), by Country 2024 & 2032
- Figure 22: South America Cell Therapy Manufacturing Market Volume Share (%), by Country 2024 & 2032
- Figure 23: North America Cell Therapy Manufacturing Market Revenue (Million), by Type 2024 & 2032
- Figure 24: North America Cell Therapy Manufacturing Market Volume (K Unit), by Type 2024 & 2032
- Figure 25: North America Cell Therapy Manufacturing Market Revenue Share (%), by Type 2024 & 2032
- Figure 26: North America Cell Therapy Manufacturing Market Volume Share (%), by Type 2024 & 2032
- Figure 27: North America Cell Therapy Manufacturing Market Revenue (Million), by Therapy 2024 & 2032
- Figure 28: North America Cell Therapy Manufacturing Market Volume (K Unit), by Therapy 2024 & 2032
- Figure 29: North America Cell Therapy Manufacturing Market Revenue Share (%), by Therapy 2024 & 2032
- Figure 30: North America Cell Therapy Manufacturing Market Volume Share (%), by Therapy 2024 & 2032
- Figure 31: North America Cell Therapy Manufacturing Market Revenue (Million), by Application 2024 & 2032
- Figure 32: North America Cell Therapy Manufacturing Market Volume (K Unit), by Application 2024 & 2032
- Figure 33: North America Cell Therapy Manufacturing Market Revenue Share (%), by Application 2024 & 2032
- Figure 34: North America Cell Therapy Manufacturing Market Volume Share (%), by Application 2024 & 2032
- Figure 35: North America Cell Therapy Manufacturing Market Revenue (Million), by Country 2024 & 2032
- Figure 36: North America Cell Therapy Manufacturing Market Volume (K Unit), by Country 2024 & 2032
- Figure 37: North America Cell Therapy Manufacturing Market Revenue Share (%), by Country 2024 & 2032
- Figure 38: North America Cell Therapy Manufacturing Market Volume Share (%), by Country 2024 & 2032
- Figure 39: Europe Cell Therapy Manufacturing Market Revenue (Million), by Type 2024 & 2032
- Figure 40: Europe Cell Therapy Manufacturing Market Volume (K Unit), by Type 2024 & 2032
- Figure 41: Europe Cell Therapy Manufacturing Market Revenue Share (%), by Type 2024 & 2032
- Figure 42: Europe Cell Therapy Manufacturing Market Volume Share (%), by Type 2024 & 2032
- Figure 43: Europe Cell Therapy Manufacturing Market Revenue (Million), by Therapy 2024 & 2032
- Figure 44: Europe Cell Therapy Manufacturing Market Volume (K Unit), by Therapy 2024 & 2032
- Figure 45: Europe Cell Therapy Manufacturing Market Revenue Share (%), by Therapy 2024 & 2032
- Figure 46: Europe Cell Therapy Manufacturing Market Volume Share (%), by Therapy 2024 & 2032
- Figure 47: Europe Cell Therapy Manufacturing Market Revenue (Million), by Application 2024 & 2032
- Figure 48: Europe Cell Therapy Manufacturing Market Volume (K Unit), by Application 2024 & 2032
- Figure 49: Europe Cell Therapy Manufacturing Market Revenue Share (%), by Application 2024 & 2032
- Figure 50: Europe Cell Therapy Manufacturing Market Volume Share (%), by Application 2024 & 2032
- Figure 51: Europe Cell Therapy Manufacturing Market Revenue (Million), by Country 2024 & 2032
- Figure 52: Europe Cell Therapy Manufacturing Market Volume (K Unit), by Country 2024 & 2032
- Figure 53: Europe Cell Therapy Manufacturing Market Revenue Share (%), by Country 2024 & 2032
- Figure 54: Europe Cell Therapy Manufacturing Market Volume Share (%), by Country 2024 & 2032
- Figure 55: Asia Pacific Cell Therapy Manufacturing Market Revenue (Million), by Type 2024 & 2032
- Figure 56: Asia Pacific Cell Therapy Manufacturing Market Volume (K Unit), by Type 2024 & 2032
- Figure 57: Asia Pacific Cell Therapy Manufacturing Market Revenue Share (%), by Type 2024 & 2032
- Figure 58: Asia Pacific Cell Therapy Manufacturing Market Volume Share (%), by Type 2024 & 2032
- Figure 59: Asia Pacific Cell Therapy Manufacturing Market Revenue (Million), by Therapy 2024 & 2032
- Figure 60: Asia Pacific Cell Therapy Manufacturing Market Volume (K Unit), by Therapy 2024 & 2032
- Figure 61: Asia Pacific Cell Therapy Manufacturing Market Revenue Share (%), by Therapy 2024 & 2032
- Figure 62: Asia Pacific Cell Therapy Manufacturing Market Volume Share (%), by Therapy 2024 & 2032
- Figure 63: Asia Pacific Cell Therapy Manufacturing Market Revenue (Million), by Application 2024 & 2032
- Figure 64: Asia Pacific Cell Therapy Manufacturing Market Volume (K Unit), by Application 2024 & 2032
- Figure 65: Asia Pacific Cell Therapy Manufacturing Market Revenue Share (%), by Application 2024 & 2032
- Figure 66: Asia Pacific Cell Therapy Manufacturing Market Volume Share (%), by Application 2024 & 2032
- Figure 67: Asia Pacific Cell Therapy Manufacturing Market Revenue (Million), by Country 2024 & 2032
- Figure 68: Asia Pacific Cell Therapy Manufacturing Market Volume (K Unit), by Country 2024 & 2032
- Figure 69: Asia Pacific Cell Therapy Manufacturing Market Revenue Share (%), by Country 2024 & 2032
- Figure 70: Asia Pacific Cell Therapy Manufacturing Market Volume Share (%), by Country 2024 & 2032
- Figure 71: Middle East and Africa Cell Therapy Manufacturing Market Revenue (Million), by Type 2024 & 2032
- Figure 72: Middle East and Africa Cell Therapy Manufacturing Market Volume (K Unit), by Type 2024 & 2032
- Figure 73: Middle East and Africa Cell Therapy Manufacturing Market Revenue Share (%), by Type 2024 & 2032
- Figure 74: Middle East and Africa Cell Therapy Manufacturing Market Volume Share (%), by Type 2024 & 2032
- Figure 75: Middle East and Africa Cell Therapy Manufacturing Market Revenue (Million), by Therapy 2024 & 2032
- Figure 76: Middle East and Africa Cell Therapy Manufacturing Market Volume (K Unit), by Therapy 2024 & 2032
- Figure 77: Middle East and Africa Cell Therapy Manufacturing Market Revenue Share (%), by Therapy 2024 & 2032
- Figure 78: Middle East and Africa Cell Therapy Manufacturing Market Volume Share (%), by Therapy 2024 & 2032
- Figure 79: Middle East and Africa Cell Therapy Manufacturing Market Revenue (Million), by Application 2024 & 2032
- Figure 80: Middle East and Africa Cell Therapy Manufacturing Market Volume (K Unit), by Application 2024 & 2032
- Figure 81: Middle East and Africa Cell Therapy Manufacturing Market Revenue Share (%), by Application 2024 & 2032
- Figure 82: Middle East and Africa Cell Therapy Manufacturing Market Volume Share (%), by Application 2024 & 2032
- Figure 83: Middle East and Africa Cell Therapy Manufacturing Market Revenue (Million), by Country 2024 & 2032
- Figure 84: Middle East and Africa Cell Therapy Manufacturing Market Volume (K Unit), by Country 2024 & 2032
- Figure 85: Middle East and Africa Cell Therapy Manufacturing Market Revenue Share (%), by Country 2024 & 2032
- Figure 86: Middle East and Africa Cell Therapy Manufacturing Market Volume Share (%), by Country 2024 & 2032
- Figure 87: South America Cell Therapy Manufacturing Market Revenue (Million), by Type 2024 & 2032
- Figure 88: South America Cell Therapy Manufacturing Market Volume (K Unit), by Type 2024 & 2032
- Figure 89: South America Cell Therapy Manufacturing Market Revenue Share (%), by Type 2024 & 2032
- Figure 90: South America Cell Therapy Manufacturing Market Volume Share (%), by Type 2024 & 2032
- Figure 91: South America Cell Therapy Manufacturing Market Revenue (Million), by Therapy 2024 & 2032
- Figure 92: South America Cell Therapy Manufacturing Market Volume (K Unit), by Therapy 2024 & 2032
- Figure 93: South America Cell Therapy Manufacturing Market Revenue Share (%), by Therapy 2024 & 2032
- Figure 94: South America Cell Therapy Manufacturing Market Volume Share (%), by Therapy 2024 & 2032
- Figure 95: South America Cell Therapy Manufacturing Market Revenue (Million), by Application 2024 & 2032
- Figure 96: South America Cell Therapy Manufacturing Market Volume (K Unit), by Application 2024 & 2032
- Figure 97: South America Cell Therapy Manufacturing Market Revenue Share (%), by Application 2024 & 2032
- Figure 98: South America Cell Therapy Manufacturing Market Volume Share (%), by Application 2024 & 2032
- Figure 99: South America Cell Therapy Manufacturing Market Revenue (Million), by Country 2024 & 2032
- Figure 100: South America Cell Therapy Manufacturing Market Volume (K Unit), by Country 2024 & 2032
- Figure 101: South America Cell Therapy Manufacturing Market Revenue Share (%), by Country 2024 & 2032
- Figure 102: South America Cell Therapy Manufacturing Market Volume Share (%), by Country 2024 & 2032
List of Tables
- Table 1: Global Cell Therapy Manufacturing Market Revenue Million Forecast, by Region 2019 & 2032
- Table 2: Global Cell Therapy Manufacturing Market Volume K Unit Forecast, by Region 2019 & 2032
- Table 3: Global Cell Therapy Manufacturing Market Revenue Million Forecast, by Type 2019 & 2032
- Table 4: Global Cell Therapy Manufacturing Market Volume K Unit Forecast, by Type 2019 & 2032
- Table 5: Global Cell Therapy Manufacturing Market Revenue Million Forecast, by Therapy 2019 & 2032
- Table 6: Global Cell Therapy Manufacturing Market Volume K Unit Forecast, by Therapy 2019 & 2032
- Table 7: Global Cell Therapy Manufacturing Market Revenue Million Forecast, by Application 2019 & 2032
- Table 8: Global Cell Therapy Manufacturing Market Volume K Unit Forecast, by Application 2019 & 2032
- Table 9: Global Cell Therapy Manufacturing Market Revenue Million Forecast, by Region 2019 & 2032
- Table 10: Global Cell Therapy Manufacturing Market Volume K Unit Forecast, by Region 2019 & 2032
- Table 11: Global Cell Therapy Manufacturing Market Revenue Million Forecast, by Country 2019 & 2032
- Table 12: Global Cell Therapy Manufacturing Market Volume K Unit Forecast, by Country 2019 & 2032
- Table 13: United States Cell Therapy Manufacturing Market Revenue (Million) Forecast, by Application 2019 & 2032
- Table 14: United States Cell Therapy Manufacturing Market Volume (K Unit) Forecast, by Application 2019 & 2032
- Table 15: Canada Cell Therapy Manufacturing Market Revenue (Million) Forecast, by Application 2019 & 2032
- Table 16: Canada Cell Therapy Manufacturing Market Volume (K Unit) Forecast, by Application 2019 & 2032
- Table 17: Mexico Cell Therapy Manufacturing Market Revenue (Million) Forecast, by Application 2019 & 2032
- Table 18: Mexico Cell Therapy Manufacturing Market Volume (K Unit) Forecast, by Application 2019 & 2032
- Table 19: Global Cell Therapy Manufacturing Market Revenue Million Forecast, by Country 2019 & 2032
- Table 20: Global Cell Therapy Manufacturing Market Volume K Unit Forecast, by Country 2019 & 2032
- Table 21: Germany Cell Therapy Manufacturing Market Revenue (Million) Forecast, by Application 2019 & 2032
- Table 22: Germany Cell Therapy Manufacturing Market Volume (K Unit) Forecast, by Application 2019 & 2032
- Table 23: United Kingdom Cell Therapy Manufacturing Market Revenue (Million) Forecast, by Application 2019 & 2032
- Table 24: United Kingdom Cell Therapy Manufacturing Market Volume (K Unit) Forecast, by Application 2019 & 2032
- Table 25: France Cell Therapy Manufacturing Market Revenue (Million) Forecast, by Application 2019 & 2032
- Table 26: France Cell Therapy Manufacturing Market Volume (K Unit) Forecast, by Application 2019 & 2032
- Table 27: Italy Cell Therapy Manufacturing Market Revenue (Million) Forecast, by Application 2019 & 2032
- Table 28: Italy Cell Therapy Manufacturing Market Volume (K Unit) Forecast, by Application 2019 & 2032
- Table 29: Spain Cell Therapy Manufacturing Market Revenue (Million) Forecast, by Application 2019 & 2032
- Table 30: Spain Cell Therapy Manufacturing Market Volume (K Unit) Forecast, by Application 2019 & 2032
- Table 31: Rest of Europe Cell Therapy Manufacturing Market Revenue (Million) Forecast, by Application 2019 & 2032
- Table 32: Rest of Europe Cell Therapy Manufacturing Market Volume (K Unit) Forecast, by Application 2019 & 2032
- Table 33: Global Cell Therapy Manufacturing Market Revenue Million Forecast, by Country 2019 & 2032
- Table 34: Global Cell Therapy Manufacturing Market Volume K Unit Forecast, by Country 2019 & 2032
- Table 35: China Cell Therapy Manufacturing Market Revenue (Million) Forecast, by Application 2019 & 2032
- Table 36: China Cell Therapy Manufacturing Market Volume (K Unit) Forecast, by Application 2019 & 2032
- Table 37: Japan Cell Therapy Manufacturing Market Revenue (Million) Forecast, by Application 2019 & 2032
- Table 38: Japan Cell Therapy Manufacturing Market Volume (K Unit) Forecast, by Application 2019 & 2032
- Table 39: India Cell Therapy Manufacturing Market Revenue (Million) Forecast, by Application 2019 & 2032
- Table 40: India Cell Therapy Manufacturing Market Volume (K Unit) Forecast, by Application 2019 & 2032
- Table 41: Australia Cell Therapy Manufacturing Market Revenue (Million) Forecast, by Application 2019 & 2032
- Table 42: Australia Cell Therapy Manufacturing Market Volume (K Unit) Forecast, by Application 2019 & 2032
- Table 43: South Korea Cell Therapy Manufacturing Market Revenue (Million) Forecast, by Application 2019 & 2032
- Table 44: South Korea Cell Therapy Manufacturing Market Volume (K Unit) Forecast, by Application 2019 & 2032
- Table 45: Rest of Asia Pacific Cell Therapy Manufacturing Market Revenue (Million) Forecast, by Application 2019 & 2032
- Table 46: Rest of Asia Pacific Cell Therapy Manufacturing Market Volume (K Unit) Forecast, by Application 2019 & 2032
- Table 47: Global Cell Therapy Manufacturing Market Revenue Million Forecast, by Country 2019 & 2032
- Table 48: Global Cell Therapy Manufacturing Market Volume K Unit Forecast, by Country 2019 & 2032
- Table 49: GCC Cell Therapy Manufacturing Market Revenue (Million) Forecast, by Application 2019 & 2032
- Table 50: GCC Cell Therapy Manufacturing Market Volume (K Unit) Forecast, by Application 2019 & 2032
- Table 51: South Africa Cell Therapy Manufacturing Market Revenue (Million) Forecast, by Application 2019 & 2032
- Table 52: South Africa Cell Therapy Manufacturing Market Volume (K Unit) Forecast, by Application 2019 & 2032
- Table 53: Rest of Middle East and Africa Cell Therapy Manufacturing Market Revenue (Million) Forecast, by Application 2019 & 2032
- Table 54: Rest of Middle East and Africa Cell Therapy Manufacturing Market Volume (K Unit) Forecast, by Application 2019 & 2032
- Table 55: Global Cell Therapy Manufacturing Market Revenue Million Forecast, by Country 2019 & 2032
- Table 56: Global Cell Therapy Manufacturing Market Volume K Unit Forecast, by Country 2019 & 2032
- Table 57: Brazil Cell Therapy Manufacturing Market Revenue (Million) Forecast, by Application 2019 & 2032
- Table 58: Brazil Cell Therapy Manufacturing Market Volume (K Unit) Forecast, by Application 2019 & 2032
- Table 59: Argentina Cell Therapy Manufacturing Market Revenue (Million) Forecast, by Application 2019 & 2032
- Table 60: Argentina Cell Therapy Manufacturing Market Volume (K Unit) Forecast, by Application 2019 & 2032
- Table 61: Rest of South America Cell Therapy Manufacturing Market Revenue (Million) Forecast, by Application 2019 & 2032
- Table 62: Rest of South America Cell Therapy Manufacturing Market Volume (K Unit) Forecast, by Application 2019 & 2032
- Table 63: Global Cell Therapy Manufacturing Market Revenue Million Forecast, by Type 2019 & 2032
- Table 64: Global Cell Therapy Manufacturing Market Volume K Unit Forecast, by Type 2019 & 2032
- Table 65: Global Cell Therapy Manufacturing Market Revenue Million Forecast, by Therapy 2019 & 2032
- Table 66: Global Cell Therapy Manufacturing Market Volume K Unit Forecast, by Therapy 2019 & 2032
- Table 67: Global Cell Therapy Manufacturing Market Revenue Million Forecast, by Application 2019 & 2032
- Table 68: Global Cell Therapy Manufacturing Market Volume K Unit Forecast, by Application 2019 & 2032
- Table 69: Global Cell Therapy Manufacturing Market Revenue Million Forecast, by Country 2019 & 2032
- Table 70: Global Cell Therapy Manufacturing Market Volume K Unit Forecast, by Country 2019 & 2032
- Table 71: United States Cell Therapy Manufacturing Market Revenue (Million) Forecast, by Application 2019 & 2032
- Table 72: United States Cell Therapy Manufacturing Market Volume (K Unit) Forecast, by Application 2019 & 2032
- Table 73: Canada Cell Therapy Manufacturing Market Revenue (Million) Forecast, by Application 2019 & 2032
- Table 74: Canada Cell Therapy Manufacturing Market Volume (K Unit) Forecast, by Application 2019 & 2032
- Table 75: Mexico Cell Therapy Manufacturing Market Revenue (Million) Forecast, by Application 2019 & 2032
- Table 76: Mexico Cell Therapy Manufacturing Market Volume (K Unit) Forecast, by Application 2019 & 2032
- Table 77: Global Cell Therapy Manufacturing Market Revenue Million Forecast, by Type 2019 & 2032
- Table 78: Global Cell Therapy Manufacturing Market Volume K Unit Forecast, by Type 2019 & 2032
- Table 79: Global Cell Therapy Manufacturing Market Revenue Million Forecast, by Therapy 2019 & 2032
- Table 80: Global Cell Therapy Manufacturing Market Volume K Unit Forecast, by Therapy 2019 & 2032
- Table 81: Global Cell Therapy Manufacturing Market Revenue Million Forecast, by Application 2019 & 2032
- Table 82: Global Cell Therapy Manufacturing Market Volume K Unit Forecast, by Application 2019 & 2032
- Table 83: Global Cell Therapy Manufacturing Market Revenue Million Forecast, by Country 2019 & 2032
- Table 84: Global Cell Therapy Manufacturing Market Volume K Unit Forecast, by Country 2019 & 2032
- Table 85: Germany Cell Therapy Manufacturing Market Revenue (Million) Forecast, by Application 2019 & 2032
- Table 86: Germany Cell Therapy Manufacturing Market Volume (K Unit) Forecast, by Application 2019 & 2032
- Table 87: United Kingdom Cell Therapy Manufacturing Market Revenue (Million) Forecast, by Application 2019 & 2032
- Table 88: United Kingdom Cell Therapy Manufacturing Market Volume (K Unit) Forecast, by Application 2019 & 2032
- Table 89: France Cell Therapy Manufacturing Market Revenue (Million) Forecast, by Application 2019 & 2032
- Table 90: France Cell Therapy Manufacturing Market Volume (K Unit) Forecast, by Application 2019 & 2032
- Table 91: Italy Cell Therapy Manufacturing Market Revenue (Million) Forecast, by Application 2019 & 2032
- Table 92: Italy Cell Therapy Manufacturing Market Volume (K Unit) Forecast, by Application 2019 & 2032
- Table 93: Spain Cell Therapy Manufacturing Market Revenue (Million) Forecast, by Application 2019 & 2032
- Table 94: Spain Cell Therapy Manufacturing Market Volume (K Unit) Forecast, by Application 2019 & 2032
- Table 95: Rest of Europe Cell Therapy Manufacturing Market Revenue (Million) Forecast, by Application 2019 & 2032
- Table 96: Rest of Europe Cell Therapy Manufacturing Market Volume (K Unit) Forecast, by Application 2019 & 2032
- Table 97: Global Cell Therapy Manufacturing Market Revenue Million Forecast, by Type 2019 & 2032
- Table 98: Global Cell Therapy Manufacturing Market Volume K Unit Forecast, by Type 2019 & 2032
- Table 99: Global Cell Therapy Manufacturing Market Revenue Million Forecast, by Therapy 2019 & 2032
- Table 100: Global Cell Therapy Manufacturing Market Volume K Unit Forecast, by Therapy 2019 & 2032
- Table 101: Global Cell Therapy Manufacturing Market Revenue Million Forecast, by Application 2019 & 2032
- Table 102: Global Cell Therapy Manufacturing Market Volume K Unit Forecast, by Application 2019 & 2032
- Table 103: Global Cell Therapy Manufacturing Market Revenue Million Forecast, by Country 2019 & 2032
- Table 104: Global Cell Therapy Manufacturing Market Volume K Unit Forecast, by Country 2019 & 2032
- Table 105: China Cell Therapy Manufacturing Market Revenue (Million) Forecast, by Application 2019 & 2032
- Table 106: China Cell Therapy Manufacturing Market Volume (K Unit) Forecast, by Application 2019 & 2032
- Table 107: Japan Cell Therapy Manufacturing Market Revenue (Million) Forecast, by Application 2019 & 2032
- Table 108: Japan Cell Therapy Manufacturing Market Volume (K Unit) Forecast, by Application 2019 & 2032
- Table 109: India Cell Therapy Manufacturing Market Revenue (Million) Forecast, by Application 2019 & 2032
- Table 110: India Cell Therapy Manufacturing Market Volume (K Unit) Forecast, by Application 2019 & 2032
- Table 111: Australia Cell Therapy Manufacturing Market Revenue (Million) Forecast, by Application 2019 & 2032
- Table 112: Australia Cell Therapy Manufacturing Market Volume (K Unit) Forecast, by Application 2019 & 2032
- Table 113: South Korea Cell Therapy Manufacturing Market Revenue (Million) Forecast, by Application 2019 & 2032
- Table 114: South Korea Cell Therapy Manufacturing Market Volume (K Unit) Forecast, by Application 2019 & 2032
- Table 115: Rest of Asia Pacific Cell Therapy Manufacturing Market Revenue (Million) Forecast, by Application 2019 & 2032
- Table 116: Rest of Asia Pacific Cell Therapy Manufacturing Market Volume (K Unit) Forecast, by Application 2019 & 2032
- Table 117: Global Cell Therapy Manufacturing Market Revenue Million Forecast, by Type 2019 & 2032
- Table 118: Global Cell Therapy Manufacturing Market Volume K Unit Forecast, by Type 2019 & 2032
- Table 119: Global Cell Therapy Manufacturing Market Revenue Million Forecast, by Therapy 2019 & 2032
- Table 120: Global Cell Therapy Manufacturing Market Volume K Unit Forecast, by Therapy 2019 & 2032
- Table 121: Global Cell Therapy Manufacturing Market Revenue Million Forecast, by Application 2019 & 2032
- Table 122: Global Cell Therapy Manufacturing Market Volume K Unit Forecast, by Application 2019 & 2032
- Table 123: Global Cell Therapy Manufacturing Market Revenue Million Forecast, by Country 2019 & 2032
- Table 124: Global Cell Therapy Manufacturing Market Volume K Unit Forecast, by Country 2019 & 2032
- Table 125: GCC Cell Therapy Manufacturing Market Revenue (Million) Forecast, by Application 2019 & 2032
- Table 126: GCC Cell Therapy Manufacturing Market Volume (K Unit) Forecast, by Application 2019 & 2032
- Table 127: South Africa Cell Therapy Manufacturing Market Revenue (Million) Forecast, by Application 2019 & 2032
- Table 128: South Africa Cell Therapy Manufacturing Market Volume (K Unit) Forecast, by Application 2019 & 2032
- Table 129: Rest of Middle East and Africa Cell Therapy Manufacturing Market Revenue (Million) Forecast, by Application 2019 & 2032
- Table 130: Rest of Middle East and Africa Cell Therapy Manufacturing Market Volume (K Unit) Forecast, by Application 2019 & 2032
- Table 131: Global Cell Therapy Manufacturing Market Revenue Million Forecast, by Type 2019 & 2032
- Table 132: Global Cell Therapy Manufacturing Market Volume K Unit Forecast, by Type 2019 & 2032
- Table 133: Global Cell Therapy Manufacturing Market Revenue Million Forecast, by Therapy 2019 & 2032
- Table 134: Global Cell Therapy Manufacturing Market Volume K Unit Forecast, by Therapy 2019 & 2032
- Table 135: Global Cell Therapy Manufacturing Market Revenue Million Forecast, by Application 2019 & 2032
- Table 136: Global Cell Therapy Manufacturing Market Volume K Unit Forecast, by Application 2019 & 2032
- Table 137: Global Cell Therapy Manufacturing Market Revenue Million Forecast, by Country 2019 & 2032
- Table 138: Global Cell Therapy Manufacturing Market Volume K Unit Forecast, by Country 2019 & 2032
- Table 139: Brazil Cell Therapy Manufacturing Market Revenue (Million) Forecast, by Application 2019 & 2032
- Table 140: Brazil Cell Therapy Manufacturing Market Volume (K Unit) Forecast, by Application 2019 & 2032
- Table 141: Argentina Cell Therapy Manufacturing Market Revenue (Million) Forecast, by Application 2019 & 2032
- Table 142: Argentina Cell Therapy Manufacturing Market Volume (K Unit) Forecast, by Application 2019 & 2032
- Table 143: Rest of South America Cell Therapy Manufacturing Market Revenue (Million) Forecast, by Application 2019 & 2032
- Table 144: Rest of South America Cell Therapy Manufacturing Market Volume (K Unit) Forecast, by Application 2019 & 2032
Frequently Asked Questions
1. What is the projected Compound Annual Growth Rate (CAGR) of the Cell Therapy Manufacturing Market?
The projected CAGR is approximately 17.05%.
2. Which companies are prominent players in the Cell Therapy Manufacturing Market?
Key companies in the market include Fibrocell Technologies Inc, Gilead Sciences Inc (Kite Pharma Inc ), Allogene Therapeutics Inc, Stempeutics Research Pvt Ltd, Pharmicell Co Ltd, Novartis AG, Anterogen Co Ltd, Chiesi Farmaceutici SpA, Nipro Corporation, TiGenix (Takeda Pharmaceuticals), Organogenesis Inc , Vericel Corporation, Tego Science, MEDIPOST Co Ltd, Corestem Inc.
3. What are the main segments of the Cell Therapy Manufacturing Market?
The market segments include Type, Therapy, Application.
4. Can you provide details about the market size?
The market size is estimated to be USD XX Million as of 2022.
5. What are some drivers contributing to market growth?
Increasing Prevalence of Chronic Conditions; Rising Adoption of Regenerative Medicine; Rise in Number of Clinical Studies Pertaining to the Development of Cellular Therapies.
6. What are the notable trends driving market growth?
The Allogeneic Therapies Segment is Expected to Account for a Significant Share in the Cell Therapy Market.
7. Are there any restraints impacting market growth?
High Cost of Therapies.
8. Can you provide examples of recent developments in the market?
In January 2022, Immunocore received the Food and Drug Administration approval of KIMMTRAK (tebentafusp-tebn) for the treatment of unresectable or metastatic uveal melanoma.
9. What pricing options are available for accessing the report?
Pricing options include single-user, multi-user, and enterprise licenses priced at USD 4750, USD 5250, and USD 8750 respectively.
10. Is the market size provided in terms of value or volume?
The market size is provided in terms of value, measured in Million and volume, measured in K Unit.
11. Are there any specific market keywords associated with the report?
Yes, the market keyword associated with the report is "Cell Therapy Manufacturing Market," which aids in identifying and referencing the specific market segment covered.
12. How do I determine which pricing option suits my needs best?
The pricing options vary based on user requirements and access needs. Individual users may opt for single-user licenses, while businesses requiring broader access may choose multi-user or enterprise licenses for cost-effective access to the report.
13. Are there any additional resources or data provided in the Cell Therapy Manufacturing Market report?
While the report offers comprehensive insights, it's advisable to review the specific contents or supplementary materials provided to ascertain if additional resources or data are available.
14. How can I stay updated on further developments or reports in the Cell Therapy Manufacturing Market?
To stay informed about further developments, trends, and reports in the Cell Therapy Manufacturing Market, consider subscribing to industry newsletters, following relevant companies and organizations, or regularly checking reputable industry news sources and publications.
Methodology
Step 1 - Identification of Relevant Samples Size from Population Database


Step 2 - Approaches for Defining Global Market Size (Value, Volume* & Price*)

Note*: In applicable scenarios
Step 3 - Data Sources
Primary Research
- Web Analytics
- Survey Reports
- Research Institute
- Latest Research Reports
- Opinion Leaders
Secondary Research
- Annual Reports
- White Paper
- Latest Press Release
- Industry Association
- Paid Database
- Investor Presentations

Step 4 - Data Triangulation
Involves using different sources of information in order to increase the validity of a study
These sources are likely to be stakeholders in a program - participants, other researchers, program staff, other community members, and so on.
Then we put all data in single framework & apply various statistical tools to find out the dynamic on the market.
During the analysis stage, feedback from the stakeholder groups would be compared to determine areas of agreement as well as areas of divergence


