
Key Insights
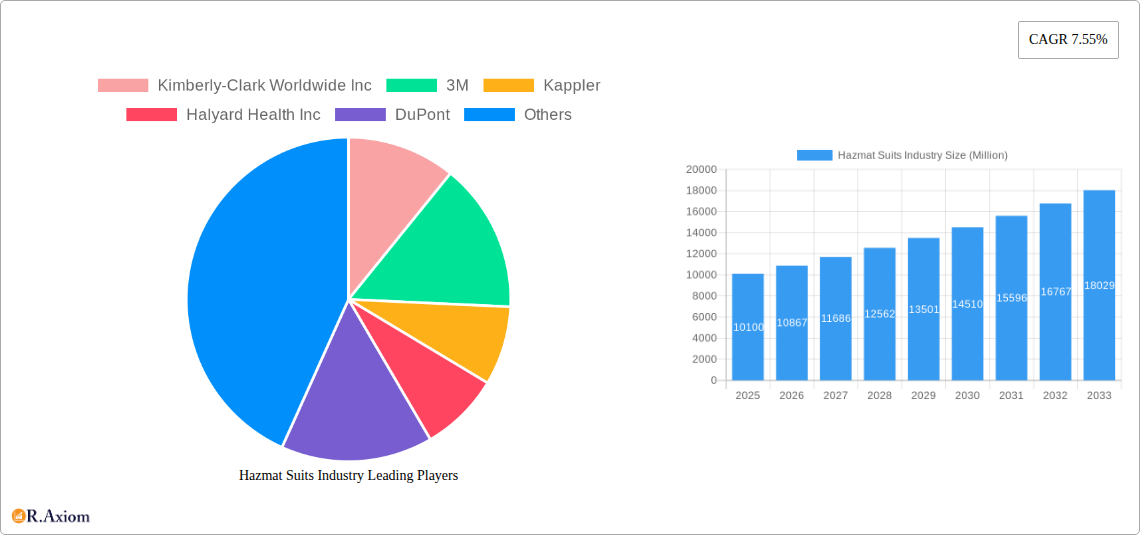
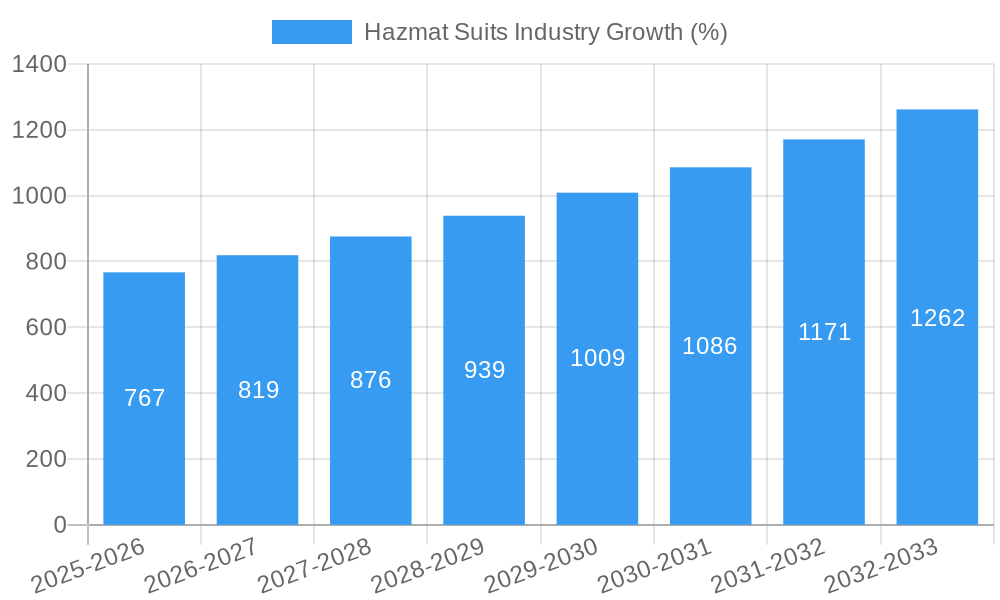
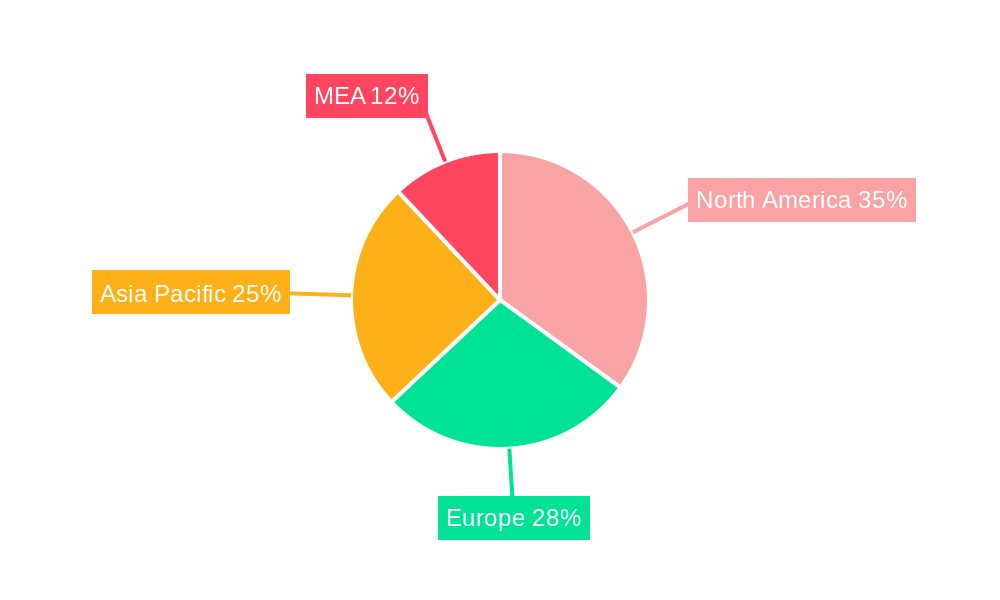
The global hazmat suits market, valued at $10.1 billion in 2025, is projected to experience robust growth, driven by a compound annual growth rate (CAGR) of 7.55% from 2025 to 2033. This expansion is fueled by several key factors. The increasing prevalence of hazardous material handling across diverse industries, including pharmaceuticals, biotechnology, and chemical processing, necessitates the widespread adoption of protective hazmat suits. Stringent government regulations regarding worker safety and environmental protection further contribute to market growth, mandating the use of high-quality protective apparel. Technological advancements leading to the development of lighter, more comfortable, and more effective hazmat suits are also enhancing market appeal. Growth is further supported by rising awareness of biohazards and infectious diseases, particularly following recent global health crises, and the consequent increased demand for advanced protective gear within healthcare and emergency response sectors. However, high initial investment costs associated with advanced hazmat suit technology and the potential for material degradation over time could act as market restraints. The market is segmented by type (Level A, B, C, and D suits, reflecting varying levels of protection), application (chemical waste, infection control, biohazard and hazardous material handling, and fire/high-temperature protection), and end-user (pharmaceutical, biotechnology, and other industries). The North American market currently holds a significant share, driven by strong regulatory frameworks and a large pharmaceutical and chemical industry. However, Asia-Pacific is poised for substantial growth due to rapid industrialization and increasing awareness of safety regulations. Competition within the market is intense, with major players like Kimberly-Clark, 3M, and DuPont vying for market share through product innovation and strategic partnerships.
The market's future growth trajectory will likely be influenced by several factors. Continued technological advancements in material science, leading to the development of more resilient and comfortable hazmat suits, will play a significant role. Furthermore, the increasing frequency and severity of industrial accidents and natural disasters will inevitably drive demand for advanced protective equipment. The market will also likely see further segmentation based on specialized applications, such as suits designed for specific hazardous materials or environments. Companies focusing on sustainable and eco-friendly hazmat suit materials are expected to gain a competitive edge, responding to growing environmental concerns. Regulatory changes and evolving safety standards in various regions will also shape market dynamics, impacting the demand for different types and levels of protection. Overall, the hazmat suits market is anticipated to maintain a positive growth trajectory, driven by a combination of increasing regulatory pressure, technological innovation, and rising awareness of workplace safety and environmental protection.
Hazmat Suits Industry: Market Analysis and Forecast 2019-2033
This comprehensive report provides a detailed analysis of the global Hazmat Suits industry, offering valuable insights for industry stakeholders, investors, and researchers. The report covers the period 2019-2033, with a focus on the forecast period 2025-2033 and a base year of 2025. The global Hazmat Suits market is projected to reach xx Million by 2033, exhibiting a CAGR of xx% during the forecast period. This in-depth study examines market segmentation, competitive landscape, key drivers and challenges, and emerging opportunities.
Hazmat Suits Industry Market Concentration & Innovation
The global hazmat suits market is moderately concentrated, with key players such as Kimberly-Clark Worldwide Inc, 3M, Kappler, Halyard Health Inc, DuPont, Dragerwerk AG & Co KGaA, ANSELL LTD, DGD HAZMAT, Lakeland Inc, MATISEC, Respirex, and Lancs Industries holding significant market share. Market share distribution varies across segments, with some players dominating specific applications or suit types. Recent M&A activities, such as the May 2022 partnership between Kappler and Lakeland to expand into the Indian market, indicate a trend towards strategic alliances and market expansion. Deal values for these activities are currently unavailable (xx Million).
Innovation is driven by the need for enhanced protection against evolving hazardous materials and demanding work environments. Stringent regulatory frameworks, such as those concerning chemical handling and biohazard containment, push manufacturers towards developing more advanced and compliant products. The emergence of substitutes, including specialized protective garments and advanced respiratory equipment, poses a competitive challenge. End-user trends favor lighter, more comfortable, and technologically advanced suits with improved breathability and enhanced visibility features.
- Market Concentration: Moderately concentrated with key players holding significant, but varying, market shares.
- Innovation Drivers: Enhanced protection, regulatory compliance, and competition from substitutes.
- M&A Activity: Strategic alliances and market expansion (e.g., Kappler & Lakeland partnership).
- End-User Trends: Demand for lighter, more comfortable, and technologically advanced suits.
Hazmat Suits Industry Industry Trends & Insights
The hazmat suits market is experiencing robust growth driven by several factors. The increasing prevalence of industrial accidents, chemical spills, and biohazardous outbreaks fuels demand for reliable protective gear. Government regulations mandating the use of appropriate personal protective equipment (PPE) in hazardous work environments further boost market growth. Technological advancements in materials science lead to the development of lighter, more durable, and more comfortable hazmat suits with improved protection capabilities. The rising awareness of workplace safety and the increasing adoption of stringent safety protocols in various industries contribute to market expansion. Furthermore, the growing pharmaceutical and biotechnology industries, requiring specialized protection against infectious agents and hazardous chemicals, significantly impact market growth. The market penetration of advanced hazmat suits incorporating features like improved breathability and enhanced visibility continues to rise. The predicted CAGR for the industry is xx%.
Dominant Markets & Segments in Hazmat Suits Industry
The North American region currently holds a dominant position in the global hazmat suits market, driven by stringent safety regulations, a large industrial base, and a high awareness of workplace safety. However, the Asia-Pacific region is experiencing significant growth, fueled by rapid industrialization and rising government investments in infrastructure development.
- Leading Region: North America (due to stringent regulations and large industrial base)
- High-Growth Region: Asia-Pacific (driven by industrialization and infrastructure investment)
Dominant Segments:
- By Type: Level B suits hold the largest market share due to their versatility and applicability across a broad range of hazardous environments. Level A suits, providing the highest level of protection, are used in specific, high-risk scenarios. Level C and D suits cater to lower-risk environments and are cost-effective alternatives.
- By Application: The chemical waste and infection control segments demonstrate the highest demand, driven by increasing industrial accidents and infectious disease outbreaks. Biohazard and hazardous material handling applications also contribute significantly. The fire/high-temperature segment holds a smaller, yet significant, market share.
- By End-User: The pharmaceutical and biotechnology industries are major drivers of demand, followed by other end-users including healthcare, manufacturing, and emergency response teams.
Key Drivers for Dominant Segments:
- Chemical Waste: Stringent regulations on waste disposal and handling.
- Infection Control: Outbreaks of infectious diseases and enhanced healthcare safety protocols.
- Pharmaceutical/Biotechnology: Demand for high-level protection in research and manufacturing.
- North America: Stringent safety regulations and a large industrial base.
- Asia-Pacific: Rapid industrialization and infrastructure development.
Hazmat Suits Industry Product Developments
Recent innovations in hazmat suit technology focus on improving comfort, breathability, and overall performance. Lightweight and flexible materials are being incorporated, improving wearer agility. Enhanced designs, such as integrated air conditioning systems (as seen in MBO Group's 2022 development), address the challenges of prolonged wear in hot and humid conditions. Advanced filtration systems provide superior protection against a wider range of hazardous substances. These advancements contribute to increased market adoption and improved worker safety.
Report Scope & Segmentation Analysis
This report provides a comprehensive analysis of the hazmat suits market, segmented by type (Level A, B, C, D), application (Chemical Waste, Infection Control, Bio-hazard and Hazardous Material, Fire/High Temperatures), and end-user (Pharmaceutical Industry, Biotechnology Industry, Other End Users). Each segment's growth projections, market size, and competitive dynamics are analyzed, offering a detailed understanding of the market landscape. The report provides detailed information on market size and growth projections for each of these segments. Competitive dynamics are influenced by factors such as pricing strategies, product differentiation, and technological advancements.
Key Drivers of Hazmat Suits Industry Growth
The hazmat suits market is driven by factors such as the rising incidence of industrial accidents and chemical spills, increasing awareness of workplace safety, stringent government regulations mandating the use of PPE, advancements in material science leading to the development of improved protective suits, and the growth of industries like pharmaceuticals and biotechnology requiring specialized protection. Technological advancements are crucial, with new materials and designs enhancing safety and comfort. Government regulations significantly impact market growth by imposing mandatory PPE usage in specific industries.
Challenges in the Hazmat Suits Industry Sector
Challenges in the hazmat suits industry include stringent regulatory compliance requirements, which increase production costs and limit market entry for smaller players. Supply chain disruptions and fluctuations in raw material prices affect production and profitability. Intense competition from established players with large manufacturing capacities and well-established distribution networks poses a challenge for new entrants. These factors influence overall market dynamics and impact profitability.
Emerging Opportunities in Hazmat Suits Industry
Emerging opportunities lie in developing technologically advanced hazmat suits with enhanced features, such as improved breathability, integrated air conditioning systems, and enhanced mobility. Expanding into new markets with growing industrial activity and increasing awareness of workplace safety presents significant growth potential. The development of specialized suits for niche applications, such as handling specific hazardous materials or working in extreme environments, represents another promising area.
Leading Players in the Hazmat Suits Industry Market
- 3M
- Kimberly-Clark Worldwide Inc
- Kappler
- Halyard Health Inc
- DuPont
- Dragerwerk AG & Co KGaA
- ANSELL LTD
- DGD HAZMAT
- Lakeland Inc
- MATISEC
- Respirex
- Lancs Industries
Key Developments in Hazmat Suits Industry Industry
- July 2022: MBO Group launched a wearable air-conditioning system for hazmat-suited workers, enhancing comfort during prolonged use.
- May 2022: Kappler and Lakeland partnered to expand chemical worker protection in India, increasing market access for Kappler's products.
Strategic Outlook for Hazmat Suits Industry Market
The hazmat suits market is poised for continued growth, driven by technological advancements, increasing industrial activity, and a growing focus on worker safety. Expanding into new markets, developing innovative products with enhanced features, and focusing on sustainable and environmentally friendly manufacturing practices will be key strategic priorities for market players. The continued implementation of stringent safety regulations will also propel market expansion.
Hazmat Suits Industry Segmentation
-
1. Type
- 1.1. Level A
- 1.2. Level B
- 1.3. Level C
- 1.4. Level D
-
2. Application
- 2.1. Chemical Waste
- 2.2. Infection Control
- 2.3. Bio-hazard and Hazardous Material
- 2.4. Fire/High Temperatures
-
3. End-User
- 3.1. Pharmaceutical Industry
- 3.2. Biotechnology Industry
- 3.3. Other End Users
Hazmat Suits Industry Segmentation By Geography
-
1. North America
- 1.1. United States
- 1.2. Canada
- 1.3. Mexico
-
2. Europe
- 2.1. Germany
- 2.2. United Kingdom
- 2.3. France
- 2.4. Italy
- 2.5. Spain
- 2.6. Rest of Europe
-
3. Asia Pacific
- 3.1. China
- 3.2. Japan
- 3.3. India
- 3.4. Australia
- 3.5. South Korea
- 3.6. Rest of Asia Pacific
-
4. Middle East and Africa
- 4.1. GCC
- 4.2. South Africa
- 4.3. Rest of Middle East and Africa
-
5. South America
- 5.1. Brazil
- 5.2. Argentina
- 5.3. Rest of South America
Hazmat Suits Industry REPORT HIGHLIGHTS
| Aspects | Details |
|---|---|
| Study Period | 2019-2033 |
| Base Year | 2024 |
| Estimated Year | 2025 |
| Forecast Period | 2025-2033 |
| Historical Period | 2019-2024 |
| Growth Rate | CAGR of 7.55% from 2019-2033 |
| Segmentation |
|
Table of Contents
- 1. Introduction
- 1.1. Research Scope
- 1.2. Market Segmentation
- 1.3. Research Methodology
- 1.4. Definitions and Assumptions
- 2. Executive Summary
- 2.1. Introduction
- 3. Market Dynamics
- 3.1. Introduction
- 3.2. Market Drivers
- 3.2.1 Governments and regulatory bodies are implementing stricter safety standards regarding hazardous materials handling
- 3.2.2 driving demand for effective protective equipment
- 3.2.3 including hazmat suits
- 3.3. Market Restrains
- 3.3.1. The prevalence of counterfeit and substandard protective gear in the market poses significant risks to users and can undermine the integrity of the industry
- 3.4. Market Trends
- 3.4.1 Ongoing research and innovation in materials science are leading to the development of lighter
- 3.4.2 more breathable
- 3.4.3 and more protective hazmat suits that enhance wearer comfort and safety
- 4. Market Factor Analysis
- 4.1. Porters Five Forces
- 4.2. Supply/Value Chain
- 4.3. PESTEL analysis
- 4.4. Market Entropy
- 4.5. Patent/Trademark Analysis
- 5. Global Hazmat Suits Industry Analysis, Insights and Forecast, 2019-2031
- 5.1. Market Analysis, Insights and Forecast - by Type
- 5.1.1. Level A
- 5.1.2. Level B
- 5.1.3. Level C
- 5.1.4. Level D
- 5.2. Market Analysis, Insights and Forecast - by Application
- 5.2.1. Chemical Waste
- 5.2.2. Infection Control
- 5.2.3. Bio-hazard and Hazardous Material
- 5.2.4. Fire/High Temperatures
- 5.3. Market Analysis, Insights and Forecast - by End-User
- 5.3.1. Pharmaceutical Industry
- 5.3.2. Biotechnology Industry
- 5.3.3. Other End Users
- 5.4. Market Analysis, Insights and Forecast - by Region
- 5.4.1. North America
- 5.4.2. Europe
- 5.4.3. Asia Pacific
- 5.4.4. Middle East and Africa
- 5.4.5. South America
- 5.1. Market Analysis, Insights and Forecast - by Type
- 6. North America Hazmat Suits Industry Analysis, Insights and Forecast, 2019-2031
- 6.1. Market Analysis, Insights and Forecast - by Type
- 6.1.1. Level A
- 6.1.2. Level B
- 6.1.3. Level C
- 6.1.4. Level D
- 6.2. Market Analysis, Insights and Forecast - by Application
- 6.2.1. Chemical Waste
- 6.2.2. Infection Control
- 6.2.3. Bio-hazard and Hazardous Material
- 6.2.4. Fire/High Temperatures
- 6.3. Market Analysis, Insights and Forecast - by End-User
- 6.3.1. Pharmaceutical Industry
- 6.3.2. Biotechnology Industry
- 6.3.3. Other End Users
- 6.1. Market Analysis, Insights and Forecast - by Type
- 7. Europe Hazmat Suits Industry Analysis, Insights and Forecast, 2019-2031
- 7.1. Market Analysis, Insights and Forecast - by Type
- 7.1.1. Level A
- 7.1.2. Level B
- 7.1.3. Level C
- 7.1.4. Level D
- 7.2. Market Analysis, Insights and Forecast - by Application
- 7.2.1. Chemical Waste
- 7.2.2. Infection Control
- 7.2.3. Bio-hazard and Hazardous Material
- 7.2.4. Fire/High Temperatures
- 7.3. Market Analysis, Insights and Forecast - by End-User
- 7.3.1. Pharmaceutical Industry
- 7.3.2. Biotechnology Industry
- 7.3.3. Other End Users
- 7.1. Market Analysis, Insights and Forecast - by Type
- 8. Asia Pacific Hazmat Suits Industry Analysis, Insights and Forecast, 2019-2031
- 8.1. Market Analysis, Insights and Forecast - by Type
- 8.1.1. Level A
- 8.1.2. Level B
- 8.1.3. Level C
- 8.1.4. Level D
- 8.2. Market Analysis, Insights and Forecast - by Application
- 8.2.1. Chemical Waste
- 8.2.2. Infection Control
- 8.2.3. Bio-hazard and Hazardous Material
- 8.2.4. Fire/High Temperatures
- 8.3. Market Analysis, Insights and Forecast - by End-User
- 8.3.1. Pharmaceutical Industry
- 8.3.2. Biotechnology Industry
- 8.3.3. Other End Users
- 8.1. Market Analysis, Insights and Forecast - by Type
- 9. Middle East and Africa Hazmat Suits Industry Analysis, Insights and Forecast, 2019-2031
- 9.1. Market Analysis, Insights and Forecast - by Type
- 9.1.1. Level A
- 9.1.2. Level B
- 9.1.3. Level C
- 9.1.4. Level D
- 9.2. Market Analysis, Insights and Forecast - by Application
- 9.2.1. Chemical Waste
- 9.2.2. Infection Control
- 9.2.3. Bio-hazard and Hazardous Material
- 9.2.4. Fire/High Temperatures
- 9.3. Market Analysis, Insights and Forecast - by End-User
- 9.3.1. Pharmaceutical Industry
- 9.3.2. Biotechnology Industry
- 9.3.3. Other End Users
- 9.1. Market Analysis, Insights and Forecast - by Type
- 10. South America Hazmat Suits Industry Analysis, Insights and Forecast, 2019-2031
- 10.1. Market Analysis, Insights and Forecast - by Type
- 10.1.1. Level A
- 10.1.2. Level B
- 10.1.3. Level C
- 10.1.4. Level D
- 10.2. Market Analysis, Insights and Forecast - by Application
- 10.2.1. Chemical Waste
- 10.2.2. Infection Control
- 10.2.3. Bio-hazard and Hazardous Material
- 10.2.4. Fire/High Temperatures
- 10.3. Market Analysis, Insights and Forecast - by End-User
- 10.3.1. Pharmaceutical Industry
- 10.3.2. Biotechnology Industry
- 10.3.3. Other End Users
- 10.1. Market Analysis, Insights and Forecast - by Type
- 11. North America Hazmat Suits Industry Analysis, Insights and Forecast, 2019-2031
- 11.1. Market Analysis, Insights and Forecast - By Country/Sub-region
- 11.1.1 United States
- 11.1.2 Canada
- 11.1.3 Mexico
- 12. South America Hazmat Suits Industry Analysis, Insights and Forecast, 2019-2031
- 12.1. Market Analysis, Insights and Forecast - By Country/Sub-region
- 12.1.1 Brazil
- 12.1.2 Mexico
- 12.1.3 Rest of South America
- 13. Europe Hazmat Suits Industry Analysis, Insights and Forecast, 2019-2031
- 13.1. Market Analysis, Insights and Forecast - By Country/Sub-region
- 13.1.1 United Kingdom
- 13.1.2 Germany
- 13.1.3 France
- 13.1.4 Italy
- 13.1.5 Spain
- 13.1.6 Russia
- 13.1.7 Rest of Europe
- 14. Asia Pacific Hazmat Suits Industry Analysis, Insights and Forecast, 2019-2031
- 14.1. Market Analysis, Insights and Forecast - By Country/Sub-region
- 14.1.1 China
- 14.1.2 Japan
- 14.1.3 India
- 14.1.4 South Korea
- 14.1.5 Taiwan
- 14.1.6 Australia
- 14.1.7 Rest of Asia-Pacific
- 15. MEA Hazmat Suits Industry Analysis, Insights and Forecast, 2019-2031
- 15.1. Market Analysis, Insights and Forecast - By Country/Sub-region
- 15.1.1 Middle East
- 15.1.2 Africa
- 16. Competitive Analysis
- 16.1. Global Market Share Analysis 2024
- 16.2. Company Profiles
- 16.2.1 Kimberly-Clark Worldwide Inc
- 16.2.1.1. Overview
- 16.2.1.2. Products
- 16.2.1.3. SWOT Analysis
- 16.2.1.4. Recent Developments
- 16.2.1.5. Financials (Based on Availability)
- 16.2.2 3M
- 16.2.2.1. Overview
- 16.2.2.2. Products
- 16.2.2.3. SWOT Analysis
- 16.2.2.4. Recent Developments
- 16.2.2.5. Financials (Based on Availability)
- 16.2.3 Kappler
- 16.2.3.1. Overview
- 16.2.3.2. Products
- 16.2.3.3. SWOT Analysis
- 16.2.3.4. Recent Developments
- 16.2.3.5. Financials (Based on Availability)
- 16.2.4 Halyard Health Inc
- 16.2.4.1. Overview
- 16.2.4.2. Products
- 16.2.4.3. SWOT Analysis
- 16.2.4.4. Recent Developments
- 16.2.4.5. Financials (Based on Availability)
- 16.2.5 DuPont
- 16.2.5.1. Overview
- 16.2.5.2. Products
- 16.2.5.3. SWOT Analysis
- 16.2.5.4. Recent Developments
- 16.2.5.5. Financials (Based on Availability)
- 16.2.6 Dragerwerk AG & Co KGaA
- 16.2.6.1. Overview
- 16.2.6.2. Products
- 16.2.6.3. SWOT Analysis
- 16.2.6.4. Recent Developments
- 16.2.6.5. Financials (Based on Availability)
- 16.2.7 ANSELL LTD
- 16.2.7.1. Overview
- 16.2.7.2. Products
- 16.2.7.3. SWOT Analysis
- 16.2.7.4. Recent Developments
- 16.2.7.5. Financials (Based on Availability)
- 16.2.8 DGD HAZMAT
- 16.2.8.1. Overview
- 16.2.8.2. Products
- 16.2.8.3. SWOT Analysis
- 16.2.8.4. Recent Developments
- 16.2.8.5. Financials (Based on Availability)
- 16.2.9 Lakeland Inc
- 16.2.9.1. Overview
- 16.2.9.2. Products
- 16.2.9.3. SWOT Analysis
- 16.2.9.4. Recent Developments
- 16.2.9.5. Financials (Based on Availability)
- 16.2.10 MATISEC
- 16.2.10.1. Overview
- 16.2.10.2. Products
- 16.2.10.3. SWOT Analysis
- 16.2.10.4. Recent Developments
- 16.2.10.5. Financials (Based on Availability)
- 16.2.11 Respirex
- 16.2.11.1. Overview
- 16.2.11.2. Products
- 16.2.11.3. SWOT Analysis
- 16.2.11.4. Recent Developments
- 16.2.11.5. Financials (Based on Availability)
- 16.2.12 Lancs Industries
- 16.2.12.1. Overview
- 16.2.12.2. Products
- 16.2.12.3. SWOT Analysis
- 16.2.12.4. Recent Developments
- 16.2.12.5. Financials (Based on Availability)
- 16.2.1 Kimberly-Clark Worldwide Inc
List of Figures
- Figure 1: Global Hazmat Suits Industry Revenue Breakdown (Million, %) by Region 2024 & 2032
- Figure 2: Global Hazmat Suits Industry Volume Breakdown (K Units, %) by Region 2024 & 2032
- Figure 3: North America Hazmat Suits Industry Revenue (Million), by Country 2024 & 2032
- Figure 4: North America Hazmat Suits Industry Volume (K Units), by Country 2024 & 2032
- Figure 5: North America Hazmat Suits Industry Revenue Share (%), by Country 2024 & 2032
- Figure 6: North America Hazmat Suits Industry Volume Share (%), by Country 2024 & 2032
- Figure 7: South America Hazmat Suits Industry Revenue (Million), by Country 2024 & 2032
- Figure 8: South America Hazmat Suits Industry Volume (K Units), by Country 2024 & 2032
- Figure 9: South America Hazmat Suits Industry Revenue Share (%), by Country 2024 & 2032
- Figure 10: South America Hazmat Suits Industry Volume Share (%), by Country 2024 & 2032
- Figure 11: Europe Hazmat Suits Industry Revenue (Million), by Country 2024 & 2032
- Figure 12: Europe Hazmat Suits Industry Volume (K Units), by Country 2024 & 2032
- Figure 13: Europe Hazmat Suits Industry Revenue Share (%), by Country 2024 & 2032
- Figure 14: Europe Hazmat Suits Industry Volume Share (%), by Country 2024 & 2032
- Figure 15: Asia Pacific Hazmat Suits Industry Revenue (Million), by Country 2024 & 2032
- Figure 16: Asia Pacific Hazmat Suits Industry Volume (K Units), by Country 2024 & 2032
- Figure 17: Asia Pacific Hazmat Suits Industry Revenue Share (%), by Country 2024 & 2032
- Figure 18: Asia Pacific Hazmat Suits Industry Volume Share (%), by Country 2024 & 2032
- Figure 19: MEA Hazmat Suits Industry Revenue (Million), by Country 2024 & 2032
- Figure 20: MEA Hazmat Suits Industry Volume (K Units), by Country 2024 & 2032
- Figure 21: MEA Hazmat Suits Industry Revenue Share (%), by Country 2024 & 2032
- Figure 22: MEA Hazmat Suits Industry Volume Share (%), by Country 2024 & 2032
- Figure 23: North America Hazmat Suits Industry Revenue (Million), by Type 2024 & 2032
- Figure 24: North America Hazmat Suits Industry Volume (K Units), by Type 2024 & 2032
- Figure 25: North America Hazmat Suits Industry Revenue Share (%), by Type 2024 & 2032
- Figure 26: North America Hazmat Suits Industry Volume Share (%), by Type 2024 & 2032
- Figure 27: North America Hazmat Suits Industry Revenue (Million), by Application 2024 & 2032
- Figure 28: North America Hazmat Suits Industry Volume (K Units), by Application 2024 & 2032
- Figure 29: North America Hazmat Suits Industry Revenue Share (%), by Application 2024 & 2032
- Figure 30: North America Hazmat Suits Industry Volume Share (%), by Application 2024 & 2032
- Figure 31: North America Hazmat Suits Industry Revenue (Million), by End-User 2024 & 2032
- Figure 32: North America Hazmat Suits Industry Volume (K Units), by End-User 2024 & 2032
- Figure 33: North America Hazmat Suits Industry Revenue Share (%), by End-User 2024 & 2032
- Figure 34: North America Hazmat Suits Industry Volume Share (%), by End-User 2024 & 2032
- Figure 35: North America Hazmat Suits Industry Revenue (Million), by Country 2024 & 2032
- Figure 36: North America Hazmat Suits Industry Volume (K Units), by Country 2024 & 2032
- Figure 37: North America Hazmat Suits Industry Revenue Share (%), by Country 2024 & 2032
- Figure 38: North America Hazmat Suits Industry Volume Share (%), by Country 2024 & 2032
- Figure 39: Europe Hazmat Suits Industry Revenue (Million), by Type 2024 & 2032
- Figure 40: Europe Hazmat Suits Industry Volume (K Units), by Type 2024 & 2032
- Figure 41: Europe Hazmat Suits Industry Revenue Share (%), by Type 2024 & 2032
- Figure 42: Europe Hazmat Suits Industry Volume Share (%), by Type 2024 & 2032
- Figure 43: Europe Hazmat Suits Industry Revenue (Million), by Application 2024 & 2032
- Figure 44: Europe Hazmat Suits Industry Volume (K Units), by Application 2024 & 2032
- Figure 45: Europe Hazmat Suits Industry Revenue Share (%), by Application 2024 & 2032
- Figure 46: Europe Hazmat Suits Industry Volume Share (%), by Application 2024 & 2032
- Figure 47: Europe Hazmat Suits Industry Revenue (Million), by End-User 2024 & 2032
- Figure 48: Europe Hazmat Suits Industry Volume (K Units), by End-User 2024 & 2032
- Figure 49: Europe Hazmat Suits Industry Revenue Share (%), by End-User 2024 & 2032
- Figure 50: Europe Hazmat Suits Industry Volume Share (%), by End-User 2024 & 2032
- Figure 51: Europe Hazmat Suits Industry Revenue (Million), by Country 2024 & 2032
- Figure 52: Europe Hazmat Suits Industry Volume (K Units), by Country 2024 & 2032
- Figure 53: Europe Hazmat Suits Industry Revenue Share (%), by Country 2024 & 2032
- Figure 54: Europe Hazmat Suits Industry Volume Share (%), by Country 2024 & 2032
- Figure 55: Asia Pacific Hazmat Suits Industry Revenue (Million), by Type 2024 & 2032
- Figure 56: Asia Pacific Hazmat Suits Industry Volume (K Units), by Type 2024 & 2032
- Figure 57: Asia Pacific Hazmat Suits Industry Revenue Share (%), by Type 2024 & 2032
- Figure 58: Asia Pacific Hazmat Suits Industry Volume Share (%), by Type 2024 & 2032
- Figure 59: Asia Pacific Hazmat Suits Industry Revenue (Million), by Application 2024 & 2032
- Figure 60: Asia Pacific Hazmat Suits Industry Volume (K Units), by Application 2024 & 2032
- Figure 61: Asia Pacific Hazmat Suits Industry Revenue Share (%), by Application 2024 & 2032
- Figure 62: Asia Pacific Hazmat Suits Industry Volume Share (%), by Application 2024 & 2032
- Figure 63: Asia Pacific Hazmat Suits Industry Revenue (Million), by End-User 2024 & 2032
- Figure 64: Asia Pacific Hazmat Suits Industry Volume (K Units), by End-User 2024 & 2032
- Figure 65: Asia Pacific Hazmat Suits Industry Revenue Share (%), by End-User 2024 & 2032
- Figure 66: Asia Pacific Hazmat Suits Industry Volume Share (%), by End-User 2024 & 2032
- Figure 67: Asia Pacific Hazmat Suits Industry Revenue (Million), by Country 2024 & 2032
- Figure 68: Asia Pacific Hazmat Suits Industry Volume (K Units), by Country 2024 & 2032
- Figure 69: Asia Pacific Hazmat Suits Industry Revenue Share (%), by Country 2024 & 2032
- Figure 70: Asia Pacific Hazmat Suits Industry Volume Share (%), by Country 2024 & 2032
- Figure 71: Middle East and Africa Hazmat Suits Industry Revenue (Million), by Type 2024 & 2032
- Figure 72: Middle East and Africa Hazmat Suits Industry Volume (K Units), by Type 2024 & 2032
- Figure 73: Middle East and Africa Hazmat Suits Industry Revenue Share (%), by Type 2024 & 2032
- Figure 74: Middle East and Africa Hazmat Suits Industry Volume Share (%), by Type 2024 & 2032
- Figure 75: Middle East and Africa Hazmat Suits Industry Revenue (Million), by Application 2024 & 2032
- Figure 76: Middle East and Africa Hazmat Suits Industry Volume (K Units), by Application 2024 & 2032
- Figure 77: Middle East and Africa Hazmat Suits Industry Revenue Share (%), by Application 2024 & 2032
- Figure 78: Middle East and Africa Hazmat Suits Industry Volume Share (%), by Application 2024 & 2032
- Figure 79: Middle East and Africa Hazmat Suits Industry Revenue (Million), by End-User 2024 & 2032
- Figure 80: Middle East and Africa Hazmat Suits Industry Volume (K Units), by End-User 2024 & 2032
- Figure 81: Middle East and Africa Hazmat Suits Industry Revenue Share (%), by End-User 2024 & 2032
- Figure 82: Middle East and Africa Hazmat Suits Industry Volume Share (%), by End-User 2024 & 2032
- Figure 83: Middle East and Africa Hazmat Suits Industry Revenue (Million), by Country 2024 & 2032
- Figure 84: Middle East and Africa Hazmat Suits Industry Volume (K Units), by Country 2024 & 2032
- Figure 85: Middle East and Africa Hazmat Suits Industry Revenue Share (%), by Country 2024 & 2032
- Figure 86: Middle East and Africa Hazmat Suits Industry Volume Share (%), by Country 2024 & 2032
- Figure 87: South America Hazmat Suits Industry Revenue (Million), by Type 2024 & 2032
- Figure 88: South America Hazmat Suits Industry Volume (K Units), by Type 2024 & 2032
- Figure 89: South America Hazmat Suits Industry Revenue Share (%), by Type 2024 & 2032
- Figure 90: South America Hazmat Suits Industry Volume Share (%), by Type 2024 & 2032
- Figure 91: South America Hazmat Suits Industry Revenue (Million), by Application 2024 & 2032
- Figure 92: South America Hazmat Suits Industry Volume (K Units), by Application 2024 & 2032
- Figure 93: South America Hazmat Suits Industry Revenue Share (%), by Application 2024 & 2032
- Figure 94: South America Hazmat Suits Industry Volume Share (%), by Application 2024 & 2032
- Figure 95: South America Hazmat Suits Industry Revenue (Million), by End-User 2024 & 2032
- Figure 96: South America Hazmat Suits Industry Volume (K Units), by End-User 2024 & 2032
- Figure 97: South America Hazmat Suits Industry Revenue Share (%), by End-User 2024 & 2032
- Figure 98: South America Hazmat Suits Industry Volume Share (%), by End-User 2024 & 2032
- Figure 99: South America Hazmat Suits Industry Revenue (Million), by Country 2024 & 2032
- Figure 100: South America Hazmat Suits Industry Volume (K Units), by Country 2024 & 2032
- Figure 101: South America Hazmat Suits Industry Revenue Share (%), by Country 2024 & 2032
- Figure 102: South America Hazmat Suits Industry Volume Share (%), by Country 2024 & 2032
List of Tables
- Table 1: Global Hazmat Suits Industry Revenue Million Forecast, by Region 2019 & 2032
- Table 2: Global Hazmat Suits Industry Volume K Units Forecast, by Region 2019 & 2032
- Table 3: Global Hazmat Suits Industry Revenue Million Forecast, by Type 2019 & 2032
- Table 4: Global Hazmat Suits Industry Volume K Units Forecast, by Type 2019 & 2032
- Table 5: Global Hazmat Suits Industry Revenue Million Forecast, by Application 2019 & 2032
- Table 6: Global Hazmat Suits Industry Volume K Units Forecast, by Application 2019 & 2032
- Table 7: Global Hazmat Suits Industry Revenue Million Forecast, by End-User 2019 & 2032
- Table 8: Global Hazmat Suits Industry Volume K Units Forecast, by End-User 2019 & 2032
- Table 9: Global Hazmat Suits Industry Revenue Million Forecast, by Region 2019 & 2032
- Table 10: Global Hazmat Suits Industry Volume K Units Forecast, by Region 2019 & 2032
- Table 11: Global Hazmat Suits Industry Revenue Million Forecast, by Country 2019 & 2032
- Table 12: Global Hazmat Suits Industry Volume K Units Forecast, by Country 2019 & 2032
- Table 13: United States Hazmat Suits Industry Revenue (Million) Forecast, by Application 2019 & 2032
- Table 14: United States Hazmat Suits Industry Volume (K Units) Forecast, by Application 2019 & 2032
- Table 15: Canada Hazmat Suits Industry Revenue (Million) Forecast, by Application 2019 & 2032
- Table 16: Canada Hazmat Suits Industry Volume (K Units) Forecast, by Application 2019 & 2032
- Table 17: Mexico Hazmat Suits Industry Revenue (Million) Forecast, by Application 2019 & 2032
- Table 18: Mexico Hazmat Suits Industry Volume (K Units) Forecast, by Application 2019 & 2032
- Table 19: Global Hazmat Suits Industry Revenue Million Forecast, by Country 2019 & 2032
- Table 20: Global Hazmat Suits Industry Volume K Units Forecast, by Country 2019 & 2032
- Table 21: Brazil Hazmat Suits Industry Revenue (Million) Forecast, by Application 2019 & 2032
- Table 22: Brazil Hazmat Suits Industry Volume (K Units) Forecast, by Application 2019 & 2032
- Table 23: Mexico Hazmat Suits Industry Revenue (Million) Forecast, by Application 2019 & 2032
- Table 24: Mexico Hazmat Suits Industry Volume (K Units) Forecast, by Application 2019 & 2032
- Table 25: Rest of South America Hazmat Suits Industry Revenue (Million) Forecast, by Application 2019 & 2032
- Table 26: Rest of South America Hazmat Suits Industry Volume (K Units) Forecast, by Application 2019 & 2032
- Table 27: Global Hazmat Suits Industry Revenue Million Forecast, by Country 2019 & 2032
- Table 28: Global Hazmat Suits Industry Volume K Units Forecast, by Country 2019 & 2032
- Table 29: United Kingdom Hazmat Suits Industry Revenue (Million) Forecast, by Application 2019 & 2032
- Table 30: United Kingdom Hazmat Suits Industry Volume (K Units) Forecast, by Application 2019 & 2032
- Table 31: Germany Hazmat Suits Industry Revenue (Million) Forecast, by Application 2019 & 2032
- Table 32: Germany Hazmat Suits Industry Volume (K Units) Forecast, by Application 2019 & 2032
- Table 33: France Hazmat Suits Industry Revenue (Million) Forecast, by Application 2019 & 2032
- Table 34: France Hazmat Suits Industry Volume (K Units) Forecast, by Application 2019 & 2032
- Table 35: Italy Hazmat Suits Industry Revenue (Million) Forecast, by Application 2019 & 2032
- Table 36: Italy Hazmat Suits Industry Volume (K Units) Forecast, by Application 2019 & 2032
- Table 37: Spain Hazmat Suits Industry Revenue (Million) Forecast, by Application 2019 & 2032
- Table 38: Spain Hazmat Suits Industry Volume (K Units) Forecast, by Application 2019 & 2032
- Table 39: Russia Hazmat Suits Industry Revenue (Million) Forecast, by Application 2019 & 2032
- Table 40: Russia Hazmat Suits Industry Volume (K Units) Forecast, by Application 2019 & 2032
- Table 41: Rest of Europe Hazmat Suits Industry Revenue (Million) Forecast, by Application 2019 & 2032
- Table 42: Rest of Europe Hazmat Suits Industry Volume (K Units) Forecast, by Application 2019 & 2032
- Table 43: Global Hazmat Suits Industry Revenue Million Forecast, by Country 2019 & 2032
- Table 44: Global Hazmat Suits Industry Volume K Units Forecast, by Country 2019 & 2032
- Table 45: China Hazmat Suits Industry Revenue (Million) Forecast, by Application 2019 & 2032
- Table 46: China Hazmat Suits Industry Volume (K Units) Forecast, by Application 2019 & 2032
- Table 47: Japan Hazmat Suits Industry Revenue (Million) Forecast, by Application 2019 & 2032
- Table 48: Japan Hazmat Suits Industry Volume (K Units) Forecast, by Application 2019 & 2032
- Table 49: India Hazmat Suits Industry Revenue (Million) Forecast, by Application 2019 & 2032
- Table 50: India Hazmat Suits Industry Volume (K Units) Forecast, by Application 2019 & 2032
- Table 51: South Korea Hazmat Suits Industry Revenue (Million) Forecast, by Application 2019 & 2032
- Table 52: South Korea Hazmat Suits Industry Volume (K Units) Forecast, by Application 2019 & 2032
- Table 53: Taiwan Hazmat Suits Industry Revenue (Million) Forecast, by Application 2019 & 2032
- Table 54: Taiwan Hazmat Suits Industry Volume (K Units) Forecast, by Application 2019 & 2032
- Table 55: Australia Hazmat Suits Industry Revenue (Million) Forecast, by Application 2019 & 2032
- Table 56: Australia Hazmat Suits Industry Volume (K Units) Forecast, by Application 2019 & 2032
- Table 57: Rest of Asia-Pacific Hazmat Suits Industry Revenue (Million) Forecast, by Application 2019 & 2032
- Table 58: Rest of Asia-Pacific Hazmat Suits Industry Volume (K Units) Forecast, by Application 2019 & 2032
- Table 59: Global Hazmat Suits Industry Revenue Million Forecast, by Country 2019 & 2032
- Table 60: Global Hazmat Suits Industry Volume K Units Forecast, by Country 2019 & 2032
- Table 61: Middle East Hazmat Suits Industry Revenue (Million) Forecast, by Application 2019 & 2032
- Table 62: Middle East Hazmat Suits Industry Volume (K Units) Forecast, by Application 2019 & 2032
- Table 63: Africa Hazmat Suits Industry Revenue (Million) Forecast, by Application 2019 & 2032
- Table 64: Africa Hazmat Suits Industry Volume (K Units) Forecast, by Application 2019 & 2032
- Table 65: Global Hazmat Suits Industry Revenue Million Forecast, by Type 2019 & 2032
- Table 66: Global Hazmat Suits Industry Volume K Units Forecast, by Type 2019 & 2032
- Table 67: Global Hazmat Suits Industry Revenue Million Forecast, by Application 2019 & 2032
- Table 68: Global Hazmat Suits Industry Volume K Units Forecast, by Application 2019 & 2032
- Table 69: Global Hazmat Suits Industry Revenue Million Forecast, by End-User 2019 & 2032
- Table 70: Global Hazmat Suits Industry Volume K Units Forecast, by End-User 2019 & 2032
- Table 71: Global Hazmat Suits Industry Revenue Million Forecast, by Country 2019 & 2032
- Table 72: Global Hazmat Suits Industry Volume K Units Forecast, by Country 2019 & 2032
- Table 73: United States Hazmat Suits Industry Revenue (Million) Forecast, by Application 2019 & 2032
- Table 74: United States Hazmat Suits Industry Volume (K Units) Forecast, by Application 2019 & 2032
- Table 75: Canada Hazmat Suits Industry Revenue (Million) Forecast, by Application 2019 & 2032
- Table 76: Canada Hazmat Suits Industry Volume (K Units) Forecast, by Application 2019 & 2032
- Table 77: Mexico Hazmat Suits Industry Revenue (Million) Forecast, by Application 2019 & 2032
- Table 78: Mexico Hazmat Suits Industry Volume (K Units) Forecast, by Application 2019 & 2032
- Table 79: Global Hazmat Suits Industry Revenue Million Forecast, by Type 2019 & 2032
- Table 80: Global Hazmat Suits Industry Volume K Units Forecast, by Type 2019 & 2032
- Table 81: Global Hazmat Suits Industry Revenue Million Forecast, by Application 2019 & 2032
- Table 82: Global Hazmat Suits Industry Volume K Units Forecast, by Application 2019 & 2032
- Table 83: Global Hazmat Suits Industry Revenue Million Forecast, by End-User 2019 & 2032
- Table 84: Global Hazmat Suits Industry Volume K Units Forecast, by End-User 2019 & 2032
- Table 85: Global Hazmat Suits Industry Revenue Million Forecast, by Country 2019 & 2032
- Table 86: Global Hazmat Suits Industry Volume K Units Forecast, by Country 2019 & 2032
- Table 87: Germany Hazmat Suits Industry Revenue (Million) Forecast, by Application 2019 & 2032
- Table 88: Germany Hazmat Suits Industry Volume (K Units) Forecast, by Application 2019 & 2032
- Table 89: United Kingdom Hazmat Suits Industry Revenue (Million) Forecast, by Application 2019 & 2032
- Table 90: United Kingdom Hazmat Suits Industry Volume (K Units) Forecast, by Application 2019 & 2032
- Table 91: France Hazmat Suits Industry Revenue (Million) Forecast, by Application 2019 & 2032
- Table 92: France Hazmat Suits Industry Volume (K Units) Forecast, by Application 2019 & 2032
- Table 93: Italy Hazmat Suits Industry Revenue (Million) Forecast, by Application 2019 & 2032
- Table 94: Italy Hazmat Suits Industry Volume (K Units) Forecast, by Application 2019 & 2032
- Table 95: Spain Hazmat Suits Industry Revenue (Million) Forecast, by Application 2019 & 2032
- Table 96: Spain Hazmat Suits Industry Volume (K Units) Forecast, by Application 2019 & 2032
- Table 97: Rest of Europe Hazmat Suits Industry Revenue (Million) Forecast, by Application 2019 & 2032
- Table 98: Rest of Europe Hazmat Suits Industry Volume (K Units) Forecast, by Application 2019 & 2032
- Table 99: Global Hazmat Suits Industry Revenue Million Forecast, by Type 2019 & 2032
- Table 100: Global Hazmat Suits Industry Volume K Units Forecast, by Type 2019 & 2032
- Table 101: Global Hazmat Suits Industry Revenue Million Forecast, by Application 2019 & 2032
- Table 102: Global Hazmat Suits Industry Volume K Units Forecast, by Application 2019 & 2032
- Table 103: Global Hazmat Suits Industry Revenue Million Forecast, by End-User 2019 & 2032
- Table 104: Global Hazmat Suits Industry Volume K Units Forecast, by End-User 2019 & 2032
- Table 105: Global Hazmat Suits Industry Revenue Million Forecast, by Country 2019 & 2032
- Table 106: Global Hazmat Suits Industry Volume K Units Forecast, by Country 2019 & 2032
- Table 107: China Hazmat Suits Industry Revenue (Million) Forecast, by Application 2019 & 2032
- Table 108: China Hazmat Suits Industry Volume (K Units) Forecast, by Application 2019 & 2032
- Table 109: Japan Hazmat Suits Industry Revenue (Million) Forecast, by Application 2019 & 2032
- Table 110: Japan Hazmat Suits Industry Volume (K Units) Forecast, by Application 2019 & 2032
- Table 111: India Hazmat Suits Industry Revenue (Million) Forecast, by Application 2019 & 2032
- Table 112: India Hazmat Suits Industry Volume (K Units) Forecast, by Application 2019 & 2032
- Table 113: Australia Hazmat Suits Industry Revenue (Million) Forecast, by Application 2019 & 2032
- Table 114: Australia Hazmat Suits Industry Volume (K Units) Forecast, by Application 2019 & 2032
- Table 115: South Korea Hazmat Suits Industry Revenue (Million) Forecast, by Application 2019 & 2032
- Table 116: South Korea Hazmat Suits Industry Volume (K Units) Forecast, by Application 2019 & 2032
- Table 117: Rest of Asia Pacific Hazmat Suits Industry Revenue (Million) Forecast, by Application 2019 & 2032
- Table 118: Rest of Asia Pacific Hazmat Suits Industry Volume (K Units) Forecast, by Application 2019 & 2032
- Table 119: Global Hazmat Suits Industry Revenue Million Forecast, by Type 2019 & 2032
- Table 120: Global Hazmat Suits Industry Volume K Units Forecast, by Type 2019 & 2032
- Table 121: Global Hazmat Suits Industry Revenue Million Forecast, by Application 2019 & 2032
- Table 122: Global Hazmat Suits Industry Volume K Units Forecast, by Application 2019 & 2032
- Table 123: Global Hazmat Suits Industry Revenue Million Forecast, by End-User 2019 & 2032
- Table 124: Global Hazmat Suits Industry Volume K Units Forecast, by End-User 2019 & 2032
- Table 125: Global Hazmat Suits Industry Revenue Million Forecast, by Country 2019 & 2032
- Table 126: Global Hazmat Suits Industry Volume K Units Forecast, by Country 2019 & 2032
- Table 127: GCC Hazmat Suits Industry Revenue (Million) Forecast, by Application 2019 & 2032
- Table 128: GCC Hazmat Suits Industry Volume (K Units) Forecast, by Application 2019 & 2032
- Table 129: South Africa Hazmat Suits Industry Revenue (Million) Forecast, by Application 2019 & 2032
- Table 130: South Africa Hazmat Suits Industry Volume (K Units) Forecast, by Application 2019 & 2032
- Table 131: Rest of Middle East and Africa Hazmat Suits Industry Revenue (Million) Forecast, by Application 2019 & 2032
- Table 132: Rest of Middle East and Africa Hazmat Suits Industry Volume (K Units) Forecast, by Application 2019 & 2032
- Table 133: Global Hazmat Suits Industry Revenue Million Forecast, by Type 2019 & 2032
- Table 134: Global Hazmat Suits Industry Volume K Units Forecast, by Type 2019 & 2032
- Table 135: Global Hazmat Suits Industry Revenue Million Forecast, by Application 2019 & 2032
- Table 136: Global Hazmat Suits Industry Volume K Units Forecast, by Application 2019 & 2032
- Table 137: Global Hazmat Suits Industry Revenue Million Forecast, by End-User 2019 & 2032
- Table 138: Global Hazmat Suits Industry Volume K Units Forecast, by End-User 2019 & 2032
- Table 139: Global Hazmat Suits Industry Revenue Million Forecast, by Country 2019 & 2032
- Table 140: Global Hazmat Suits Industry Volume K Units Forecast, by Country 2019 & 2032
- Table 141: Brazil Hazmat Suits Industry Revenue (Million) Forecast, by Application 2019 & 2032
- Table 142: Brazil Hazmat Suits Industry Volume (K Units) Forecast, by Application 2019 & 2032
- Table 143: Argentina Hazmat Suits Industry Revenue (Million) Forecast, by Application 2019 & 2032
- Table 144: Argentina Hazmat Suits Industry Volume (K Units) Forecast, by Application 2019 & 2032
- Table 145: Rest of South America Hazmat Suits Industry Revenue (Million) Forecast, by Application 2019 & 2032
- Table 146: Rest of South America Hazmat Suits Industry Volume (K Units) Forecast, by Application 2019 & 2032
Frequently Asked Questions
1. What is the projected Compound Annual Growth Rate (CAGR) of the Hazmat Suits Industry?
The projected CAGR is approximately 7.55%.
2. Which companies are prominent players in the Hazmat Suits Industry?
Key companies in the market include Kimberly-Clark Worldwide Inc, 3M, Kappler, Halyard Health Inc, DuPont, Dragerwerk AG & Co KGaA, ANSELL LTD, DGD HAZMAT, Lakeland Inc, MATISEC, Respirex, Lancs Industries.
3. What are the main segments of the Hazmat Suits Industry?
The market segments include Type, Application, End-User.
4. Can you provide details about the market size?
The market size is estimated to be USD 10.1 Million as of 2022.
5. What are some drivers contributing to market growth?
Governments and regulatory bodies are implementing stricter safety standards regarding hazardous materials handling. driving demand for effective protective equipment. including hazmat suits.
6. What are the notable trends driving market growth?
Ongoing research and innovation in materials science are leading to the development of lighter. more breathable. and more protective hazmat suits that enhance wearer comfort and safety.
7. Are there any restraints impacting market growth?
The prevalence of counterfeit and substandard protective gear in the market poses significant risks to users and can undermine the integrity of the industry.
8. Can you provide examples of recent developments in the market?
July 2022: MBO Group, a Guangdong-based Chinese company, developed a wearable air-conditioning system tailored for hazmat-suited COVID-19 workers as daily testing became the new normal for millions nationwide. The wearable device weighed 3 kilograms and included an air conditioning system and a cooling vest. It had a temperature adjustment range of 16 to 25 degrees Celsius and can run for three hours after fully charging.
9. What pricing options are available for accessing the report?
Pricing options include single-user, multi-user, and enterprise licenses priced at USD 4750, USD 5250, and USD 8750 respectively.
10. Is the market size provided in terms of value or volume?
The market size is provided in terms of value, measured in Million and volume, measured in K Units.
11. Are there any specific market keywords associated with the report?
Yes, the market keyword associated with the report is "Hazmat Suits Industry," which aids in identifying and referencing the specific market segment covered.
12. How do I determine which pricing option suits my needs best?
The pricing options vary based on user requirements and access needs. Individual users may opt for single-user licenses, while businesses requiring broader access may choose multi-user or enterprise licenses for cost-effective access to the report.
13. Are there any additional resources or data provided in the Hazmat Suits Industry report?
While the report offers comprehensive insights, it's advisable to review the specific contents or supplementary materials provided to ascertain if additional resources or data are available.
14. How can I stay updated on further developments or reports in the Hazmat Suits Industry?
To stay informed about further developments, trends, and reports in the Hazmat Suits Industry, consider subscribing to industry newsletters, following relevant companies and organizations, or regularly checking reputable industry news sources and publications.
Methodology
Step 1 - Identification of Relevant Samples Size from Population Database


Step 2 - Approaches for Defining Global Market Size (Value, Volume* & Price*)

Note*: In applicable scenarios
Step 3 - Data Sources
Primary Research
- Web Analytics
- Survey Reports
- Research Institute
- Latest Research Reports
- Opinion Leaders
Secondary Research
- Annual Reports
- White Paper
- Latest Press Release
- Industry Association
- Paid Database
- Investor Presentations

Step 4 - Data Triangulation
Involves using different sources of information in order to increase the validity of a study
These sources are likely to be stakeholders in a program - participants, other researchers, program staff, other community members, and so on.
Then we put all data in single framework & apply various statistical tools to find out the dynamic on the market.
During the analysis stage, feedback from the stakeholder groups would be compared to determine areas of agreement as well as areas of divergence


