
Key Insights
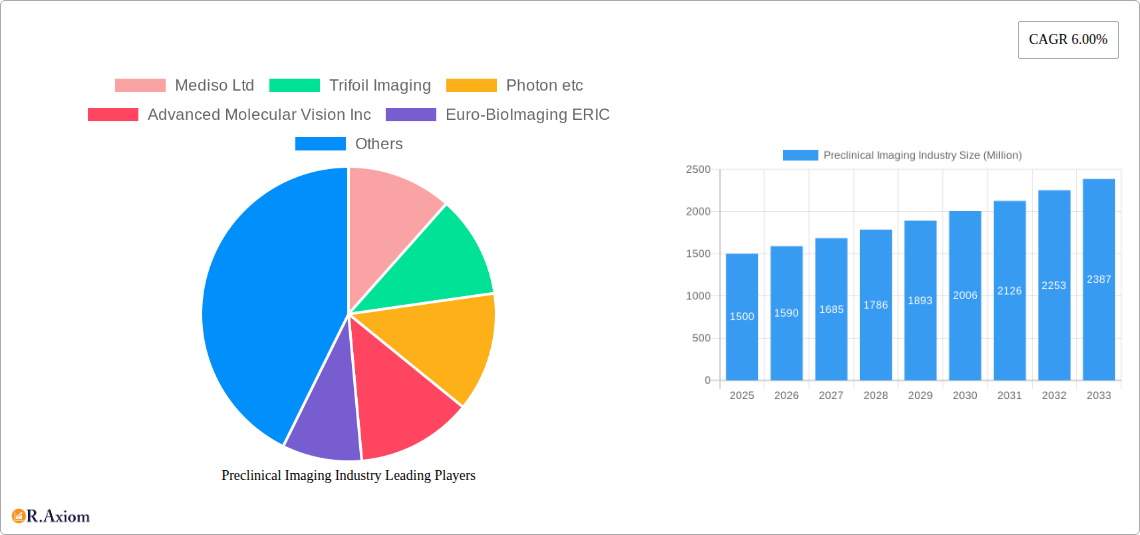
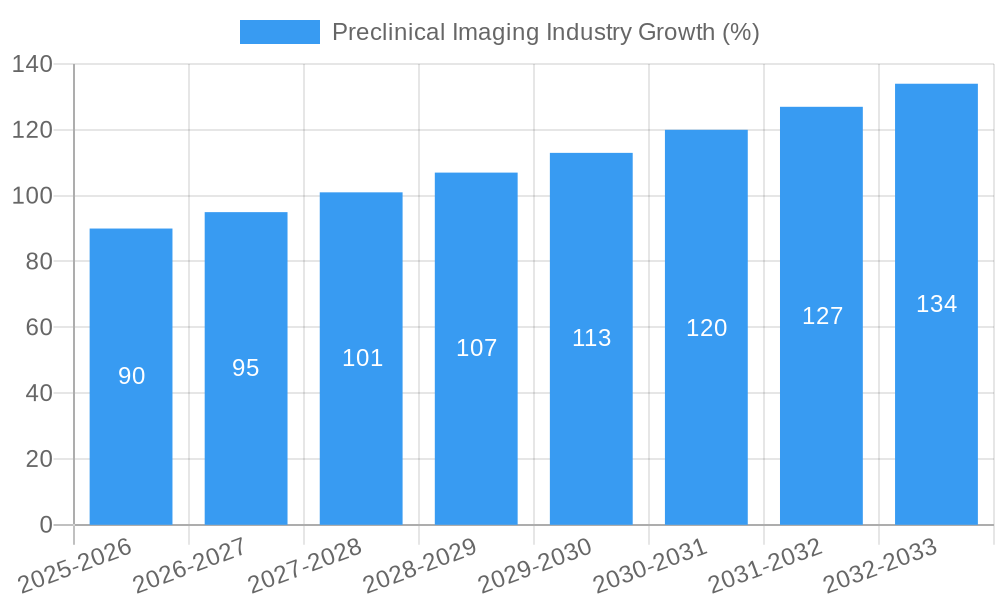
The preclinical imaging market, valued at approximately $1.5 billion in 2025, is projected to experience robust growth, driven by a compound annual growth rate (CAGR) of 6% from 2025 to 2033. This expansion is fueled by several key factors. The increasing demand for improved drug discovery and development processes is a major driver, as preclinical imaging provides crucial insights into the efficacy and safety of new therapies before human trials. Technological advancements in various imaging modalities, such as micro-CT, optical imaging systems, and photoacoustic imaging, are enhancing image resolution, sensitivity, and functional capabilities, further boosting market growth. Furthermore, the rising prevalence of chronic diseases necessitates the development of more effective treatments, stimulating the demand for preclinical imaging techniques for early disease detection and therapeutic monitoring. Increased research funding allocated to biomedical research and drug development globally also contributes significantly to market expansion. However, the high cost of advanced preclinical imaging systems and the need for specialized expertise in operating and interpreting the data pose significant challenges to market growth.
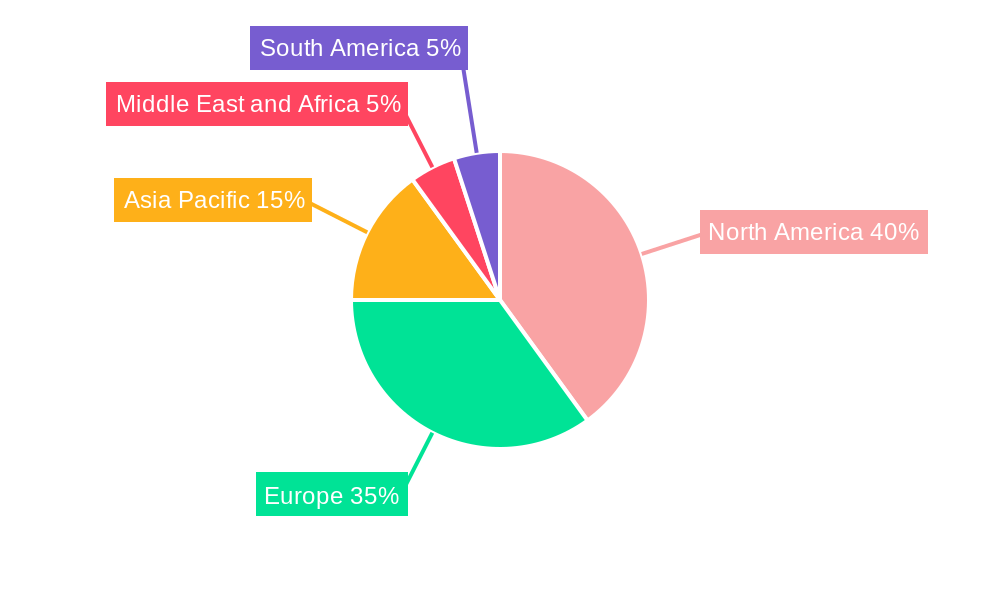
Segment-wise, optical imaging systems and micro-CT currently hold substantial market share due to their wide applications and relatively lower cost compared to other advanced modalities like micro-MRI. However, the micro-MRI segment is projected to witness significant growth owing to its superior soft tissue contrast and functional imaging capabilities. Geographically, North America and Europe currently dominate the market, driven by well-established research infrastructure and high adoption rates. However, the Asia-Pacific region is expected to experience the fastest growth rate in the forecast period, fueled by increasing research activities and government investments in healthcare infrastructure. Key players like Bruker Corporation, PerkinElmer Inc., and Mediso Ltd. are driving innovation through strategic partnerships, acquisitions, and the introduction of advanced systems, further shaping the competitive landscape of this dynamic market.
Preclinical Imaging Industry Market Report: 2019-2033
This comprehensive report provides a detailed analysis of the preclinical imaging industry, encompassing market size, segmentation, growth drivers, challenges, and key players. The study period covers 2019-2033, with 2025 as the base and estimated year, and a forecast period of 2025-2033. The historical period analyzed is 2019-2024. The report offers actionable insights for industry stakeholders, investors, and researchers seeking a deep understanding of this dynamic market. Expected market value in 2025 is estimated at $XX Million.
Preclinical Imaging Industry Market Concentration & Innovation
The preclinical imaging market exhibits a moderately concentrated landscape, with several key players holding significant market share. Bruker Corporation, PerkinElmer Inc., and Fujifilm Holdings Corporation are among the dominant players, collectively accounting for an estimated xx% of the global market in 2025. However, the market also features numerous smaller companies specializing in niche technologies or modalities. Innovation is a key driver, fueled by advancements in imaging technologies, increasing demand for higher resolution and sensitivity, and the need for non-invasive imaging techniques. The regulatory landscape plays a significant role, with agencies like the FDA influencing product approvals and safety standards. Substitutes, such as traditional histology and pathology methods, exist, but preclinical imaging offers advantages in terms of speed, non-invasiveness, and quantitative data acquisition. End-user trends, particularly towards higher throughput and automation, are shaping market demands. M&A activity in the sector has been moderate, with deal values ranging from $xx Million to $xx Million in recent years, reflecting a strategy of consolidation and expansion of capabilities.
- Market Share: Bruker: xx%, PerkinElmer: xx%, Fujifilm: xx%, Others: xx% (2025 estimates)
- M&A Activity: An average of xx M&A deals per year with an average deal value of $xx Million (2019-2024)
Preclinical Imaging Industry Industry Trends & Insights
The preclinical imaging market is experiencing robust growth, driven by factors such as the rising prevalence of chronic diseases, increased demand for personalized medicine, and advancements in imaging technologies. The compound annual growth rate (CAGR) is projected to be xx% during the forecast period (2025-2033). This growth is propelled by technological innovations, including the development of higher-resolution imaging systems, advanced image analysis software, and the integration of artificial intelligence (AI) for improved diagnostic accuracy. Consumer preferences are shifting towards minimally invasive and higher throughput systems. The market displays strong competitive dynamics, with companies focusing on product differentiation, strategic partnerships, and technological innovation to gain market share. Market penetration of advanced imaging modalities like photoacoustic imaging is expected to increase from xx% in 2025 to xx% by 2033.
Dominant Markets & Segments in Preclinical Imaging Industry
The North American region currently dominates the preclinical imaging market, driven by robust R&D investment, presence of major players, and well-established healthcare infrastructure. However, the Asia-Pacific region is exhibiting rapid growth due to increasing healthcare spending and expanding research activities. Within modalities, micro-CT and optical imaging systems currently hold the largest market share.
- Key Drivers for North America: Strong R&D investment, high adoption of advanced technologies, well-developed healthcare infrastructure.
- Key Drivers for Asia-Pacific: Increasing healthcare spending, growing research activities, rising prevalence of chronic diseases.
- Dominant Modalities: Micro-CT (largest market share), Optical Imaging Systems (second largest), driven by versatility and high resolution.
Preclinical Imaging Industry Product Developments
Recent years have witnessed significant product innovations, with a focus on enhancing image resolution, sensitivity, and throughput. The introduction of new contrast agents, improved detectors, and advanced algorithms has broadened the applications of preclinical imaging across diverse research areas, including oncology, cardiology, and neuroscience. Companies are increasingly focusing on integrating multiple modalities to provide comprehensive imaging solutions. This trend ensures better market fit by addressing diverse research needs and providing more holistic data for improved disease understanding.
Report Scope & Segmentation Analysis
This report segments the preclinical imaging market by modality: Optical Imaging Systems, Nuclear Imaging Systems, Micro-MRI, Micro-ultrasound, Micro-CT, Photoacoustic Imaging Systems, and Other Modality. Each segment is analyzed based on market size, growth projections, and competitive dynamics.
- Optical Imaging Systems: This segment is expected to witness significant growth due to its versatility and non-invasive nature. Market size in 2025 is estimated at $xx Million, expected to reach $xx Million by 2033.
- Nuclear Imaging Systems: This segment is characterized by high sensitivity but limited spatial resolution. The market is expected to grow moderately due to increased use in specific applications. Market size in 2025 is estimated at $xx Million.
- Micro-MRI: This segment is experiencing growth driven by advancements in magnet technology and image processing. Market size in 2025 is estimated at $xx Million.
- Micro-ultrasound: The market for micro-ultrasound systems is expected to grow steadily, driven by increasing applications in cardiovascular research. Market size in 2025 is estimated at $xx Million.
- Micro-CT: This segment is the largest, driven by its high resolution and versatility. Market size in 2025 is estimated at $xx Million.
- Photoacoustic Imaging Systems: This segment is characterized by high spatial resolution and deep tissue penetration. Growth is expected to be driven by technological advancements. Market size in 2025 is estimated at $xx Million.
- Other Modality: This segment encompasses other less common modalities.
Key Drivers of Preclinical Imaging Industry Growth
Several factors contribute to the growth of the preclinical imaging market. Advancements in imaging technologies, such as higher resolution, improved sensitivity, and faster acquisition times, are major drivers. The increasing demand for personalized medicine and the growing need for effective drug discovery and development further fuel market expansion. Favorable regulatory frameworks and increasing research funding also play a significant role.
Challenges in the Preclinical Imaging Industry Sector
The preclinical imaging industry faces challenges such as high equipment costs, the need for specialized technical expertise, and regulatory hurdles related to approval of new imaging agents. Supply chain disruptions and intense competition among established players and emerging companies also pose significant challenges. These factors can impact market growth and profitability.
Emerging Opportunities in Preclinical Imaging Industry
Emerging opportunities include the integration of AI and machine learning for improved image analysis, the development of novel contrast agents, and the expansion of applications into new therapeutic areas. The adoption of cloud-based solutions for data storage and analysis and the development of portable and more affordable imaging systems also present substantial opportunities.
Leading Players in the Preclinical Imaging Industry Market
- Mediso Ltd
- Trifoil Imaging
- Photon etc
- Advanced Molecular Vision Inc
- Euro-BioImaging ERIC
- MR Solutions Ltd
- Aspect Imaging Ltd
- PerkinElmer Inc
- IVIM Technology Corp
- Bruker Corporation
- AXT PTY LTD
- United Imaging Healthcare Co Ltd
- Fujifilm Holdings Corporation
Key Developments in Preclinical Imaging Industry Industry
- May 2022: Bruker launched innovative 7 Tesla and 9.4 Tesla conduction-cooled Maxwell magnets for its preclinical MRI systems, enhancing resolution and capabilities.
- April 2022: PerkinElmer expanded its in vivo imaging portfolio with the Vega imaging system, a high-throughput ultrasound platform accelerating drug development studies.
Strategic Outlook for Preclinical Imaging Industry Market
The preclinical imaging market is poised for sustained growth, driven by technological advancements, expanding research activities, and increasing demand for efficient drug development. The integration of AI, development of novel imaging agents, and expansion into new therapeutic areas present significant opportunities for market players. Companies focusing on innovation, strategic partnerships, and efficient manufacturing will be best positioned for success in this dynamic market.
Preclinical Imaging Industry Segmentation
-
1. Modality
- 1.1. Optical Imaging Systems
- 1.2. Nuclear Imaging Systems
- 1.3. Micro-MRI
- 1.4. Micro-ultrasound
- 1.5. Micro-CT
- 1.6. Photoacoustic Imaging Systems
- 1.7. Other Modality
Preclinical Imaging Industry Segmentation By Geography
-
1. North America
- 1.1. United States
- 1.2. Canada
- 1.3. Mexico
-
2. Europe
- 2.1. Germany
- 2.2. United Kingdom
- 2.3. France
- 2.4. Italy
- 2.5. Spain
- 2.6. Rest of Europe
-
3. Asia Pacific
- 3.1. China
- 3.2. Japan
- 3.3. India
- 3.4. Australia
- 3.5. South Korea
- 3.6. Rest of Asia Pacific
-
4. Middle East and Africa
- 4.1. GCC
- 4.2. South Africa
- 4.3. Rest of Middle East and Africa
-
5. South America
- 5.1. Brazil
- 5.2. Argentina
- 5.3. Rest of South America
Preclinical Imaging Industry REPORT HIGHLIGHTS
| Aspects | Details |
|---|---|
| Study Period | 2019-2033 |
| Base Year | 2024 |
| Estimated Year | 2025 |
| Forecast Period | 2025-2033 |
| Historical Period | 2019-2024 |
| Growth Rate | CAGR of 6.00% from 2019-2033 |
| Segmentation |
|
Table of Contents
- 1. Introduction
- 1.1. Research Scope
- 1.2. Market Segmentation
- 1.3. Research Methodology
- 1.4. Definitions and Assumptions
- 2. Executive Summary
- 2.1. Introduction
- 3. Market Dynamics
- 3.1. Introduction
- 3.2. Market Drivers
- 3.2.1 Technological Advancements in Molecular Imaging; Increasing Demand for Non-invasive Small Animal Imaging Techniques; Increase in Preclinical Research Funding
- 3.2.2 by Both Private and Public Organizations
- 3.3. Market Restrains
- 3.3.1. Strict Regulations in Preclinical Research; High Installation and Operational Costs associated with Preclinical Imaging Modalities
- 3.4. Market Trends
- 3.4.1. Micro-Ultrasound is the Segment by Modality and is Expected to be the Fastest Growing Market
- 4. Market Factor Analysis
- 4.1. Porters Five Forces
- 4.2. Supply/Value Chain
- 4.3. PESTEL analysis
- 4.4. Market Entropy
- 4.5. Patent/Trademark Analysis
- 5. Global Preclinical Imaging Industry Analysis, Insights and Forecast, 2019-2031
- 5.1. Market Analysis, Insights and Forecast - by Modality
- 5.1.1. Optical Imaging Systems
- 5.1.2. Nuclear Imaging Systems
- 5.1.3. Micro-MRI
- 5.1.4. Micro-ultrasound
- 5.1.5. Micro-CT
- 5.1.6. Photoacoustic Imaging Systems
- 5.1.7. Other Modality
- 5.2. Market Analysis, Insights and Forecast - by Region
- 5.2.1. North America
- 5.2.2. Europe
- 5.2.3. Asia Pacific
- 5.2.4. Middle East and Africa
- 5.2.5. South America
- 5.1. Market Analysis, Insights and Forecast - by Modality
- 6. North America Preclinical Imaging Industry Analysis, Insights and Forecast, 2019-2031
- 6.1. Market Analysis, Insights and Forecast - by Modality
- 6.1.1. Optical Imaging Systems
- 6.1.2. Nuclear Imaging Systems
- 6.1.3. Micro-MRI
- 6.1.4. Micro-ultrasound
- 6.1.5. Micro-CT
- 6.1.6. Photoacoustic Imaging Systems
- 6.1.7. Other Modality
- 6.1. Market Analysis, Insights and Forecast - by Modality
- 7. Europe Preclinical Imaging Industry Analysis, Insights and Forecast, 2019-2031
- 7.1. Market Analysis, Insights and Forecast - by Modality
- 7.1.1. Optical Imaging Systems
- 7.1.2. Nuclear Imaging Systems
- 7.1.3. Micro-MRI
- 7.1.4. Micro-ultrasound
- 7.1.5. Micro-CT
- 7.1.6. Photoacoustic Imaging Systems
- 7.1.7. Other Modality
- 7.1. Market Analysis, Insights and Forecast - by Modality
- 8. Asia Pacific Preclinical Imaging Industry Analysis, Insights and Forecast, 2019-2031
- 8.1. Market Analysis, Insights and Forecast - by Modality
- 8.1.1. Optical Imaging Systems
- 8.1.2. Nuclear Imaging Systems
- 8.1.3. Micro-MRI
- 8.1.4. Micro-ultrasound
- 8.1.5. Micro-CT
- 8.1.6. Photoacoustic Imaging Systems
- 8.1.7. Other Modality
- 8.1. Market Analysis, Insights and Forecast - by Modality
- 9. Middle East and Africa Preclinical Imaging Industry Analysis, Insights and Forecast, 2019-2031
- 9.1. Market Analysis, Insights and Forecast - by Modality
- 9.1.1. Optical Imaging Systems
- 9.1.2. Nuclear Imaging Systems
- 9.1.3. Micro-MRI
- 9.1.4. Micro-ultrasound
- 9.1.5. Micro-CT
- 9.1.6. Photoacoustic Imaging Systems
- 9.1.7. Other Modality
- 9.1. Market Analysis, Insights and Forecast - by Modality
- 10. South America Preclinical Imaging Industry Analysis, Insights and Forecast, 2019-2031
- 10.1. Market Analysis, Insights and Forecast - by Modality
- 10.1.1. Optical Imaging Systems
- 10.1.2. Nuclear Imaging Systems
- 10.1.3. Micro-MRI
- 10.1.4. Micro-ultrasound
- 10.1.5. Micro-CT
- 10.1.6. Photoacoustic Imaging Systems
- 10.1.7. Other Modality
- 10.1. Market Analysis, Insights and Forecast - by Modality
- 11. North America Preclinical Imaging Industry Analysis, Insights and Forecast, 2019-2031
- 11.1. Market Analysis, Insights and Forecast - By Country/Sub-region
- 11.1.1. undefined
- 12. Europe Preclinical Imaging Industry Analysis, Insights and Forecast, 2019-2031
- 12.1. Market Analysis, Insights and Forecast - By Country/Sub-region
- 12.1.1. undefined
- 13. Asia Pacific Preclinical Imaging Industry Analysis, Insights and Forecast, 2019-2031
- 13.1. Market Analysis, Insights and Forecast - By Country/Sub-region
- 13.1.1. undefined
- 14. Middle East and Africa Preclinical Imaging Industry Analysis, Insights and Forecast, 2019-2031
- 14.1. Market Analysis, Insights and Forecast - By Country/Sub-region
- 14.1.1. undefined
- 15. South America Preclinical Imaging Industry Analysis, Insights and Forecast, 2019-2031
- 15.1. Market Analysis, Insights and Forecast - By Country/Sub-region
- 15.1.1. undefined
- 16. Competitive Analysis
- 16.1. Global Market Share Analysis 2024
- 16.2. Company Profiles
- 16.2.1 Mediso Ltd
- 16.2.1.1. Overview
- 16.2.1.2. Products
- 16.2.1.3. SWOT Analysis
- 16.2.1.4. Recent Developments
- 16.2.1.5. Financials (Based on Availability)
- 16.2.2 Trifoil Imaging
- 16.2.2.1. Overview
- 16.2.2.2. Products
- 16.2.2.3. SWOT Analysis
- 16.2.2.4. Recent Developments
- 16.2.2.5. Financials (Based on Availability)
- 16.2.3 Photon etc
- 16.2.3.1. Overview
- 16.2.3.2. Products
- 16.2.3.3. SWOT Analysis
- 16.2.3.4. Recent Developments
- 16.2.3.5. Financials (Based on Availability)
- 16.2.4 Advanced Molecular Vision Inc
- 16.2.4.1. Overview
- 16.2.4.2. Products
- 16.2.4.3. SWOT Analysis
- 16.2.4.4. Recent Developments
- 16.2.4.5. Financials (Based on Availability)
- 16.2.5 Euro-BioImaging ERIC
- 16.2.5.1. Overview
- 16.2.5.2. Products
- 16.2.5.3. SWOT Analysis
- 16.2.5.4. Recent Developments
- 16.2.5.5. Financials (Based on Availability)
- 16.2.6 MR Solutions Ltd
- 16.2.6.1. Overview
- 16.2.6.2. Products
- 16.2.6.3. SWOT Analysis
- 16.2.6.4. Recent Developments
- 16.2.6.5. Financials (Based on Availability)
- 16.2.7 Aspect Imaging Ltd
- 16.2.7.1. Overview
- 16.2.7.2. Products
- 16.2.7.3. SWOT Analysis
- 16.2.7.4. Recent Developments
- 16.2.7.5. Financials (Based on Availability)
- 16.2.8 PerkinElmer Inc
- 16.2.8.1. Overview
- 16.2.8.2. Products
- 16.2.8.3. SWOT Analysis
- 16.2.8.4. Recent Developments
- 16.2.8.5. Financials (Based on Availability)
- 16.2.9 IVIM Technology Corp
- 16.2.9.1. Overview
- 16.2.9.2. Products
- 16.2.9.3. SWOT Analysis
- 16.2.9.4. Recent Developments
- 16.2.9.5. Financials (Based on Availability)
- 16.2.10 Bruker Corporation
- 16.2.10.1. Overview
- 16.2.10.2. Products
- 16.2.10.3. SWOT Analysis
- 16.2.10.4. Recent Developments
- 16.2.10.5. Financials (Based on Availability)
- 16.2.11 AXT PTY LTD
- 16.2.11.1. Overview
- 16.2.11.2. Products
- 16.2.11.3. SWOT Analysis
- 16.2.11.4. Recent Developments
- 16.2.11.5. Financials (Based on Availability)
- 16.2.12 United Imaging Healthcare Co Ltd
- 16.2.12.1. Overview
- 16.2.12.2. Products
- 16.2.12.3. SWOT Analysis
- 16.2.12.4. Recent Developments
- 16.2.12.5. Financials (Based on Availability)
- 16.2.13 Fujifilm Holdings Corporation
- 16.2.13.1. Overview
- 16.2.13.2. Products
- 16.2.13.3. SWOT Analysis
- 16.2.13.4. Recent Developments
- 16.2.13.5. Financials (Based on Availability)
- 16.2.1 Mediso Ltd
List of Figures
- Figure 1: Global Preclinical Imaging Industry Revenue Breakdown (Million, %) by Region 2024 & 2032
- Figure 2: Global Preclinical Imaging Industry Volume Breakdown (K Unit, %) by Region 2024 & 2032
- Figure 3: North America Preclinical Imaging Industry Revenue (Million), by Country 2024 & 2032
- Figure 4: North America Preclinical Imaging Industry Volume (K Unit), by Country 2024 & 2032
- Figure 5: North America Preclinical Imaging Industry Revenue Share (%), by Country 2024 & 2032
- Figure 6: North America Preclinical Imaging Industry Volume Share (%), by Country 2024 & 2032
- Figure 7: Europe Preclinical Imaging Industry Revenue (Million), by Country 2024 & 2032
- Figure 8: Europe Preclinical Imaging Industry Volume (K Unit), by Country 2024 & 2032
- Figure 9: Europe Preclinical Imaging Industry Revenue Share (%), by Country 2024 & 2032
- Figure 10: Europe Preclinical Imaging Industry Volume Share (%), by Country 2024 & 2032
- Figure 11: Asia Pacific Preclinical Imaging Industry Revenue (Million), by Country 2024 & 2032
- Figure 12: Asia Pacific Preclinical Imaging Industry Volume (K Unit), by Country 2024 & 2032
- Figure 13: Asia Pacific Preclinical Imaging Industry Revenue Share (%), by Country 2024 & 2032
- Figure 14: Asia Pacific Preclinical Imaging Industry Volume Share (%), by Country 2024 & 2032
- Figure 15: Middle East and Africa Preclinical Imaging Industry Revenue (Million), by Country 2024 & 2032
- Figure 16: Middle East and Africa Preclinical Imaging Industry Volume (K Unit), by Country 2024 & 2032
- Figure 17: Middle East and Africa Preclinical Imaging Industry Revenue Share (%), by Country 2024 & 2032
- Figure 18: Middle East and Africa Preclinical Imaging Industry Volume Share (%), by Country 2024 & 2032
- Figure 19: South America Preclinical Imaging Industry Revenue (Million), by Country 2024 & 2032
- Figure 20: South America Preclinical Imaging Industry Volume (K Unit), by Country 2024 & 2032
- Figure 21: South America Preclinical Imaging Industry Revenue Share (%), by Country 2024 & 2032
- Figure 22: South America Preclinical Imaging Industry Volume Share (%), by Country 2024 & 2032
- Figure 23: North America Preclinical Imaging Industry Revenue (Million), by Modality 2024 & 2032
- Figure 24: North America Preclinical Imaging Industry Volume (K Unit), by Modality 2024 & 2032
- Figure 25: North America Preclinical Imaging Industry Revenue Share (%), by Modality 2024 & 2032
- Figure 26: North America Preclinical Imaging Industry Volume Share (%), by Modality 2024 & 2032
- Figure 27: North America Preclinical Imaging Industry Revenue (Million), by Country 2024 & 2032
- Figure 28: North America Preclinical Imaging Industry Volume (K Unit), by Country 2024 & 2032
- Figure 29: North America Preclinical Imaging Industry Revenue Share (%), by Country 2024 & 2032
- Figure 30: North America Preclinical Imaging Industry Volume Share (%), by Country 2024 & 2032
- Figure 31: Europe Preclinical Imaging Industry Revenue (Million), by Modality 2024 & 2032
- Figure 32: Europe Preclinical Imaging Industry Volume (K Unit), by Modality 2024 & 2032
- Figure 33: Europe Preclinical Imaging Industry Revenue Share (%), by Modality 2024 & 2032
- Figure 34: Europe Preclinical Imaging Industry Volume Share (%), by Modality 2024 & 2032
- Figure 35: Europe Preclinical Imaging Industry Revenue (Million), by Country 2024 & 2032
- Figure 36: Europe Preclinical Imaging Industry Volume (K Unit), by Country 2024 & 2032
- Figure 37: Europe Preclinical Imaging Industry Revenue Share (%), by Country 2024 & 2032
- Figure 38: Europe Preclinical Imaging Industry Volume Share (%), by Country 2024 & 2032
- Figure 39: Asia Pacific Preclinical Imaging Industry Revenue (Million), by Modality 2024 & 2032
- Figure 40: Asia Pacific Preclinical Imaging Industry Volume (K Unit), by Modality 2024 & 2032
- Figure 41: Asia Pacific Preclinical Imaging Industry Revenue Share (%), by Modality 2024 & 2032
- Figure 42: Asia Pacific Preclinical Imaging Industry Volume Share (%), by Modality 2024 & 2032
- Figure 43: Asia Pacific Preclinical Imaging Industry Revenue (Million), by Country 2024 & 2032
- Figure 44: Asia Pacific Preclinical Imaging Industry Volume (K Unit), by Country 2024 & 2032
- Figure 45: Asia Pacific Preclinical Imaging Industry Revenue Share (%), by Country 2024 & 2032
- Figure 46: Asia Pacific Preclinical Imaging Industry Volume Share (%), by Country 2024 & 2032
- Figure 47: Middle East and Africa Preclinical Imaging Industry Revenue (Million), by Modality 2024 & 2032
- Figure 48: Middle East and Africa Preclinical Imaging Industry Volume (K Unit), by Modality 2024 & 2032
- Figure 49: Middle East and Africa Preclinical Imaging Industry Revenue Share (%), by Modality 2024 & 2032
- Figure 50: Middle East and Africa Preclinical Imaging Industry Volume Share (%), by Modality 2024 & 2032
- Figure 51: Middle East and Africa Preclinical Imaging Industry Revenue (Million), by Country 2024 & 2032
- Figure 52: Middle East and Africa Preclinical Imaging Industry Volume (K Unit), by Country 2024 & 2032
- Figure 53: Middle East and Africa Preclinical Imaging Industry Revenue Share (%), by Country 2024 & 2032
- Figure 54: Middle East and Africa Preclinical Imaging Industry Volume Share (%), by Country 2024 & 2032
- Figure 55: South America Preclinical Imaging Industry Revenue (Million), by Modality 2024 & 2032
- Figure 56: South America Preclinical Imaging Industry Volume (K Unit), by Modality 2024 & 2032
- Figure 57: South America Preclinical Imaging Industry Revenue Share (%), by Modality 2024 & 2032
- Figure 58: South America Preclinical Imaging Industry Volume Share (%), by Modality 2024 & 2032
- Figure 59: South America Preclinical Imaging Industry Revenue (Million), by Country 2024 & 2032
- Figure 60: South America Preclinical Imaging Industry Volume (K Unit), by Country 2024 & 2032
- Figure 61: South America Preclinical Imaging Industry Revenue Share (%), by Country 2024 & 2032
- Figure 62: South America Preclinical Imaging Industry Volume Share (%), by Country 2024 & 2032
List of Tables
- Table 1: Global Preclinical Imaging Industry Revenue Million Forecast, by Region 2019 & 2032
- Table 2: Global Preclinical Imaging Industry Volume K Unit Forecast, by Region 2019 & 2032
- Table 3: Global Preclinical Imaging Industry Revenue Million Forecast, by Modality 2019 & 2032
- Table 4: Global Preclinical Imaging Industry Volume K Unit Forecast, by Modality 2019 & 2032
- Table 5: Global Preclinical Imaging Industry Revenue Million Forecast, by Region 2019 & 2032
- Table 6: Global Preclinical Imaging Industry Volume K Unit Forecast, by Region 2019 & 2032
- Table 7: Global Preclinical Imaging Industry Revenue Million Forecast, by Country 2019 & 2032
- Table 8: Global Preclinical Imaging Industry Volume K Unit Forecast, by Country 2019 & 2032
- Table 9: Global Preclinical Imaging Industry Revenue Million Forecast, by Country 2019 & 2032
- Table 10: Global Preclinical Imaging Industry Volume K Unit Forecast, by Country 2019 & 2032
- Table 11: Global Preclinical Imaging Industry Revenue Million Forecast, by Country 2019 & 2032
- Table 12: Global Preclinical Imaging Industry Volume K Unit Forecast, by Country 2019 & 2032
- Table 13: Global Preclinical Imaging Industry Revenue Million Forecast, by Country 2019 & 2032
- Table 14: Global Preclinical Imaging Industry Volume K Unit Forecast, by Country 2019 & 2032
- Table 15: Global Preclinical Imaging Industry Revenue Million Forecast, by Country 2019 & 2032
- Table 16: Global Preclinical Imaging Industry Volume K Unit Forecast, by Country 2019 & 2032
- Table 17: Global Preclinical Imaging Industry Revenue Million Forecast, by Modality 2019 & 2032
- Table 18: Global Preclinical Imaging Industry Volume K Unit Forecast, by Modality 2019 & 2032
- Table 19: Global Preclinical Imaging Industry Revenue Million Forecast, by Country 2019 & 2032
- Table 20: Global Preclinical Imaging Industry Volume K Unit Forecast, by Country 2019 & 2032
- Table 21: United States Preclinical Imaging Industry Revenue (Million) Forecast, by Application 2019 & 2032
- Table 22: United States Preclinical Imaging Industry Volume (K Unit) Forecast, by Application 2019 & 2032
- Table 23: Canada Preclinical Imaging Industry Revenue (Million) Forecast, by Application 2019 & 2032
- Table 24: Canada Preclinical Imaging Industry Volume (K Unit) Forecast, by Application 2019 & 2032
- Table 25: Mexico Preclinical Imaging Industry Revenue (Million) Forecast, by Application 2019 & 2032
- Table 26: Mexico Preclinical Imaging Industry Volume (K Unit) Forecast, by Application 2019 & 2032
- Table 27: Global Preclinical Imaging Industry Revenue Million Forecast, by Modality 2019 & 2032
- Table 28: Global Preclinical Imaging Industry Volume K Unit Forecast, by Modality 2019 & 2032
- Table 29: Global Preclinical Imaging Industry Revenue Million Forecast, by Country 2019 & 2032
- Table 30: Global Preclinical Imaging Industry Volume K Unit Forecast, by Country 2019 & 2032
- Table 31: Germany Preclinical Imaging Industry Revenue (Million) Forecast, by Application 2019 & 2032
- Table 32: Germany Preclinical Imaging Industry Volume (K Unit) Forecast, by Application 2019 & 2032
- Table 33: United Kingdom Preclinical Imaging Industry Revenue (Million) Forecast, by Application 2019 & 2032
- Table 34: United Kingdom Preclinical Imaging Industry Volume (K Unit) Forecast, by Application 2019 & 2032
- Table 35: France Preclinical Imaging Industry Revenue (Million) Forecast, by Application 2019 & 2032
- Table 36: France Preclinical Imaging Industry Volume (K Unit) Forecast, by Application 2019 & 2032
- Table 37: Italy Preclinical Imaging Industry Revenue (Million) Forecast, by Application 2019 & 2032
- Table 38: Italy Preclinical Imaging Industry Volume (K Unit) Forecast, by Application 2019 & 2032
- Table 39: Spain Preclinical Imaging Industry Revenue (Million) Forecast, by Application 2019 & 2032
- Table 40: Spain Preclinical Imaging Industry Volume (K Unit) Forecast, by Application 2019 & 2032
- Table 41: Rest of Europe Preclinical Imaging Industry Revenue (Million) Forecast, by Application 2019 & 2032
- Table 42: Rest of Europe Preclinical Imaging Industry Volume (K Unit) Forecast, by Application 2019 & 2032
- Table 43: Global Preclinical Imaging Industry Revenue Million Forecast, by Modality 2019 & 2032
- Table 44: Global Preclinical Imaging Industry Volume K Unit Forecast, by Modality 2019 & 2032
- Table 45: Global Preclinical Imaging Industry Revenue Million Forecast, by Country 2019 & 2032
- Table 46: Global Preclinical Imaging Industry Volume K Unit Forecast, by Country 2019 & 2032
- Table 47: China Preclinical Imaging Industry Revenue (Million) Forecast, by Application 2019 & 2032
- Table 48: China Preclinical Imaging Industry Volume (K Unit) Forecast, by Application 2019 & 2032
- Table 49: Japan Preclinical Imaging Industry Revenue (Million) Forecast, by Application 2019 & 2032
- Table 50: Japan Preclinical Imaging Industry Volume (K Unit) Forecast, by Application 2019 & 2032
- Table 51: India Preclinical Imaging Industry Revenue (Million) Forecast, by Application 2019 & 2032
- Table 52: India Preclinical Imaging Industry Volume (K Unit) Forecast, by Application 2019 & 2032
- Table 53: Australia Preclinical Imaging Industry Revenue (Million) Forecast, by Application 2019 & 2032
- Table 54: Australia Preclinical Imaging Industry Volume (K Unit) Forecast, by Application 2019 & 2032
- Table 55: South Korea Preclinical Imaging Industry Revenue (Million) Forecast, by Application 2019 & 2032
- Table 56: South Korea Preclinical Imaging Industry Volume (K Unit) Forecast, by Application 2019 & 2032
- Table 57: Rest of Asia Pacific Preclinical Imaging Industry Revenue (Million) Forecast, by Application 2019 & 2032
- Table 58: Rest of Asia Pacific Preclinical Imaging Industry Volume (K Unit) Forecast, by Application 2019 & 2032
- Table 59: Global Preclinical Imaging Industry Revenue Million Forecast, by Modality 2019 & 2032
- Table 60: Global Preclinical Imaging Industry Volume K Unit Forecast, by Modality 2019 & 2032
- Table 61: Global Preclinical Imaging Industry Revenue Million Forecast, by Country 2019 & 2032
- Table 62: Global Preclinical Imaging Industry Volume K Unit Forecast, by Country 2019 & 2032
- Table 63: GCC Preclinical Imaging Industry Revenue (Million) Forecast, by Application 2019 & 2032
- Table 64: GCC Preclinical Imaging Industry Volume (K Unit) Forecast, by Application 2019 & 2032
- Table 65: South Africa Preclinical Imaging Industry Revenue (Million) Forecast, by Application 2019 & 2032
- Table 66: South Africa Preclinical Imaging Industry Volume (K Unit) Forecast, by Application 2019 & 2032
- Table 67: Rest of Middle East and Africa Preclinical Imaging Industry Revenue (Million) Forecast, by Application 2019 & 2032
- Table 68: Rest of Middle East and Africa Preclinical Imaging Industry Volume (K Unit) Forecast, by Application 2019 & 2032
- Table 69: Global Preclinical Imaging Industry Revenue Million Forecast, by Modality 2019 & 2032
- Table 70: Global Preclinical Imaging Industry Volume K Unit Forecast, by Modality 2019 & 2032
- Table 71: Global Preclinical Imaging Industry Revenue Million Forecast, by Country 2019 & 2032
- Table 72: Global Preclinical Imaging Industry Volume K Unit Forecast, by Country 2019 & 2032
- Table 73: Brazil Preclinical Imaging Industry Revenue (Million) Forecast, by Application 2019 & 2032
- Table 74: Brazil Preclinical Imaging Industry Volume (K Unit) Forecast, by Application 2019 & 2032
- Table 75: Argentina Preclinical Imaging Industry Revenue (Million) Forecast, by Application 2019 & 2032
- Table 76: Argentina Preclinical Imaging Industry Volume (K Unit) Forecast, by Application 2019 & 2032
- Table 77: Rest of South America Preclinical Imaging Industry Revenue (Million) Forecast, by Application 2019 & 2032
- Table 78: Rest of South America Preclinical Imaging Industry Volume (K Unit) Forecast, by Application 2019 & 2032
Frequently Asked Questions
1. What is the projected Compound Annual Growth Rate (CAGR) of the Preclinical Imaging Industry?
The projected CAGR is approximately 6.00%.
2. Which companies are prominent players in the Preclinical Imaging Industry?
Key companies in the market include Mediso Ltd, Trifoil Imaging, Photon etc, Advanced Molecular Vision Inc, Euro-BioImaging ERIC, MR Solutions Ltd, Aspect Imaging Ltd, PerkinElmer Inc, IVIM Technology Corp , Bruker Corporation, AXT PTY LTD, United Imaging Healthcare Co Ltd, Fujifilm Holdings Corporation.
3. What are the main segments of the Preclinical Imaging Industry?
The market segments include Modality.
4. Can you provide details about the market size?
The market size is estimated to be USD XX Million as of 2022.
5. What are some drivers contributing to market growth?
Technological Advancements in Molecular Imaging; Increasing Demand for Non-invasive Small Animal Imaging Techniques; Increase in Preclinical Research Funding. by Both Private and Public Organizations.
6. What are the notable trends driving market growth?
Micro-Ultrasound is the Segment by Modality and is Expected to be the Fastest Growing Market.
7. Are there any restraints impacting market growth?
Strict Regulations in Preclinical Research; High Installation and Operational Costs associated with Preclinical Imaging Modalities.
8. Can you provide examples of recent developments in the market?
In May 2022, Bruker launched innovative 7 Tesla and 9.4 Tesla conduction-cooled Maxwell magnets for its market-leading preclinical magnetic resonance imaging (MRI) systems portfolio.
9. What pricing options are available for accessing the report?
Pricing options include single-user, multi-user, and enterprise licenses priced at USD 4750, USD 5250, and USD 8750 respectively.
10. Is the market size provided in terms of value or volume?
The market size is provided in terms of value, measured in Million and volume, measured in K Unit.
11. Are there any specific market keywords associated with the report?
Yes, the market keyword associated with the report is "Preclinical Imaging Industry," which aids in identifying and referencing the specific market segment covered.
12. How do I determine which pricing option suits my needs best?
The pricing options vary based on user requirements and access needs. Individual users may opt for single-user licenses, while businesses requiring broader access may choose multi-user or enterprise licenses for cost-effective access to the report.
13. Are there any additional resources or data provided in the Preclinical Imaging Industry report?
While the report offers comprehensive insights, it's advisable to review the specific contents or supplementary materials provided to ascertain if additional resources or data are available.
14. How can I stay updated on further developments or reports in the Preclinical Imaging Industry?
To stay informed about further developments, trends, and reports in the Preclinical Imaging Industry, consider subscribing to industry newsletters, following relevant companies and organizations, or regularly checking reputable industry news sources and publications.
Methodology
Step 1 - Identification of Relevant Samples Size from Population Database


Step 2 - Approaches for Defining Global Market Size (Value, Volume* & Price*)

Note*: In applicable scenarios
Step 3 - Data Sources
Primary Research
- Web Analytics
- Survey Reports
- Research Institute
- Latest Research Reports
- Opinion Leaders
Secondary Research
- Annual Reports
- White Paper
- Latest Press Release
- Industry Association
- Paid Database
- Investor Presentations

Step 4 - Data Triangulation
Involves using different sources of information in order to increase the validity of a study
These sources are likely to be stakeholders in a program - participants, other researchers, program staff, other community members, and so on.
Then we put all data in single framework & apply various statistical tools to find out the dynamic on the market.
During the analysis stage, feedback from the stakeholder groups would be compared to determine areas of agreement as well as areas of divergence


