
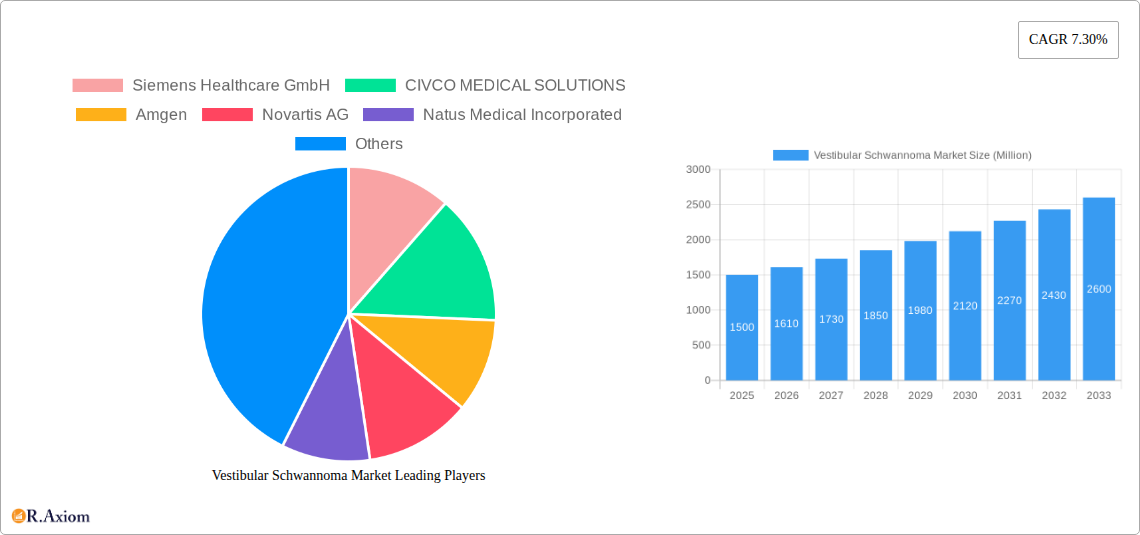
Key Insights
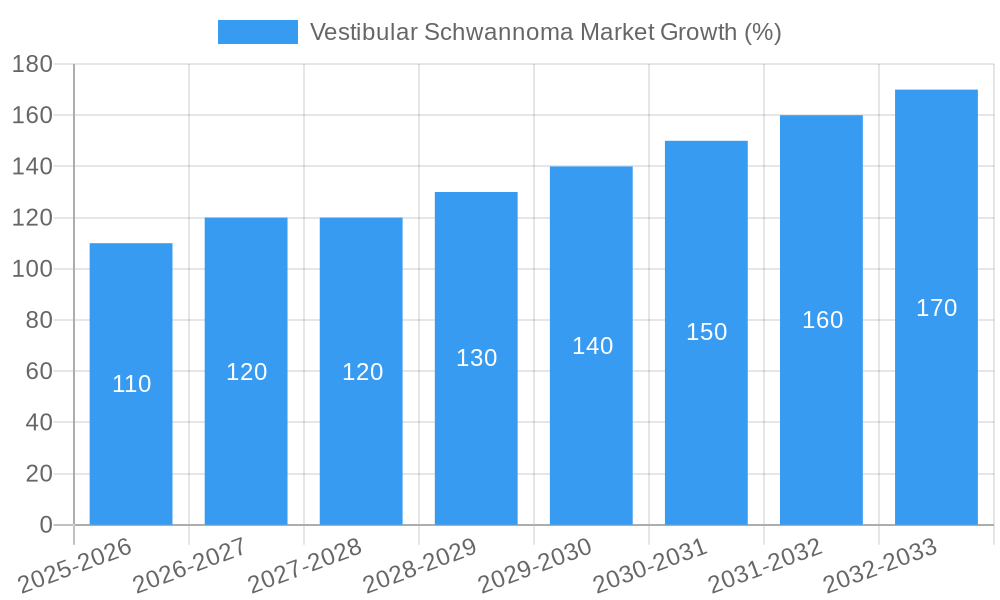
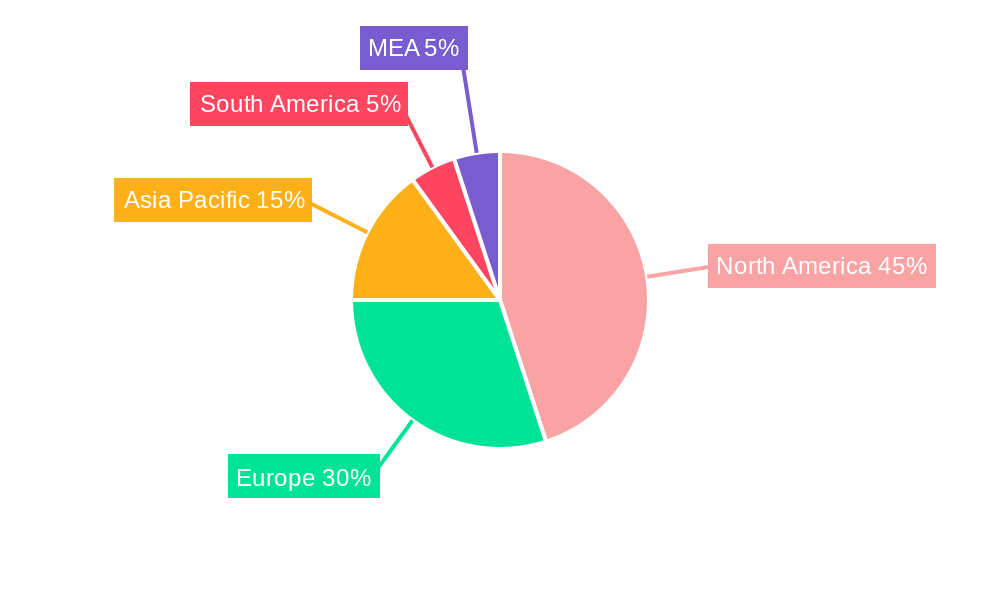
The Vestibular Schwannoma (VS) market, characterized by a 7.30% CAGR, presents a significant growth opportunity across the forecast period (2025-2033). Driven by an aging population increasing susceptibility to VS, technological advancements in diagnostic tools like magnetic resonance imaging (MRI) and improved treatment options such as radiation therapy and surgical interventions, the market is poised for considerable expansion. The segment breakdown reveals a significant share held by hospitals and clinics as end-users, with audiometry and MRI dominating the diagnostic procedures. While drugs constitute a prominent treatment type, the "Other" category likely includes emerging therapies and surgical procedures, signifying ongoing innovation within the sector. North America, with its advanced healthcare infrastructure and higher prevalence of VS, is anticipated to maintain a substantial market share. However, rising healthcare expenditure in Asia-Pacific and increasing awareness in emerging markets are expected to fuel considerable growth in these regions during the forecast period. The presence of key players like Siemens Healthcare GmbH, Natus Medical Incorporated, and others, signifies a competitive landscape characterized by ongoing research and development efforts aimed at enhancing diagnostic accuracy and treatment efficacy. Competition among companies and the push to improve technology should contribute to an increase in the market value over the next decade.
The market restraints largely stem from the relatively low incidence of VS compared to other neurological disorders. However, the high cost of advanced diagnostic and treatment methods, coupled with the need for specialized expertise, can limit accessibility in certain regions. Regulatory hurdles for new drug approvals and the inherent complexities in treating VS also present challenges to overall market growth. Despite these constraints, the projected CAGR underscores a positive outlook, suggesting that technological advancements and increasing awareness will likely outweigh these limitations. Future market development is likely to focus on minimally invasive surgical techniques, personalized medicine approaches, and improved access to healthcare in underserved regions. The focus on improved diagnostic tools will increase the market size.
Vestibular Schwannoma Market: A Comprehensive Market Research Report (2019-2033)
This detailed report provides a comprehensive analysis of the global Vestibular Schwannoma Market, offering invaluable insights for industry stakeholders, investors, and researchers. Covering the period from 2019 to 2033, with 2025 as the base year and a forecast period extending to 2033, this report meticulously examines market dynamics, segmentation, growth drivers, challenges, and opportunities. The study period (2019-2024) provides a historical perspective, while the forecast period (2025-2033) projects future market trends. The report's findings are supported by robust data analysis and industry expertise. The global market size in 2025 is estimated at xx Million.
Vestibular Schwannoma Market Concentration & Innovation
The Vestibular Schwannoma market exhibits a moderately consolidated structure, with several key players holding significant market share. While exact figures are proprietary to this report, Siemens Healthcare GmbH, Natus Medical Incorporated, and Elekta appear to be among the leading companies, driven by their established presence, technological advancements, and extensive distribution networks. The market share of these leading players is estimated at xx%, suggesting room for both organic growth and potential consolidation through mergers and acquisitions (M&A).
Innovation in the Vestibular Schwannoma market is primarily driven by advancements in diagnostic technologies (e.g., improved MRI techniques, more sensitive audiometry) and minimally invasive treatment options (e.g., refined stereotactic radiosurgery, targeted drug therapies). Regulatory frameworks, particularly those related to medical device approvals and clinical trial regulations, significantly influence market growth. While there aren't direct substitutes for treating vestibular schwannomas, the market faces competition from alternative treatment approaches for related conditions. End-user trends, particularly the preference for minimally invasive procedures and outpatient treatment options, are shaping the market landscape.
M&A activities in the industry have been moderate in recent years, with deal values varying depending on the size and scope of the acquisition. Larger companies are more likely to pursue acquisitions to expand their product portfolios and geographic reach. The lack of extensive M&A data publicly available prevents a more precise analysis.
Vestibular Schwannoma Market Industry Trends & Insights
The Vestibular Schwannoma market is projected to experience significant growth during the forecast period (2025-2033), driven primarily by the increasing prevalence of vestibular schwannomas, technological advancements in diagnosis and treatment, and rising healthcare expenditure. The market is expected to witness a Compound Annual Growth Rate (CAGR) of xx% during this period. Technological disruptions, such as the development of more precise and less invasive surgical techniques and the emergence of targeted therapies, are key growth catalysts. Consumer preferences are shifting towards less invasive treatments with quicker recovery times, thus influencing the demand for advanced diagnostic and therapeutic tools. The competitive landscape is characterized by intense rivalry among established players and the emergence of innovative start-ups, leading to continuous product development and market penetration. Market penetration rates for advanced diagnostic and treatment technologies are expected to rise significantly over the forecast period, reflecting the adoption of newer and more effective treatment modalities.
Dominant Markets & Segments in Vestibular Schwannoma Market
The dominant segment within the Vestibular Schwannoma market varies depending on the specific aspect considered.
By End-User: Hospitals represent the largest segment due to their extensive resources, specialized expertise, and higher patient volumes. Clinics are also a significant segment, particularly for initial diagnosis and less complex cases. Other end-users comprise smaller niche players.
By Diagnosis: Magnetic Resonance Imaging (MRI) is the dominant diagnostic method for vestibular schwannoma, due to its superior imaging capabilities. Audiometry and electronystagmography play crucial supportive roles.
By Treatment Type: Drugs and Radiation Therapy are the most prevalent treatment types. However, the exact market share between them varies due to several factors, including tumor size and patient health.
Dominance Analysis: The United States and Western European countries hold dominant positions in the market, driven by advanced healthcare infrastructure, higher healthcare expenditure, and a comparatively higher incidence rate of vestibular schwannomas.
Vestibular Schwannoma Market Product Developments
Recent product developments in the Vestibular Schwannoma market focus on enhancing diagnostic accuracy, minimizing invasiveness of treatment procedures, and improving patient outcomes. This includes advancements in MRI technology, improved surgical tools, and the development of targeted therapies. These innovations reflect the industry's commitment to providing better patient care and streamlining the treatment process. The market is also seeing the development of sophisticated software for treatment planning and monitoring.
Report Scope & Segmentation Analysis
This report segments the Vestibular Schwannoma market across several key dimensions:
By End-User: Hospitals, Clinics, Other End-Users. Each segment exhibits varying growth trajectories, reflecting the differing treatment capabilities and patient volumes. Hospitals are expected to show the highest growth due to greater resources and expertise.
By Diagnosis: Audiometry, Electronystagmography, Magnetic Resonance Imaging, Others. MRI holds the largest market share due to its superior diagnostic capabilities.
By Treatment Type: Drugs, Others (Radiation Therapy). Both segments are expected to show considerable growth, driven by technological innovations and increasing treatment adoption.
Each segment's growth is driven by several factors including technological advancement, regulatory changes, and patient preferences. The competitive dynamics also differ considerably across the different segments.
Key Drivers of Vestibular Schwannoma Market Growth
The Vestibular Schwannoma market's growth is propelled by several key factors: rising prevalence of vestibular schwannomas, advancements in minimally invasive surgical techniques and targeted therapies, increasing healthcare expenditure, and growing awareness among patients and healthcare professionals. Technological advancements, such as improved imaging techniques (MRI) and refined radiosurgery, lead to improved diagnostic accuracy and more effective treatment options. Favorable regulatory environments facilitate the adoption of innovative treatments.
Challenges in the Vestibular Schwannoma Market Sector
The Vestibular Schwannoma market faces several challenges, including the high cost of advanced diagnostic and therapeutic procedures, the potential for treatment complications, and the need for specialized expertise in diagnosis and treatment. Regulatory hurdles in obtaining approvals for new treatment methods can also slow market growth. The complexity of the surgical procedures, especially microsurgery, requires specialized trained professionals, leading to a global shortage of qualified personnel. Moreover, the relatively low incidence of vestibular schwannomas compared to other neurological conditions may limit the overall market size.
Emerging Opportunities in Vestibular Schwannoma Market
Emerging opportunities lie in the development of personalized medicine approaches for vestibular schwannoma treatment, the utilization of artificial intelligence for improved diagnosis and treatment planning, and the expansion into underserved regions with limited access to specialized healthcare services. Further research into novel drug therapies offers significant potential for market expansion.
Leading Players in the Vestibular Schwannoma Market Market
- Siemens Healthcare GmbH
- CIVCO MEDICAL SOLUTIONS
- Amgen
- Novartis AG
- Natus Medical Incorporated
- AstraZeneca
- MAICO Diagnostics GmbH
- F Hoffmann-La Roche AG
- Elekta
- Interacoustics A/S
Key Developments in Vestibular Schwannoma Market Industry
June 2023: A clinical trial initiated by the Medical College of Wisconsin evaluating the efficacy of microsurgical resection and stereotactic radiosurgery for vestibular schwannomas (36 participants). This signifies ongoing research and advancements in treatment strategies.
May 2022: The Brain Foundation (Australia) funded a project at the University of Newcastle focusing on developing innovative targeted therapies for acoustic neuroma (a type of vestibular schwannoma). This highlights a focus on developing new and more effective treatment options.
Strategic Outlook for Vestibular Schwannoma Market Market
The Vestibular Schwannoma market presents substantial growth potential, driven by continuous innovation in diagnostic and therapeutic technologies. The rising prevalence of the condition, coupled with a greater emphasis on minimally invasive and personalized treatment options, ensures consistent market expansion. The focus on improving patient outcomes, alongside increasing healthcare expenditure and technological advancements, creates a promising strategic outlook for the future.
Vestibular Schwannoma Market Segmentation
-
1. Diagnosis
- 1.1. Audiometry
- 1.2. Electronystagmography
- 1.3. Magnetic Resonance Imaging
- 1.4. Others
-
2. Treatment Type
-
2.1. Drugs
- 2.1.1. Anticonvulsants
- 2.1.2. Corticosteroids
- 2.1.3. Others
-
2.2. Radiation Therapy
- 2.2.1. Proton Therapy
- 2.2.2. Stereotactic Radiosurgery
-
2.1. Drugs
-
3. End-User
- 3.1. Hospitals
- 3.2. Clinics
- 3.3. Other End Users
Vestibular Schwannoma Market Segmentation By Geography
-
1. North America
- 1.1. United States
- 1.2. Canada
- 1.3. Mexico
-
2. Europe
- 2.1. Germany
- 2.2. United Kingdom
- 2.3. France
- 2.4. Italy
- 2.5. Spain
- 2.6. Rest of Europe
-
3. Asia Pacific
- 3.1. China
- 3.2. Japan
- 3.3. India
- 3.4. Australia
- 3.5. South Korea
- 3.6. Rest of Asia Pacific
- 4. Rest of World
Vestibular Schwannoma Market REPORT HIGHLIGHTS
| Aspects | Details |
|---|---|
| Study Period | 2019-2033 |
| Base Year | 2024 |
| Estimated Year | 2025 |
| Forecast Period | 2025-2033 |
| Historical Period | 2019-2024 |
| Growth Rate | CAGR of 7.30% from 2019-2033 |
| Segmentation |
|
Table of Contents
- 1. Introduction
- 1.1. Research Scope
- 1.2. Market Segmentation
- 1.3. Research Methodology
- 1.4. Definitions and Assumptions
- 2. Executive Summary
- 2.1. Introduction
- 3. Market Dynamics
- 3.1. Introduction
- 3.2. Market Drivers
- 3.2.1. Increasing Prevalence of Acoustic Neuroma; Growth in Research and Development in the Field of Acoustic Neuroma
- 3.3. Market Restrains
- 3.3.1. Lack of Skilled Technicians
- 3.4. Market Trends
- 3.4.1. Stereotactic Radiosurgery is Expected to Witness a Significant Growth Over the Forecast Period
- 4. Market Factor Analysis
- 4.1. Porters Five Forces
- 4.2. Supply/Value Chain
- 4.3. PESTEL analysis
- 4.4. Market Entropy
- 4.5. Patent/Trademark Analysis
- 5. Global Vestibular Schwannoma Market Analysis, Insights and Forecast, 2019-2031
- 5.1. Market Analysis, Insights and Forecast - by Diagnosis
- 5.1.1. Audiometry
- 5.1.2. Electronystagmography
- 5.1.3. Magnetic Resonance Imaging
- 5.1.4. Others
- 5.2. Market Analysis, Insights and Forecast - by Treatment Type
- 5.2.1. Drugs
- 5.2.1.1. Anticonvulsants
- 5.2.1.2. Corticosteroids
- 5.2.1.3. Others
- 5.2.2. Radiation Therapy
- 5.2.2.1. Proton Therapy
- 5.2.2.2. Stereotactic Radiosurgery
- 5.2.1. Drugs
- 5.3. Market Analysis, Insights and Forecast - by End-User
- 5.3.1. Hospitals
- 5.3.2. Clinics
- 5.3.3. Other End Users
- 5.4. Market Analysis, Insights and Forecast - by Region
- 5.4.1. North America
- 5.4.2. Europe
- 5.4.3. Asia Pacific
- 5.4.4. Rest of World
- 5.1. Market Analysis, Insights and Forecast - by Diagnosis
- 6. North America Vestibular Schwannoma Market Analysis, Insights and Forecast, 2019-2031
- 6.1. Market Analysis, Insights and Forecast - by Diagnosis
- 6.1.1. Audiometry
- 6.1.2. Electronystagmography
- 6.1.3. Magnetic Resonance Imaging
- 6.1.4. Others
- 6.2. Market Analysis, Insights and Forecast - by Treatment Type
- 6.2.1. Drugs
- 6.2.1.1. Anticonvulsants
- 6.2.1.2. Corticosteroids
- 6.2.1.3. Others
- 6.2.2. Radiation Therapy
- 6.2.2.1. Proton Therapy
- 6.2.2.2. Stereotactic Radiosurgery
- 6.2.1. Drugs
- 6.3. Market Analysis, Insights and Forecast - by End-User
- 6.3.1. Hospitals
- 6.3.2. Clinics
- 6.3.3. Other End Users
- 6.1. Market Analysis, Insights and Forecast - by Diagnosis
- 7. Europe Vestibular Schwannoma Market Analysis, Insights and Forecast, 2019-2031
- 7.1. Market Analysis, Insights and Forecast - by Diagnosis
- 7.1.1. Audiometry
- 7.1.2. Electronystagmography
- 7.1.3. Magnetic Resonance Imaging
- 7.1.4. Others
- 7.2. Market Analysis, Insights and Forecast - by Treatment Type
- 7.2.1. Drugs
- 7.2.1.1. Anticonvulsants
- 7.2.1.2. Corticosteroids
- 7.2.1.3. Others
- 7.2.2. Radiation Therapy
- 7.2.2.1. Proton Therapy
- 7.2.2.2. Stereotactic Radiosurgery
- 7.2.1. Drugs
- 7.3. Market Analysis, Insights and Forecast - by End-User
- 7.3.1. Hospitals
- 7.3.2. Clinics
- 7.3.3. Other End Users
- 7.1. Market Analysis, Insights and Forecast - by Diagnosis
- 8. Asia Pacific Vestibular Schwannoma Market Analysis, Insights and Forecast, 2019-2031
- 8.1. Market Analysis, Insights and Forecast - by Diagnosis
- 8.1.1. Audiometry
- 8.1.2. Electronystagmography
- 8.1.3. Magnetic Resonance Imaging
- 8.1.4. Others
- 8.2. Market Analysis, Insights and Forecast - by Treatment Type
- 8.2.1. Drugs
- 8.2.1.1. Anticonvulsants
- 8.2.1.2. Corticosteroids
- 8.2.1.3. Others
- 8.2.2. Radiation Therapy
- 8.2.2.1. Proton Therapy
- 8.2.2.2. Stereotactic Radiosurgery
- 8.2.1. Drugs
- 8.3. Market Analysis, Insights and Forecast - by End-User
- 8.3.1. Hospitals
- 8.3.2. Clinics
- 8.3.3. Other End Users
- 8.1. Market Analysis, Insights and Forecast - by Diagnosis
- 9. Rest of World Vestibular Schwannoma Market Analysis, Insights and Forecast, 2019-2031
- 9.1. Market Analysis, Insights and Forecast - by Diagnosis
- 9.1.1. Audiometry
- 9.1.2. Electronystagmography
- 9.1.3. Magnetic Resonance Imaging
- 9.1.4. Others
- 9.2. Market Analysis, Insights and Forecast - by Treatment Type
- 9.2.1. Drugs
- 9.2.1.1. Anticonvulsants
- 9.2.1.2. Corticosteroids
- 9.2.1.3. Others
- 9.2.2. Radiation Therapy
- 9.2.2.1. Proton Therapy
- 9.2.2.2. Stereotactic Radiosurgery
- 9.2.1. Drugs
- 9.3. Market Analysis, Insights and Forecast - by End-User
- 9.3.1. Hospitals
- 9.3.2. Clinics
- 9.3.3. Other End Users
- 9.1. Market Analysis, Insights and Forecast - by Diagnosis
- 10. North America Vestibular Schwannoma Market Analysis, Insights and Forecast, 2019-2031
- 10.1. Market Analysis, Insights and Forecast - By Country/Sub-region
- 10.1.1 United States
- 10.1.2 Canada
- 10.1.3 Mexico
- 11. Europe Vestibular Schwannoma Market Analysis, Insights and Forecast, 2019-2031
- 11.1. Market Analysis, Insights and Forecast - By Country/Sub-region
- 11.1.1 Germany
- 11.1.2 United Kingdom
- 11.1.3 France
- 11.1.4 Spain
- 11.1.5 Italy
- 11.1.6 Spain
- 11.1.7 Belgium
- 11.1.8 Netherland
- 11.1.9 Nordics
- 11.1.10 Rest of Europe
- 12. Asia Pacific Vestibular Schwannoma Market Analysis, Insights and Forecast, 2019-2031
- 12.1. Market Analysis, Insights and Forecast - By Country/Sub-region
- 12.1.1 China
- 12.1.2 Japan
- 12.1.3 India
- 12.1.4 South Korea
- 12.1.5 Southeast Asia
- 12.1.6 Australia
- 12.1.7 Indonesia
- 12.1.8 Phillipes
- 12.1.9 Singapore
- 12.1.10 Thailandc
- 12.1.11 Rest of Asia Pacific
- 13. South America Vestibular Schwannoma Market Analysis, Insights and Forecast, 2019-2031
- 13.1. Market Analysis, Insights and Forecast - By Country/Sub-region
- 13.1.1 Brazil
- 13.1.2 Argentina
- 13.1.3 Peru
- 13.1.4 Chile
- 13.1.5 Colombia
- 13.1.6 Ecuador
- 13.1.7 Venezuela
- 13.1.8 Rest of South America
- 14. North America Vestibular Schwannoma Market Analysis, Insights and Forecast, 2019-2031
- 14.1. Market Analysis, Insights and Forecast - By Country/Sub-region
- 14.1.1 United States
- 14.1.2 Canada
- 14.1.3 Mexico
- 15. MEA Vestibular Schwannoma Market Analysis, Insights and Forecast, 2019-2031
- 15.1. Market Analysis, Insights and Forecast - By Country/Sub-region
- 15.1.1 United Arab Emirates
- 15.1.2 Saudi Arabia
- 15.1.3 South Africa
- 15.1.4 Rest of Middle East and Africa
- 16. Competitive Analysis
- 16.1. Global Market Share Analysis 2024
- 16.2. Company Profiles
- 16.2.1 Siemens Healthcare GmbH
- 16.2.1.1. Overview
- 16.2.1.2. Products
- 16.2.1.3. SWOT Analysis
- 16.2.1.4. Recent Developments
- 16.2.1.5. Financials (Based on Availability)
- 16.2.2 CIVCO MEDICAL SOLUTIONS
- 16.2.2.1. Overview
- 16.2.2.2. Products
- 16.2.2.3. SWOT Analysis
- 16.2.2.4. Recent Developments
- 16.2.2.5. Financials (Based on Availability)
- 16.2.3 Amgen
- 16.2.3.1. Overview
- 16.2.3.2. Products
- 16.2.3.3. SWOT Analysis
- 16.2.3.4. Recent Developments
- 16.2.3.5. Financials (Based on Availability)
- 16.2.4 Novartis AG
- 16.2.4.1. Overview
- 16.2.4.2. Products
- 16.2.4.3. SWOT Analysis
- 16.2.4.4. Recent Developments
- 16.2.4.5. Financials (Based on Availability)
- 16.2.5 Natus Medical Incorporated
- 16.2.5.1. Overview
- 16.2.5.2. Products
- 16.2.5.3. SWOT Analysis
- 16.2.5.4. Recent Developments
- 16.2.5.5. Financials (Based on Availability)
- 16.2.6 AstraZeneca
- 16.2.6.1. Overview
- 16.2.6.2. Products
- 16.2.6.3. SWOT Analysis
- 16.2.6.4. Recent Developments
- 16.2.6.5. Financials (Based on Availability)
- 16.2.7 MAICO Diagnostics GmbH
- 16.2.7.1. Overview
- 16.2.7.2. Products
- 16.2.7.3. SWOT Analysis
- 16.2.7.4. Recent Developments
- 16.2.7.5. Financials (Based on Availability)
- 16.2.8 F Hoffmann-La Roche AG
- 16.2.8.1. Overview
- 16.2.8.2. Products
- 16.2.8.3. SWOT Analysis
- 16.2.8.4. Recent Developments
- 16.2.8.5. Financials (Based on Availability)
- 16.2.9 Elekta
- 16.2.9.1. Overview
- 16.2.9.2. Products
- 16.2.9.3. SWOT Analysis
- 16.2.9.4. Recent Developments
- 16.2.9.5. Financials (Based on Availability)
- 16.2.10 Interacoustics A/S
- 16.2.10.1. Overview
- 16.2.10.2. Products
- 16.2.10.3. SWOT Analysis
- 16.2.10.4. Recent Developments
- 16.2.10.5. Financials (Based on Availability)
- 16.2.1 Siemens Healthcare GmbH
List of Figures
- Figure 1: Global Vestibular Schwannoma Market Revenue Breakdown (Million, %) by Region 2024 & 2032
- Figure 2: Global Vestibular Schwannoma Market Volume Breakdown (K Unit, %) by Region 2024 & 2032
- Figure 3: North America Vestibular Schwannoma Market Revenue (Million), by Country 2024 & 2032
- Figure 4: North America Vestibular Schwannoma Market Volume (K Unit), by Country 2024 & 2032
- Figure 5: North America Vestibular Schwannoma Market Revenue Share (%), by Country 2024 & 2032
- Figure 6: North America Vestibular Schwannoma Market Volume Share (%), by Country 2024 & 2032
- Figure 7: Europe Vestibular Schwannoma Market Revenue (Million), by Country 2024 & 2032
- Figure 8: Europe Vestibular Schwannoma Market Volume (K Unit), by Country 2024 & 2032
- Figure 9: Europe Vestibular Schwannoma Market Revenue Share (%), by Country 2024 & 2032
- Figure 10: Europe Vestibular Schwannoma Market Volume Share (%), by Country 2024 & 2032
- Figure 11: Asia Pacific Vestibular Schwannoma Market Revenue (Million), by Country 2024 & 2032
- Figure 12: Asia Pacific Vestibular Schwannoma Market Volume (K Unit), by Country 2024 & 2032
- Figure 13: Asia Pacific Vestibular Schwannoma Market Revenue Share (%), by Country 2024 & 2032
- Figure 14: Asia Pacific Vestibular Schwannoma Market Volume Share (%), by Country 2024 & 2032
- Figure 15: South America Vestibular Schwannoma Market Revenue (Million), by Country 2024 & 2032
- Figure 16: South America Vestibular Schwannoma Market Volume (K Unit), by Country 2024 & 2032
- Figure 17: South America Vestibular Schwannoma Market Revenue Share (%), by Country 2024 & 2032
- Figure 18: South America Vestibular Schwannoma Market Volume Share (%), by Country 2024 & 2032
- Figure 19: North America Vestibular Schwannoma Market Revenue (Million), by Country 2024 & 2032
- Figure 20: North America Vestibular Schwannoma Market Volume (K Unit), by Country 2024 & 2032
- Figure 21: North America Vestibular Schwannoma Market Revenue Share (%), by Country 2024 & 2032
- Figure 22: North America Vestibular Schwannoma Market Volume Share (%), by Country 2024 & 2032
- Figure 23: MEA Vestibular Schwannoma Market Revenue (Million), by Country 2024 & 2032
- Figure 24: MEA Vestibular Schwannoma Market Volume (K Unit), by Country 2024 & 2032
- Figure 25: MEA Vestibular Schwannoma Market Revenue Share (%), by Country 2024 & 2032
- Figure 26: MEA Vestibular Schwannoma Market Volume Share (%), by Country 2024 & 2032
- Figure 27: North America Vestibular Schwannoma Market Revenue (Million), by Diagnosis 2024 & 2032
- Figure 28: North America Vestibular Schwannoma Market Volume (K Unit), by Diagnosis 2024 & 2032
- Figure 29: North America Vestibular Schwannoma Market Revenue Share (%), by Diagnosis 2024 & 2032
- Figure 30: North America Vestibular Schwannoma Market Volume Share (%), by Diagnosis 2024 & 2032
- Figure 31: North America Vestibular Schwannoma Market Revenue (Million), by Treatment Type 2024 & 2032
- Figure 32: North America Vestibular Schwannoma Market Volume (K Unit), by Treatment Type 2024 & 2032
- Figure 33: North America Vestibular Schwannoma Market Revenue Share (%), by Treatment Type 2024 & 2032
- Figure 34: North America Vestibular Schwannoma Market Volume Share (%), by Treatment Type 2024 & 2032
- Figure 35: North America Vestibular Schwannoma Market Revenue (Million), by End-User 2024 & 2032
- Figure 36: North America Vestibular Schwannoma Market Volume (K Unit), by End-User 2024 & 2032
- Figure 37: North America Vestibular Schwannoma Market Revenue Share (%), by End-User 2024 & 2032
- Figure 38: North America Vestibular Schwannoma Market Volume Share (%), by End-User 2024 & 2032
- Figure 39: North America Vestibular Schwannoma Market Revenue (Million), by Country 2024 & 2032
- Figure 40: North America Vestibular Schwannoma Market Volume (K Unit), by Country 2024 & 2032
- Figure 41: North America Vestibular Schwannoma Market Revenue Share (%), by Country 2024 & 2032
- Figure 42: North America Vestibular Schwannoma Market Volume Share (%), by Country 2024 & 2032
- Figure 43: Europe Vestibular Schwannoma Market Revenue (Million), by Diagnosis 2024 & 2032
- Figure 44: Europe Vestibular Schwannoma Market Volume (K Unit), by Diagnosis 2024 & 2032
- Figure 45: Europe Vestibular Schwannoma Market Revenue Share (%), by Diagnosis 2024 & 2032
- Figure 46: Europe Vestibular Schwannoma Market Volume Share (%), by Diagnosis 2024 & 2032
- Figure 47: Europe Vestibular Schwannoma Market Revenue (Million), by Treatment Type 2024 & 2032
- Figure 48: Europe Vestibular Schwannoma Market Volume (K Unit), by Treatment Type 2024 & 2032
- Figure 49: Europe Vestibular Schwannoma Market Revenue Share (%), by Treatment Type 2024 & 2032
- Figure 50: Europe Vestibular Schwannoma Market Volume Share (%), by Treatment Type 2024 & 2032
- Figure 51: Europe Vestibular Schwannoma Market Revenue (Million), by End-User 2024 & 2032
- Figure 52: Europe Vestibular Schwannoma Market Volume (K Unit), by End-User 2024 & 2032
- Figure 53: Europe Vestibular Schwannoma Market Revenue Share (%), by End-User 2024 & 2032
- Figure 54: Europe Vestibular Schwannoma Market Volume Share (%), by End-User 2024 & 2032
- Figure 55: Europe Vestibular Schwannoma Market Revenue (Million), by Country 2024 & 2032
- Figure 56: Europe Vestibular Schwannoma Market Volume (K Unit), by Country 2024 & 2032
- Figure 57: Europe Vestibular Schwannoma Market Revenue Share (%), by Country 2024 & 2032
- Figure 58: Europe Vestibular Schwannoma Market Volume Share (%), by Country 2024 & 2032
- Figure 59: Asia Pacific Vestibular Schwannoma Market Revenue (Million), by Diagnosis 2024 & 2032
- Figure 60: Asia Pacific Vestibular Schwannoma Market Volume (K Unit), by Diagnosis 2024 & 2032
- Figure 61: Asia Pacific Vestibular Schwannoma Market Revenue Share (%), by Diagnosis 2024 & 2032
- Figure 62: Asia Pacific Vestibular Schwannoma Market Volume Share (%), by Diagnosis 2024 & 2032
- Figure 63: Asia Pacific Vestibular Schwannoma Market Revenue (Million), by Treatment Type 2024 & 2032
- Figure 64: Asia Pacific Vestibular Schwannoma Market Volume (K Unit), by Treatment Type 2024 & 2032
- Figure 65: Asia Pacific Vestibular Schwannoma Market Revenue Share (%), by Treatment Type 2024 & 2032
- Figure 66: Asia Pacific Vestibular Schwannoma Market Volume Share (%), by Treatment Type 2024 & 2032
- Figure 67: Asia Pacific Vestibular Schwannoma Market Revenue (Million), by End-User 2024 & 2032
- Figure 68: Asia Pacific Vestibular Schwannoma Market Volume (K Unit), by End-User 2024 & 2032
- Figure 69: Asia Pacific Vestibular Schwannoma Market Revenue Share (%), by End-User 2024 & 2032
- Figure 70: Asia Pacific Vestibular Schwannoma Market Volume Share (%), by End-User 2024 & 2032
- Figure 71: Asia Pacific Vestibular Schwannoma Market Revenue (Million), by Country 2024 & 2032
- Figure 72: Asia Pacific Vestibular Schwannoma Market Volume (K Unit), by Country 2024 & 2032
- Figure 73: Asia Pacific Vestibular Schwannoma Market Revenue Share (%), by Country 2024 & 2032
- Figure 74: Asia Pacific Vestibular Schwannoma Market Volume Share (%), by Country 2024 & 2032
- Figure 75: Rest of World Vestibular Schwannoma Market Revenue (Million), by Diagnosis 2024 & 2032
- Figure 76: Rest of World Vestibular Schwannoma Market Volume (K Unit), by Diagnosis 2024 & 2032
- Figure 77: Rest of World Vestibular Schwannoma Market Revenue Share (%), by Diagnosis 2024 & 2032
- Figure 78: Rest of World Vestibular Schwannoma Market Volume Share (%), by Diagnosis 2024 & 2032
- Figure 79: Rest of World Vestibular Schwannoma Market Revenue (Million), by Treatment Type 2024 & 2032
- Figure 80: Rest of World Vestibular Schwannoma Market Volume (K Unit), by Treatment Type 2024 & 2032
- Figure 81: Rest of World Vestibular Schwannoma Market Revenue Share (%), by Treatment Type 2024 & 2032
- Figure 82: Rest of World Vestibular Schwannoma Market Volume Share (%), by Treatment Type 2024 & 2032
- Figure 83: Rest of World Vestibular Schwannoma Market Revenue (Million), by End-User 2024 & 2032
- Figure 84: Rest of World Vestibular Schwannoma Market Volume (K Unit), by End-User 2024 & 2032
- Figure 85: Rest of World Vestibular Schwannoma Market Revenue Share (%), by End-User 2024 & 2032
- Figure 86: Rest of World Vestibular Schwannoma Market Volume Share (%), by End-User 2024 & 2032
- Figure 87: Rest of World Vestibular Schwannoma Market Revenue (Million), by Country 2024 & 2032
- Figure 88: Rest of World Vestibular Schwannoma Market Volume (K Unit), by Country 2024 & 2032
- Figure 89: Rest of World Vestibular Schwannoma Market Revenue Share (%), by Country 2024 & 2032
- Figure 90: Rest of World Vestibular Schwannoma Market Volume Share (%), by Country 2024 & 2032
List of Tables
- Table 1: Global Vestibular Schwannoma Market Revenue Million Forecast, by Region 2019 & 2032
- Table 2: Global Vestibular Schwannoma Market Volume K Unit Forecast, by Region 2019 & 2032
- Table 3: Global Vestibular Schwannoma Market Revenue Million Forecast, by Diagnosis 2019 & 2032
- Table 4: Global Vestibular Schwannoma Market Volume K Unit Forecast, by Diagnosis 2019 & 2032
- Table 5: Global Vestibular Schwannoma Market Revenue Million Forecast, by Treatment Type 2019 & 2032
- Table 6: Global Vestibular Schwannoma Market Volume K Unit Forecast, by Treatment Type 2019 & 2032
- Table 7: Global Vestibular Schwannoma Market Revenue Million Forecast, by End-User 2019 & 2032
- Table 8: Global Vestibular Schwannoma Market Volume K Unit Forecast, by End-User 2019 & 2032
- Table 9: Global Vestibular Schwannoma Market Revenue Million Forecast, by Region 2019 & 2032
- Table 10: Global Vestibular Schwannoma Market Volume K Unit Forecast, by Region 2019 & 2032
- Table 11: Global Vestibular Schwannoma Market Revenue Million Forecast, by Country 2019 & 2032
- Table 12: Global Vestibular Schwannoma Market Volume K Unit Forecast, by Country 2019 & 2032
- Table 13: United States Vestibular Schwannoma Market Revenue (Million) Forecast, by Application 2019 & 2032
- Table 14: United States Vestibular Schwannoma Market Volume (K Unit) Forecast, by Application 2019 & 2032
- Table 15: Canada Vestibular Schwannoma Market Revenue (Million) Forecast, by Application 2019 & 2032
- Table 16: Canada Vestibular Schwannoma Market Volume (K Unit) Forecast, by Application 2019 & 2032
- Table 17: Mexico Vestibular Schwannoma Market Revenue (Million) Forecast, by Application 2019 & 2032
- Table 18: Mexico Vestibular Schwannoma Market Volume (K Unit) Forecast, by Application 2019 & 2032
- Table 19: Global Vestibular Schwannoma Market Revenue Million Forecast, by Country 2019 & 2032
- Table 20: Global Vestibular Schwannoma Market Volume K Unit Forecast, by Country 2019 & 2032
- Table 21: Germany Vestibular Schwannoma Market Revenue (Million) Forecast, by Application 2019 & 2032
- Table 22: Germany Vestibular Schwannoma Market Volume (K Unit) Forecast, by Application 2019 & 2032
- Table 23: United Kingdom Vestibular Schwannoma Market Revenue (Million) Forecast, by Application 2019 & 2032
- Table 24: United Kingdom Vestibular Schwannoma Market Volume (K Unit) Forecast, by Application 2019 & 2032
- Table 25: France Vestibular Schwannoma Market Revenue (Million) Forecast, by Application 2019 & 2032
- Table 26: France Vestibular Schwannoma Market Volume (K Unit) Forecast, by Application 2019 & 2032
- Table 27: Spain Vestibular Schwannoma Market Revenue (Million) Forecast, by Application 2019 & 2032
- Table 28: Spain Vestibular Schwannoma Market Volume (K Unit) Forecast, by Application 2019 & 2032
- Table 29: Italy Vestibular Schwannoma Market Revenue (Million) Forecast, by Application 2019 & 2032
- Table 30: Italy Vestibular Schwannoma Market Volume (K Unit) Forecast, by Application 2019 & 2032
- Table 31: Spain Vestibular Schwannoma Market Revenue (Million) Forecast, by Application 2019 & 2032
- Table 32: Spain Vestibular Schwannoma Market Volume (K Unit) Forecast, by Application 2019 & 2032
- Table 33: Belgium Vestibular Schwannoma Market Revenue (Million) Forecast, by Application 2019 & 2032
- Table 34: Belgium Vestibular Schwannoma Market Volume (K Unit) Forecast, by Application 2019 & 2032
- Table 35: Netherland Vestibular Schwannoma Market Revenue (Million) Forecast, by Application 2019 & 2032
- Table 36: Netherland Vestibular Schwannoma Market Volume (K Unit) Forecast, by Application 2019 & 2032
- Table 37: Nordics Vestibular Schwannoma Market Revenue (Million) Forecast, by Application 2019 & 2032
- Table 38: Nordics Vestibular Schwannoma Market Volume (K Unit) Forecast, by Application 2019 & 2032
- Table 39: Rest of Europe Vestibular Schwannoma Market Revenue (Million) Forecast, by Application 2019 & 2032
- Table 40: Rest of Europe Vestibular Schwannoma Market Volume (K Unit) Forecast, by Application 2019 & 2032
- Table 41: Global Vestibular Schwannoma Market Revenue Million Forecast, by Country 2019 & 2032
- Table 42: Global Vestibular Schwannoma Market Volume K Unit Forecast, by Country 2019 & 2032
- Table 43: China Vestibular Schwannoma Market Revenue (Million) Forecast, by Application 2019 & 2032
- Table 44: China Vestibular Schwannoma Market Volume (K Unit) Forecast, by Application 2019 & 2032
- Table 45: Japan Vestibular Schwannoma Market Revenue (Million) Forecast, by Application 2019 & 2032
- Table 46: Japan Vestibular Schwannoma Market Volume (K Unit) Forecast, by Application 2019 & 2032
- Table 47: India Vestibular Schwannoma Market Revenue (Million) Forecast, by Application 2019 & 2032
- Table 48: India Vestibular Schwannoma Market Volume (K Unit) Forecast, by Application 2019 & 2032
- Table 49: South Korea Vestibular Schwannoma Market Revenue (Million) Forecast, by Application 2019 & 2032
- Table 50: South Korea Vestibular Schwannoma Market Volume (K Unit) Forecast, by Application 2019 & 2032
- Table 51: Southeast Asia Vestibular Schwannoma Market Revenue (Million) Forecast, by Application 2019 & 2032
- Table 52: Southeast Asia Vestibular Schwannoma Market Volume (K Unit) Forecast, by Application 2019 & 2032
- Table 53: Australia Vestibular Schwannoma Market Revenue (Million) Forecast, by Application 2019 & 2032
- Table 54: Australia Vestibular Schwannoma Market Volume (K Unit) Forecast, by Application 2019 & 2032
- Table 55: Indonesia Vestibular Schwannoma Market Revenue (Million) Forecast, by Application 2019 & 2032
- Table 56: Indonesia Vestibular Schwannoma Market Volume (K Unit) Forecast, by Application 2019 & 2032
- Table 57: Phillipes Vestibular Schwannoma Market Revenue (Million) Forecast, by Application 2019 & 2032
- Table 58: Phillipes Vestibular Schwannoma Market Volume (K Unit) Forecast, by Application 2019 & 2032
- Table 59: Singapore Vestibular Schwannoma Market Revenue (Million) Forecast, by Application 2019 & 2032
- Table 60: Singapore Vestibular Schwannoma Market Volume (K Unit) Forecast, by Application 2019 & 2032
- Table 61: Thailandc Vestibular Schwannoma Market Revenue (Million) Forecast, by Application 2019 & 2032
- Table 62: Thailandc Vestibular Schwannoma Market Volume (K Unit) Forecast, by Application 2019 & 2032
- Table 63: Rest of Asia Pacific Vestibular Schwannoma Market Revenue (Million) Forecast, by Application 2019 & 2032
- Table 64: Rest of Asia Pacific Vestibular Schwannoma Market Volume (K Unit) Forecast, by Application 2019 & 2032
- Table 65: Global Vestibular Schwannoma Market Revenue Million Forecast, by Country 2019 & 2032
- Table 66: Global Vestibular Schwannoma Market Volume K Unit Forecast, by Country 2019 & 2032
- Table 67: Brazil Vestibular Schwannoma Market Revenue (Million) Forecast, by Application 2019 & 2032
- Table 68: Brazil Vestibular Schwannoma Market Volume (K Unit) Forecast, by Application 2019 & 2032
- Table 69: Argentina Vestibular Schwannoma Market Revenue (Million) Forecast, by Application 2019 & 2032
- Table 70: Argentina Vestibular Schwannoma Market Volume (K Unit) Forecast, by Application 2019 & 2032
- Table 71: Peru Vestibular Schwannoma Market Revenue (Million) Forecast, by Application 2019 & 2032
- Table 72: Peru Vestibular Schwannoma Market Volume (K Unit) Forecast, by Application 2019 & 2032
- Table 73: Chile Vestibular Schwannoma Market Revenue (Million) Forecast, by Application 2019 & 2032
- Table 74: Chile Vestibular Schwannoma Market Volume (K Unit) Forecast, by Application 2019 & 2032
- Table 75: Colombia Vestibular Schwannoma Market Revenue (Million) Forecast, by Application 2019 & 2032
- Table 76: Colombia Vestibular Schwannoma Market Volume (K Unit) Forecast, by Application 2019 & 2032
- Table 77: Ecuador Vestibular Schwannoma Market Revenue (Million) Forecast, by Application 2019 & 2032
- Table 78: Ecuador Vestibular Schwannoma Market Volume (K Unit) Forecast, by Application 2019 & 2032
- Table 79: Venezuela Vestibular Schwannoma Market Revenue (Million) Forecast, by Application 2019 & 2032
- Table 80: Venezuela Vestibular Schwannoma Market Volume (K Unit) Forecast, by Application 2019 & 2032
- Table 81: Rest of South America Vestibular Schwannoma Market Revenue (Million) Forecast, by Application 2019 & 2032
- Table 82: Rest of South America Vestibular Schwannoma Market Volume (K Unit) Forecast, by Application 2019 & 2032
- Table 83: Global Vestibular Schwannoma Market Revenue Million Forecast, by Country 2019 & 2032
- Table 84: Global Vestibular Schwannoma Market Volume K Unit Forecast, by Country 2019 & 2032
- Table 85: United States Vestibular Schwannoma Market Revenue (Million) Forecast, by Application 2019 & 2032
- Table 86: United States Vestibular Schwannoma Market Volume (K Unit) Forecast, by Application 2019 & 2032
- Table 87: Canada Vestibular Schwannoma Market Revenue (Million) Forecast, by Application 2019 & 2032
- Table 88: Canada Vestibular Schwannoma Market Volume (K Unit) Forecast, by Application 2019 & 2032
- Table 89: Mexico Vestibular Schwannoma Market Revenue (Million) Forecast, by Application 2019 & 2032
- Table 90: Mexico Vestibular Schwannoma Market Volume (K Unit) Forecast, by Application 2019 & 2032
- Table 91: Global Vestibular Schwannoma Market Revenue Million Forecast, by Country 2019 & 2032
- Table 92: Global Vestibular Schwannoma Market Volume K Unit Forecast, by Country 2019 & 2032
- Table 93: United Arab Emirates Vestibular Schwannoma Market Revenue (Million) Forecast, by Application 2019 & 2032
- Table 94: United Arab Emirates Vestibular Schwannoma Market Volume (K Unit) Forecast, by Application 2019 & 2032
- Table 95: Saudi Arabia Vestibular Schwannoma Market Revenue (Million) Forecast, by Application 2019 & 2032
- Table 96: Saudi Arabia Vestibular Schwannoma Market Volume (K Unit) Forecast, by Application 2019 & 2032
- Table 97: South Africa Vestibular Schwannoma Market Revenue (Million) Forecast, by Application 2019 & 2032
- Table 98: South Africa Vestibular Schwannoma Market Volume (K Unit) Forecast, by Application 2019 & 2032
- Table 99: Rest of Middle East and Africa Vestibular Schwannoma Market Revenue (Million) Forecast, by Application 2019 & 2032
- Table 100: Rest of Middle East and Africa Vestibular Schwannoma Market Volume (K Unit) Forecast, by Application 2019 & 2032
- Table 101: Global Vestibular Schwannoma Market Revenue Million Forecast, by Diagnosis 2019 & 2032
- Table 102: Global Vestibular Schwannoma Market Volume K Unit Forecast, by Diagnosis 2019 & 2032
- Table 103: Global Vestibular Schwannoma Market Revenue Million Forecast, by Treatment Type 2019 & 2032
- Table 104: Global Vestibular Schwannoma Market Volume K Unit Forecast, by Treatment Type 2019 & 2032
- Table 105: Global Vestibular Schwannoma Market Revenue Million Forecast, by End-User 2019 & 2032
- Table 106: Global Vestibular Schwannoma Market Volume K Unit Forecast, by End-User 2019 & 2032
- Table 107: Global Vestibular Schwannoma Market Revenue Million Forecast, by Country 2019 & 2032
- Table 108: Global Vestibular Schwannoma Market Volume K Unit Forecast, by Country 2019 & 2032
- Table 109: United States Vestibular Schwannoma Market Revenue (Million) Forecast, by Application 2019 & 2032
- Table 110: United States Vestibular Schwannoma Market Volume (K Unit) Forecast, by Application 2019 & 2032
- Table 111: Canada Vestibular Schwannoma Market Revenue (Million) Forecast, by Application 2019 & 2032
- Table 112: Canada Vestibular Schwannoma Market Volume (K Unit) Forecast, by Application 2019 & 2032
- Table 113: Mexico Vestibular Schwannoma Market Revenue (Million) Forecast, by Application 2019 & 2032
- Table 114: Mexico Vestibular Schwannoma Market Volume (K Unit) Forecast, by Application 2019 & 2032
- Table 115: Global Vestibular Schwannoma Market Revenue Million Forecast, by Diagnosis 2019 & 2032
- Table 116: Global Vestibular Schwannoma Market Volume K Unit Forecast, by Diagnosis 2019 & 2032
- Table 117: Global Vestibular Schwannoma Market Revenue Million Forecast, by Treatment Type 2019 & 2032
- Table 118: Global Vestibular Schwannoma Market Volume K Unit Forecast, by Treatment Type 2019 & 2032
- Table 119: Global Vestibular Schwannoma Market Revenue Million Forecast, by End-User 2019 & 2032
- Table 120: Global Vestibular Schwannoma Market Volume K Unit Forecast, by End-User 2019 & 2032
- Table 121: Global Vestibular Schwannoma Market Revenue Million Forecast, by Country 2019 & 2032
- Table 122: Global Vestibular Schwannoma Market Volume K Unit Forecast, by Country 2019 & 2032
- Table 123: Germany Vestibular Schwannoma Market Revenue (Million) Forecast, by Application 2019 & 2032
- Table 124: Germany Vestibular Schwannoma Market Volume (K Unit) Forecast, by Application 2019 & 2032
- Table 125: United Kingdom Vestibular Schwannoma Market Revenue (Million) Forecast, by Application 2019 & 2032
- Table 126: United Kingdom Vestibular Schwannoma Market Volume (K Unit) Forecast, by Application 2019 & 2032
- Table 127: France Vestibular Schwannoma Market Revenue (Million) Forecast, by Application 2019 & 2032
- Table 128: France Vestibular Schwannoma Market Volume (K Unit) Forecast, by Application 2019 & 2032
- Table 129: Italy Vestibular Schwannoma Market Revenue (Million) Forecast, by Application 2019 & 2032
- Table 130: Italy Vestibular Schwannoma Market Volume (K Unit) Forecast, by Application 2019 & 2032
- Table 131: Spain Vestibular Schwannoma Market Revenue (Million) Forecast, by Application 2019 & 2032
- Table 132: Spain Vestibular Schwannoma Market Volume (K Unit) Forecast, by Application 2019 & 2032
- Table 133: Rest of Europe Vestibular Schwannoma Market Revenue (Million) Forecast, by Application 2019 & 2032
- Table 134: Rest of Europe Vestibular Schwannoma Market Volume (K Unit) Forecast, by Application 2019 & 2032
- Table 135: Global Vestibular Schwannoma Market Revenue Million Forecast, by Diagnosis 2019 & 2032
- Table 136: Global Vestibular Schwannoma Market Volume K Unit Forecast, by Diagnosis 2019 & 2032
- Table 137: Global Vestibular Schwannoma Market Revenue Million Forecast, by Treatment Type 2019 & 2032
- Table 138: Global Vestibular Schwannoma Market Volume K Unit Forecast, by Treatment Type 2019 & 2032
- Table 139: Global Vestibular Schwannoma Market Revenue Million Forecast, by End-User 2019 & 2032
- Table 140: Global Vestibular Schwannoma Market Volume K Unit Forecast, by End-User 2019 & 2032
- Table 141: Global Vestibular Schwannoma Market Revenue Million Forecast, by Country 2019 & 2032
- Table 142: Global Vestibular Schwannoma Market Volume K Unit Forecast, by Country 2019 & 2032
- Table 143: China Vestibular Schwannoma Market Revenue (Million) Forecast, by Application 2019 & 2032
- Table 144: China Vestibular Schwannoma Market Volume (K Unit) Forecast, by Application 2019 & 2032
- Table 145: Japan Vestibular Schwannoma Market Revenue (Million) Forecast, by Application 2019 & 2032
- Table 146: Japan Vestibular Schwannoma Market Volume (K Unit) Forecast, by Application 2019 & 2032
- Table 147: India Vestibular Schwannoma Market Revenue (Million) Forecast, by Application 2019 & 2032
- Table 148: India Vestibular Schwannoma Market Volume (K Unit) Forecast, by Application 2019 & 2032
- Table 149: Australia Vestibular Schwannoma Market Revenue (Million) Forecast, by Application 2019 & 2032
- Table 150: Australia Vestibular Schwannoma Market Volume (K Unit) Forecast, by Application 2019 & 2032
- Table 151: South Korea Vestibular Schwannoma Market Revenue (Million) Forecast, by Application 2019 & 2032
- Table 152: South Korea Vestibular Schwannoma Market Volume (K Unit) Forecast, by Application 2019 & 2032
- Table 153: Rest of Asia Pacific Vestibular Schwannoma Market Revenue (Million) Forecast, by Application 2019 & 2032
- Table 154: Rest of Asia Pacific Vestibular Schwannoma Market Volume (K Unit) Forecast, by Application 2019 & 2032
- Table 155: Global Vestibular Schwannoma Market Revenue Million Forecast, by Diagnosis 2019 & 2032
- Table 156: Global Vestibular Schwannoma Market Volume K Unit Forecast, by Diagnosis 2019 & 2032
- Table 157: Global Vestibular Schwannoma Market Revenue Million Forecast, by Treatment Type 2019 & 2032
- Table 158: Global Vestibular Schwannoma Market Volume K Unit Forecast, by Treatment Type 2019 & 2032
- Table 159: Global Vestibular Schwannoma Market Revenue Million Forecast, by End-User 2019 & 2032
- Table 160: Global Vestibular Schwannoma Market Volume K Unit Forecast, by End-User 2019 & 2032
- Table 161: Global Vestibular Schwannoma Market Revenue Million Forecast, by Country 2019 & 2032
- Table 162: Global Vestibular Schwannoma Market Volume K Unit Forecast, by Country 2019 & 2032
Frequently Asked Questions
1. What is the projected Compound Annual Growth Rate (CAGR) of the Vestibular Schwannoma Market?
The projected CAGR is approximately 7.30%.
2. Which companies are prominent players in the Vestibular Schwannoma Market?
Key companies in the market include Siemens Healthcare GmbH, CIVCO MEDICAL SOLUTIONS, Amgen, Novartis AG, Natus Medical Incorporated, AstraZeneca, MAICO Diagnostics GmbH, F Hoffmann-La Roche AG, Elekta, Interacoustics A/S.
3. What are the main segments of the Vestibular Schwannoma Market?
The market segments include Diagnosis, Treatment Type, End-User.
4. Can you provide details about the market size?
The market size is estimated to be USD XX Million as of 2022.
5. What are some drivers contributing to market growth?
Increasing Prevalence of Acoustic Neuroma; Growth in Research and Development in the Field of Acoustic Neuroma.
6. What are the notable trends driving market growth?
Stereotactic Radiosurgery is Expected to Witness a Significant Growth Over the Forecast Period.
7. Are there any restraints impacting market growth?
Lack of Skilled Technicians.
8. Can you provide examples of recent developments in the market?
June 2023: A clinical trial is expected to initiate with 36 participants to evaluate the efficacy of microsurgical resection of vestibular schwannoma and stereotactic radiosurgery. The trial is sponsored by the Medical College of Wisconsin, United States.
9. What pricing options are available for accessing the report?
Pricing options include single-user, multi-user, and enterprise licenses priced at USD 4750, USD 5250, and USD 8750 respectively.
10. Is the market size provided in terms of value or volume?
The market size is provided in terms of value, measured in Million and volume, measured in K Unit.
11. Are there any specific market keywords associated with the report?
Yes, the market keyword associated with the report is "Vestibular Schwannoma Market," which aids in identifying and referencing the specific market segment covered.
12. How do I determine which pricing option suits my needs best?
The pricing options vary based on user requirements and access needs. Individual users may opt for single-user licenses, while businesses requiring broader access may choose multi-user or enterprise licenses for cost-effective access to the report.
13. Are there any additional resources or data provided in the Vestibular Schwannoma Market report?
While the report offers comprehensive insights, it's advisable to review the specific contents or supplementary materials provided to ascertain if additional resources or data are available.
14. How can I stay updated on further developments or reports in the Vestibular Schwannoma Market?
To stay informed about further developments, trends, and reports in the Vestibular Schwannoma Market, consider subscribing to industry newsletters, following relevant companies and organizations, or regularly checking reputable industry news sources and publications.
Methodology
Step 1 - Identification of Relevant Samples Size from Population Database


Step 2 - Approaches for Defining Global Market Size (Value, Volume* & Price*)

Note*: In applicable scenarios
Step 3 - Data Sources
Primary Research
- Web Analytics
- Survey Reports
- Research Institute
- Latest Research Reports
- Opinion Leaders
Secondary Research
- Annual Reports
- White Paper
- Latest Press Release
- Industry Association
- Paid Database
- Investor Presentations

Step 4 - Data Triangulation
Involves using different sources of information in order to increase the validity of a study
These sources are likely to be stakeholders in a program - participants, other researchers, program staff, other community members, and so on.
Then we put all data in single framework & apply various statistical tools to find out the dynamic on the market.
During the analysis stage, feedback from the stakeholder groups would be compared to determine areas of agreement as well as areas of divergence


