
Key Insights
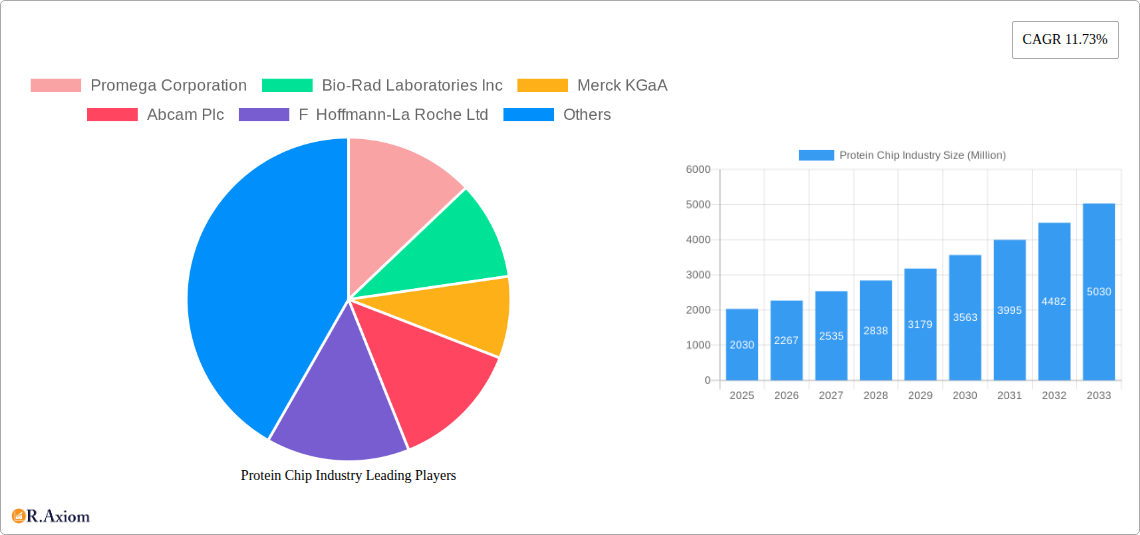
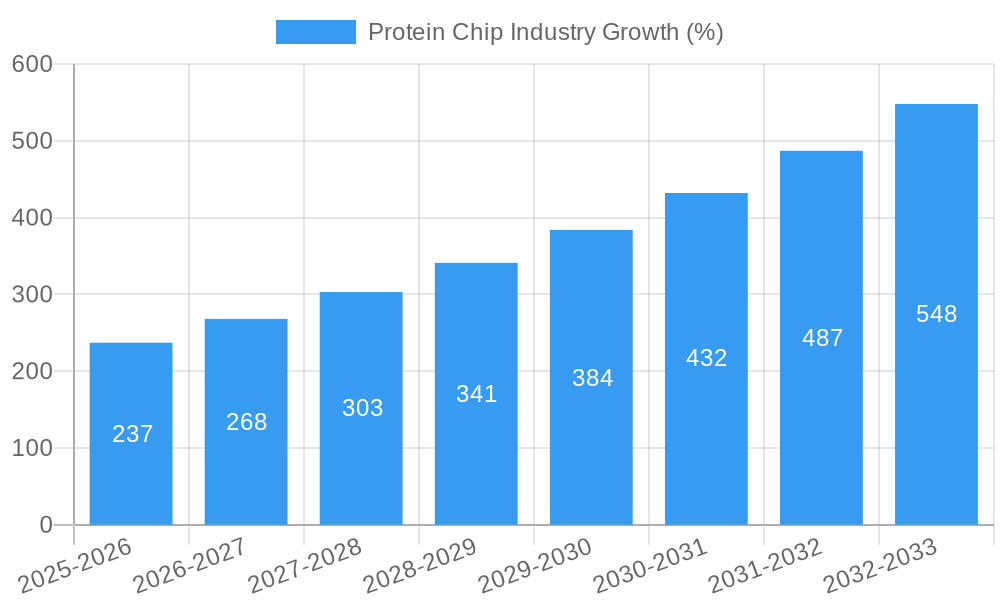
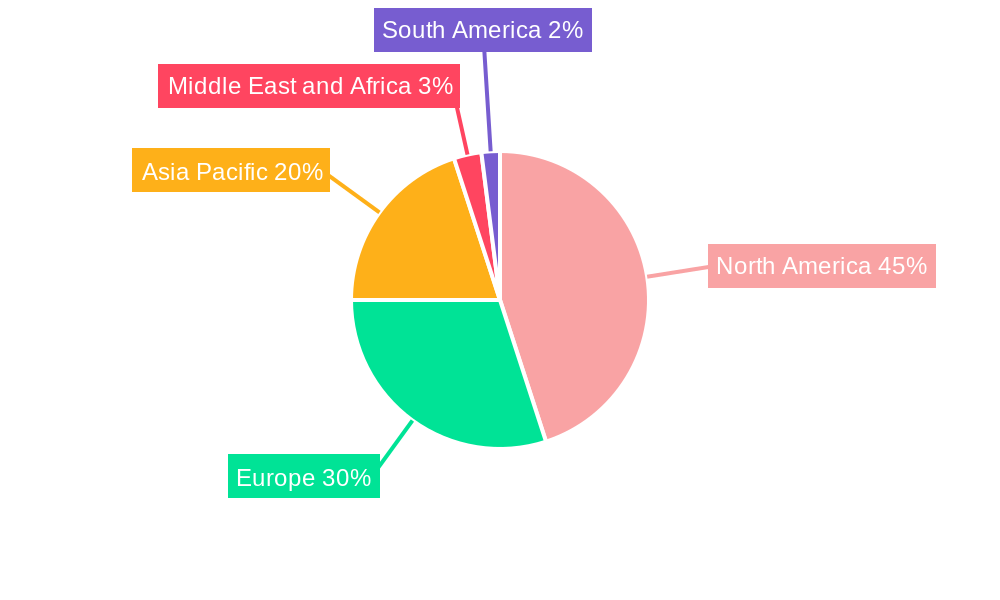
The global protein chip market, valued at $2.03 billion in 2025, is projected to experience robust growth, exhibiting a Compound Annual Growth Rate (CAGR) of 11.73% from 2025 to 2033. This expansion is driven by several key factors. The increasing prevalence of chronic diseases necessitates advanced diagnostic tools, fueling demand for protein chips in disease diagnosis. Simultaneously, the burgeoning pharmaceutical and biotechnology industries rely heavily on protein chips for drug discovery and development, accelerating the pace of innovation and contributing significantly to market growth. Technological advancements leading to higher throughput, improved sensitivity, and miniaturization of protein chips further enhance their appeal. The market is segmented by product type (kits, reagents, instruments, and accessories), application (drug discovery, disease diagnosis, other applications), and end-user (pharmaceutical and biotechnology industries, hospitals and clinics, other end-users). North America currently holds a significant market share, driven by strong research infrastructure and substantial investments in healthcare. However, the Asia-Pacific region is anticipated to witness the fastest growth, fueled by rising healthcare expenditure and a growing awareness of advanced diagnostic techniques. Despite this positive outlook, challenges remain, including the high cost of protein chips, stringent regulatory approvals, and the potential for technical limitations in certain applications.
The competitive landscape is characterized by a mix of established players and emerging companies. Key market participants such as Promega Corporation, Bio-Rad Laboratories Inc., Merck KGaA, Abcam Plc, F. Hoffmann-La Roche Ltd., Cell Signaling Technology Inc., Danaher Corporation, Qiagen, PerkinElmer Inc., and Thermo Fisher Scientific are continuously investing in research and development to improve existing technologies and introduce innovative products. Strategic collaborations, mergers, and acquisitions are expected to further shape the market dynamics in the coming years. The continued focus on personalized medicine and the development of point-of-care diagnostics will likely drive further adoption of protein chip technology, positioning it for substantial growth throughout the forecast period. This growth trajectory underscores the significant potential of protein chips as a crucial tool in both diagnostics and therapeutics.
Protein Chip Industry: A Comprehensive Market Report (2019-2033)
This comprehensive report provides an in-depth analysis of the global Protein Chip industry, offering valuable insights for stakeholders, investors, and industry professionals. The report covers the period from 2019 to 2033, with a focus on the forecast period 2025-2033, using 2025 as the base year and estimated year. The report's detailed segmentation, analysis of key players, and identification of emerging trends provide a complete understanding of this dynamic market. The total market size in 2025 is estimated at xx Million.
Protein Chip Industry Market Concentration & Innovation
The Protein Chip industry exhibits a moderately concentrated market structure, with several key players holding significant market share. Promega Corporation, Bio-Rad Laboratories Inc., Merck KGaA, Abcam Plc, F Hoffmann-La Roche Ltd, Cell Signaling Technology Inc, Danaher Corporation, Qiagen, PerkinElmer Inc., and Thermo Fisher Scientific are among the dominant players, collectively accounting for an estimated xx% of the global market share in 2025. However, the presence of numerous smaller players and emerging companies indicates a competitive landscape. Innovation is a key driver, with ongoing R&D efforts focused on enhancing chip sensitivity, throughput, and automation. Regulatory frameworks, particularly those related to diagnostics and therapeutics, significantly influence market growth and adoption. The market experiences limited substitution from alternative technologies; however, advancements in other proteomics techniques could pose a potential threat. End-user trends favor high-throughput, cost-effective solutions with integrated data analysis capabilities. M&A activities in the sector have been relatively moderate in recent years, with deal values averaging approximately xx Million in the past five years (2019-2024). Notable examples include Amgen's significant investment in Generate Biomedicines. Future M&A activity is expected to accelerate as companies seek to expand their product portfolios and market reach.
Protein Chip Industry Industry Trends & Insights
The global Protein Chip market is experiencing robust growth, driven by several key factors. The increasing prevalence of chronic diseases, coupled with the growing demand for faster and more accurate diagnostics, is a primary catalyst. Technological advancements leading to improved chip sensitivity, miniaturization, and multiplexing capabilities contribute to market expansion. The rising adoption of personalized medicine and the need for high-throughput screening in drug discovery further fuel market growth. The market displays a steady shift towards advanced technologies for improved efficiency, along with rising demand for protein chip-based research and diagnostics. The consumer preference is heavily inclined towards faster and more reliable diagnostics, leading to a surge in adoption across various healthcare settings. The competitive dynamics remain intense, with companies focusing on innovation, strategic partnerships, and acquisitions to gain a competitive edge. The global market is projected to grow at a CAGR of xx% during the forecast period (2025-2033), reaching an estimated value of xx Million by 2033. Market penetration is currently high within the pharmaceutical and biotechnology sectors, but significant untapped potential exists within other applications, particularly in point-of-care diagnostics.
Dominant Markets & Segments in Protein Chip Industry
- Leading Region: North America currently dominates the global Protein Chip market, driven by substantial investments in research and development, a robust healthcare infrastructure, and the presence of major industry players.
- Leading Segment (By Product Type): Kits represent the largest segment by product type due to their ease of use and cost-effectiveness for various applications.
- Leading Segment (By Application): Drug discovery and development currently holds the largest share owing to its extensive application in high-throughput screening and target validation.
- Leading Segment (By End User): The pharmaceutical and biotechnology industries are the primary end-users of Protein Chips, representing a substantial share of the market.
Key Drivers for Regional Dominance (North America):
- Strong government funding for research and development.
- High prevalence of chronic diseases.
- Established healthcare infrastructure.
- Presence of major pharmaceutical and biotechnology companies.
Europe and Asia-Pacific are expected to witness significant growth in the coming years, driven by increasing healthcare expenditure and rising adoption rates in emerging markets. These regions benefit from favorable government regulations and investments in advanced healthcare technologies.
Protein Chip Industry Product Developments
Recent advancements in Protein Chip technology have focused on improving sensitivity, specificity, and throughput. Miniaturization and integration with advanced detection systems have enhanced the capabilities of these devices. The development of novel chip designs and surface chemistries has broadened their applicability across a wide range of applications, including diagnostics, drug discovery, and basic research. Companies are also integrating data analysis software and cloud-based platforms to improve workflow efficiency and facilitate data interpretation. The competitive advantage lies in the development of highly sensitive, cost-effective, and user-friendly systems that meet the diverse needs of different end-users.
Report Scope & Segmentation Analysis
This report provides a comprehensive analysis of the Protein Chip market, segmented by product type (Kits, Reagents, Instruments & Accessories), application (Drug Discovery & Development, Disease Diagnosis, Other Applications), and end-user (Pharmaceutical & Biotechnology Industries, Hospitals & Clinics, Other End Users). Each segment's growth trajectory, market size, and competitive landscape are meticulously analyzed. For example, the Kits segment is projected to experience a CAGR of xx% due to its ease of use, while the Drug Discovery and Development application segment is anticipated to maintain its dominance due to the ongoing demand for high-throughput screening. The Pharmaceutical & Biotechnology industry segment will continue to be the dominant end-user, showing steady growth.
Key Drivers of Protein Chip Industry Growth
Several factors contribute to the growth of the Protein Chip industry. Technological advancements, such as improved sensitivity, high throughput, and miniaturization, are key drivers. The rising prevalence of chronic diseases and increasing demand for personalized medicine fuel market expansion. Favorable regulatory environments in certain regions also encourage adoption. Furthermore, the continuous need for efficient drug discovery and development processes in the pharmaceutical sector creates a sustainable market demand.
Challenges in the Protein Chip Industry Sector
Despite the significant growth potential, the Protein Chip industry faces challenges such as high initial investment costs, the need for specialized expertise, and stringent regulatory requirements, especially for diagnostic applications. Supply chain disruptions and the availability of skilled personnel can also impact market growth. The competitive landscape also presents a challenge, with existing players constantly innovating and new players entering the market. These factors can collectively restrain the market growth.
Emerging Opportunities in Protein Chip Industry
The Protein Chip industry presents several emerging opportunities. The expansion into point-of-care diagnostics offers significant growth potential, allowing for rapid and convenient disease diagnosis. Integration with advanced technologies, such as AI and machine learning, can improve data analysis and interpretation. The development of novel applications in areas like food safety and environmental monitoring can open up new markets. Exploring new material development and functionalization techniques may lead to breakthroughs in sensitivity and cost efficiency, broadening the application and adoption of protein chips.
Leading Players in the Protein Chip Industry Market
- Promega Corporation
- Bio-Rad Laboratories Inc
- Merck KGaA
- Abcam Plc
- F Hoffmann-La Roche Ltd
- Cell Signaling Technology Inc
- Danaher Corporation
- Qiagen
- PerkinElmer Inc
- Thermo Fisher Scientific
Key Developments in Protein Chip Industry Industry
- March 2022: Biognosys launched an expanded suite of proteomics platforms, providing pharmaceutical and diagnostics customers with deep biological insights across the R&D pipeline. This significantly enhanced the capabilities available to researchers and clinicians.
- January 2022: Amgen partnered with Generate Biomedicines to discover and create protein therapeutics, demonstrating a significant financial commitment (USD 1.9 Billion+) to protein-based therapeutics development, highlighting the importance of this technology in the pharmaceutical field.
Strategic Outlook for Protein Chip Industry Market
The Protein Chip industry is poised for continued growth, driven by technological innovation, increasing healthcare expenditure, and the growing demand for personalized medicine and rapid diagnostics. The development of new applications and the expansion into emerging markets offer significant opportunities for growth. Strategic partnerships, acquisitions, and continuous investment in R&D will be crucial for companies seeking to maintain a competitive edge in this dynamic market. The future outlook is positive, with significant potential for market expansion across various sectors.
Protein Chip Industry Segmentation
-
1. Product Type
- 1.1. Kits
- 1.2. Reagents
- 1.3. Instruments and Accessories
-
2. Application
- 2.1. Drug Discovery and Development
- 2.2. Disease Diagnosis
- 2.3. Other Applications
-
3. End User
- 3.1. Pharmaceutical and Biotechnology Industries
- 3.2. Hospitals and Clinics
- 3.3. Other End Users
Protein Chip Industry Segmentation By Geography
-
1. North America
- 1.1. United States
- 1.2. Canada
- 1.3. Mexico
-
2. Europe
- 2.1. Germany
- 2.2. United Kingdom
- 2.3. France
- 2.4. Italy
- 2.5. Spain
- 2.6. Rest of Europe
-
3. Asia Pacific
- 3.1. China
- 3.2. Japan
- 3.3. India
- 3.4. Australia
- 3.5. South Korea
- 3.6. Rest of Asia Pacific
-
4. Middle East and Africa
- 4.1. GCC
- 4.2. South Africa
- 4.3. Rest of Middle East and Africa
-
5. South America
- 5.1. Brazil
- 5.2. Argentina
- 5.3. Rest of South America
Protein Chip Industry REPORT HIGHLIGHTS
| Aspects | Details |
|---|---|
| Study Period | 2019-2033 |
| Base Year | 2024 |
| Estimated Year | 2025 |
| Forecast Period | 2025-2033 |
| Historical Period | 2019-2024 |
| Growth Rate | CAGR of 11.73% from 2019-2033 |
| Segmentation |
|
Table of Contents
- 1. Introduction
- 1.1. Research Scope
- 1.2. Market Segmentation
- 1.3. Research Methodology
- 1.4. Definitions and Assumptions
- 2. Executive Summary
- 2.1. Introduction
- 3. Market Dynamics
- 3.1. Introduction
- 3.2. Market Drivers
- 3.2.1. Increasing Incidence of Chronic and Infectious Diseases; Technological Advancements in Protein Assay Techniques; Increasing Expenditure on Pharmaceutical and Biological Research and Development
- 3.3. Market Restrains
- 3.3.1. High Cost of Multiplex Assay Equipment
- 3.4. Market Trends
- 3.4.1. Drug Discovery and Development Segment is Expected to Hold a Significant Share in the Protein Assay Market during the Forecast Period of the Study
- 4. Market Factor Analysis
- 4.1. Porters Five Forces
- 4.2. Supply/Value Chain
- 4.3. PESTEL analysis
- 4.4. Market Entropy
- 4.5. Patent/Trademark Analysis
- 5. Global Protein Chip Industry Analysis, Insights and Forecast, 2019-2031
- 5.1. Market Analysis, Insights and Forecast - by Product Type
- 5.1.1. Kits
- 5.1.2. Reagents
- 5.1.3. Instruments and Accessories
- 5.2. Market Analysis, Insights and Forecast - by Application
- 5.2.1. Drug Discovery and Development
- 5.2.2. Disease Diagnosis
- 5.2.3. Other Applications
- 5.3. Market Analysis, Insights and Forecast - by End User
- 5.3.1. Pharmaceutical and Biotechnology Industries
- 5.3.2. Hospitals and Clinics
- 5.3.3. Other End Users
- 5.4. Market Analysis, Insights and Forecast - by Region
- 5.4.1. North America
- 5.4.2. Europe
- 5.4.3. Asia Pacific
- 5.4.4. Middle East and Africa
- 5.4.5. South America
- 5.1. Market Analysis, Insights and Forecast - by Product Type
- 6. North America Protein Chip Industry Analysis, Insights and Forecast, 2019-2031
- 6.1. Market Analysis, Insights and Forecast - by Product Type
- 6.1.1. Kits
- 6.1.2. Reagents
- 6.1.3. Instruments and Accessories
- 6.2. Market Analysis, Insights and Forecast - by Application
- 6.2.1. Drug Discovery and Development
- 6.2.2. Disease Diagnosis
- 6.2.3. Other Applications
- 6.3. Market Analysis, Insights and Forecast - by End User
- 6.3.1. Pharmaceutical and Biotechnology Industries
- 6.3.2. Hospitals and Clinics
- 6.3.3. Other End Users
- 6.1. Market Analysis, Insights and Forecast - by Product Type
- 7. Europe Protein Chip Industry Analysis, Insights and Forecast, 2019-2031
- 7.1. Market Analysis, Insights and Forecast - by Product Type
- 7.1.1. Kits
- 7.1.2. Reagents
- 7.1.3. Instruments and Accessories
- 7.2. Market Analysis, Insights and Forecast - by Application
- 7.2.1. Drug Discovery and Development
- 7.2.2. Disease Diagnosis
- 7.2.3. Other Applications
- 7.3. Market Analysis, Insights and Forecast - by End User
- 7.3.1. Pharmaceutical and Biotechnology Industries
- 7.3.2. Hospitals and Clinics
- 7.3.3. Other End Users
- 7.1. Market Analysis, Insights and Forecast - by Product Type
- 8. Asia Pacific Protein Chip Industry Analysis, Insights and Forecast, 2019-2031
- 8.1. Market Analysis, Insights and Forecast - by Product Type
- 8.1.1. Kits
- 8.1.2. Reagents
- 8.1.3. Instruments and Accessories
- 8.2. Market Analysis, Insights and Forecast - by Application
- 8.2.1. Drug Discovery and Development
- 8.2.2. Disease Diagnosis
- 8.2.3. Other Applications
- 8.3. Market Analysis, Insights and Forecast - by End User
- 8.3.1. Pharmaceutical and Biotechnology Industries
- 8.3.2. Hospitals and Clinics
- 8.3.3. Other End Users
- 8.1. Market Analysis, Insights and Forecast - by Product Type
- 9. Middle East and Africa Protein Chip Industry Analysis, Insights and Forecast, 2019-2031
- 9.1. Market Analysis, Insights and Forecast - by Product Type
- 9.1.1. Kits
- 9.1.2. Reagents
- 9.1.3. Instruments and Accessories
- 9.2. Market Analysis, Insights and Forecast - by Application
- 9.2.1. Drug Discovery and Development
- 9.2.2. Disease Diagnosis
- 9.2.3. Other Applications
- 9.3. Market Analysis, Insights and Forecast - by End User
- 9.3.1. Pharmaceutical and Biotechnology Industries
- 9.3.2. Hospitals and Clinics
- 9.3.3. Other End Users
- 9.1. Market Analysis, Insights and Forecast - by Product Type
- 10. South America Protein Chip Industry Analysis, Insights and Forecast, 2019-2031
- 10.1. Market Analysis, Insights and Forecast - by Product Type
- 10.1.1. Kits
- 10.1.2. Reagents
- 10.1.3. Instruments and Accessories
- 10.2. Market Analysis, Insights and Forecast - by Application
- 10.2.1. Drug Discovery and Development
- 10.2.2. Disease Diagnosis
- 10.2.3. Other Applications
- 10.3. Market Analysis, Insights and Forecast - by End User
- 10.3.1. Pharmaceutical and Biotechnology Industries
- 10.3.2. Hospitals and Clinics
- 10.3.3. Other End Users
- 10.1. Market Analysis, Insights and Forecast - by Product Type
- 11. North America Protein Chip Industry Analysis, Insights and Forecast, 2019-2031
- 11.1. Market Analysis, Insights and Forecast - By Country/Sub-region
- 11.1.1 United States
- 11.1.2 Canada
- 11.1.3 Mexico
- 12. Europe Protein Chip Industry Analysis, Insights and Forecast, 2019-2031
- 12.1. Market Analysis, Insights and Forecast - By Country/Sub-region
- 12.1.1 Germany
- 12.1.2 United Kingdom
- 12.1.3 France
- 12.1.4 Italy
- 12.1.5 Spain
- 12.1.6 Rest of Europe
- 13. Asia Pacific Protein Chip Industry Analysis, Insights and Forecast, 2019-2031
- 13.1. Market Analysis, Insights and Forecast - By Country/Sub-region
- 13.1.1 China
- 13.1.2 Japan
- 13.1.3 India
- 13.1.4 Australia
- 13.1.5 South Korea
- 13.1.6 Rest of Asia Pacific
- 14. Middle East and Africa Protein Chip Industry Analysis, Insights and Forecast, 2019-2031
- 14.1. Market Analysis, Insights and Forecast - By Country/Sub-region
- 14.1.1 GCC
- 14.1.2 South Africa
- 14.1.3 Rest of Middle East and Africa
- 15. South America Protein Chip Industry Analysis, Insights and Forecast, 2019-2031
- 15.1. Market Analysis, Insights and Forecast - By Country/Sub-region
- 15.1.1 Brazil
- 15.1.2 Argentina
- 15.1.3 Rest of South America
- 16. Competitive Analysis
- 16.1. Global Market Share Analysis 2024
- 16.2. Company Profiles
- 16.2.1 Promega Corporation
- 16.2.1.1. Overview
- 16.2.1.2. Products
- 16.2.1.3. SWOT Analysis
- 16.2.1.4. Recent Developments
- 16.2.1.5. Financials (Based on Availability)
- 16.2.2 Bio-Rad Laboratories Inc
- 16.2.2.1. Overview
- 16.2.2.2. Products
- 16.2.2.3. SWOT Analysis
- 16.2.2.4. Recent Developments
- 16.2.2.5. Financials (Based on Availability)
- 16.2.3 Merck KGaA
- 16.2.3.1. Overview
- 16.2.3.2. Products
- 16.2.3.3. SWOT Analysis
- 16.2.3.4. Recent Developments
- 16.2.3.5. Financials (Based on Availability)
- 16.2.4 Abcam Plc
- 16.2.4.1. Overview
- 16.2.4.2. Products
- 16.2.4.3. SWOT Analysis
- 16.2.4.4. Recent Developments
- 16.2.4.5. Financials (Based on Availability)
- 16.2.5 F Hoffmann-La Roche Ltd
- 16.2.5.1. Overview
- 16.2.5.2. Products
- 16.2.5.3. SWOT Analysis
- 16.2.5.4. Recent Developments
- 16.2.5.5. Financials (Based on Availability)
- 16.2.6 Cell Signaling Technology Inc
- 16.2.6.1. Overview
- 16.2.6.2. Products
- 16.2.6.3. SWOT Analysis
- 16.2.6.4. Recent Developments
- 16.2.6.5. Financials (Based on Availability)
- 16.2.7 Danaher Corporation
- 16.2.7.1. Overview
- 16.2.7.2. Products
- 16.2.7.3. SWOT Analysis
- 16.2.7.4. Recent Developments
- 16.2.7.5. Financials (Based on Availability)
- 16.2.8 Qiagen
- 16.2.8.1. Overview
- 16.2.8.2. Products
- 16.2.8.3. SWOT Analysis
- 16.2.8.4. Recent Developments
- 16.2.8.5. Financials (Based on Availability)
- 16.2.9 PerkinElmer Inc
- 16.2.9.1. Overview
- 16.2.9.2. Products
- 16.2.9.3. SWOT Analysis
- 16.2.9.4. Recent Developments
- 16.2.9.5. Financials (Based on Availability)
- 16.2.10 Thermo Fisher Scientific
- 16.2.10.1. Overview
- 16.2.10.2. Products
- 16.2.10.3. SWOT Analysis
- 16.2.10.4. Recent Developments
- 16.2.10.5. Financials (Based on Availability)
- 16.2.1 Promega Corporation
List of Figures
- Figure 1: Global Protein Chip Industry Revenue Breakdown (Million, %) by Region 2024 & 2032
- Figure 2: Global Protein Chip Industry Volume Breakdown (K Unit, %) by Region 2024 & 2032
- Figure 3: North America Protein Chip Industry Revenue (Million), by Country 2024 & 2032
- Figure 4: North America Protein Chip Industry Volume (K Unit), by Country 2024 & 2032
- Figure 5: North America Protein Chip Industry Revenue Share (%), by Country 2024 & 2032
- Figure 6: North America Protein Chip Industry Volume Share (%), by Country 2024 & 2032
- Figure 7: Europe Protein Chip Industry Revenue (Million), by Country 2024 & 2032
- Figure 8: Europe Protein Chip Industry Volume (K Unit), by Country 2024 & 2032
- Figure 9: Europe Protein Chip Industry Revenue Share (%), by Country 2024 & 2032
- Figure 10: Europe Protein Chip Industry Volume Share (%), by Country 2024 & 2032
- Figure 11: Asia Pacific Protein Chip Industry Revenue (Million), by Country 2024 & 2032
- Figure 12: Asia Pacific Protein Chip Industry Volume (K Unit), by Country 2024 & 2032
- Figure 13: Asia Pacific Protein Chip Industry Revenue Share (%), by Country 2024 & 2032
- Figure 14: Asia Pacific Protein Chip Industry Volume Share (%), by Country 2024 & 2032
- Figure 15: Middle East and Africa Protein Chip Industry Revenue (Million), by Country 2024 & 2032
- Figure 16: Middle East and Africa Protein Chip Industry Volume (K Unit), by Country 2024 & 2032
- Figure 17: Middle East and Africa Protein Chip Industry Revenue Share (%), by Country 2024 & 2032
- Figure 18: Middle East and Africa Protein Chip Industry Volume Share (%), by Country 2024 & 2032
- Figure 19: South America Protein Chip Industry Revenue (Million), by Country 2024 & 2032
- Figure 20: South America Protein Chip Industry Volume (K Unit), by Country 2024 & 2032
- Figure 21: South America Protein Chip Industry Revenue Share (%), by Country 2024 & 2032
- Figure 22: South America Protein Chip Industry Volume Share (%), by Country 2024 & 2032
- Figure 23: North America Protein Chip Industry Revenue (Million), by Product Type 2024 & 2032
- Figure 24: North America Protein Chip Industry Volume (K Unit), by Product Type 2024 & 2032
- Figure 25: North America Protein Chip Industry Revenue Share (%), by Product Type 2024 & 2032
- Figure 26: North America Protein Chip Industry Volume Share (%), by Product Type 2024 & 2032
- Figure 27: North America Protein Chip Industry Revenue (Million), by Application 2024 & 2032
- Figure 28: North America Protein Chip Industry Volume (K Unit), by Application 2024 & 2032
- Figure 29: North America Protein Chip Industry Revenue Share (%), by Application 2024 & 2032
- Figure 30: North America Protein Chip Industry Volume Share (%), by Application 2024 & 2032
- Figure 31: North America Protein Chip Industry Revenue (Million), by End User 2024 & 2032
- Figure 32: North America Protein Chip Industry Volume (K Unit), by End User 2024 & 2032
- Figure 33: North America Protein Chip Industry Revenue Share (%), by End User 2024 & 2032
- Figure 34: North America Protein Chip Industry Volume Share (%), by End User 2024 & 2032
- Figure 35: North America Protein Chip Industry Revenue (Million), by Country 2024 & 2032
- Figure 36: North America Protein Chip Industry Volume (K Unit), by Country 2024 & 2032
- Figure 37: North America Protein Chip Industry Revenue Share (%), by Country 2024 & 2032
- Figure 38: North America Protein Chip Industry Volume Share (%), by Country 2024 & 2032
- Figure 39: Europe Protein Chip Industry Revenue (Million), by Product Type 2024 & 2032
- Figure 40: Europe Protein Chip Industry Volume (K Unit), by Product Type 2024 & 2032
- Figure 41: Europe Protein Chip Industry Revenue Share (%), by Product Type 2024 & 2032
- Figure 42: Europe Protein Chip Industry Volume Share (%), by Product Type 2024 & 2032
- Figure 43: Europe Protein Chip Industry Revenue (Million), by Application 2024 & 2032
- Figure 44: Europe Protein Chip Industry Volume (K Unit), by Application 2024 & 2032
- Figure 45: Europe Protein Chip Industry Revenue Share (%), by Application 2024 & 2032
- Figure 46: Europe Protein Chip Industry Volume Share (%), by Application 2024 & 2032
- Figure 47: Europe Protein Chip Industry Revenue (Million), by End User 2024 & 2032
- Figure 48: Europe Protein Chip Industry Volume (K Unit), by End User 2024 & 2032
- Figure 49: Europe Protein Chip Industry Revenue Share (%), by End User 2024 & 2032
- Figure 50: Europe Protein Chip Industry Volume Share (%), by End User 2024 & 2032
- Figure 51: Europe Protein Chip Industry Revenue (Million), by Country 2024 & 2032
- Figure 52: Europe Protein Chip Industry Volume (K Unit), by Country 2024 & 2032
- Figure 53: Europe Protein Chip Industry Revenue Share (%), by Country 2024 & 2032
- Figure 54: Europe Protein Chip Industry Volume Share (%), by Country 2024 & 2032
- Figure 55: Asia Pacific Protein Chip Industry Revenue (Million), by Product Type 2024 & 2032
- Figure 56: Asia Pacific Protein Chip Industry Volume (K Unit), by Product Type 2024 & 2032
- Figure 57: Asia Pacific Protein Chip Industry Revenue Share (%), by Product Type 2024 & 2032
- Figure 58: Asia Pacific Protein Chip Industry Volume Share (%), by Product Type 2024 & 2032
- Figure 59: Asia Pacific Protein Chip Industry Revenue (Million), by Application 2024 & 2032
- Figure 60: Asia Pacific Protein Chip Industry Volume (K Unit), by Application 2024 & 2032
- Figure 61: Asia Pacific Protein Chip Industry Revenue Share (%), by Application 2024 & 2032
- Figure 62: Asia Pacific Protein Chip Industry Volume Share (%), by Application 2024 & 2032
- Figure 63: Asia Pacific Protein Chip Industry Revenue (Million), by End User 2024 & 2032
- Figure 64: Asia Pacific Protein Chip Industry Volume (K Unit), by End User 2024 & 2032
- Figure 65: Asia Pacific Protein Chip Industry Revenue Share (%), by End User 2024 & 2032
- Figure 66: Asia Pacific Protein Chip Industry Volume Share (%), by End User 2024 & 2032
- Figure 67: Asia Pacific Protein Chip Industry Revenue (Million), by Country 2024 & 2032
- Figure 68: Asia Pacific Protein Chip Industry Volume (K Unit), by Country 2024 & 2032
- Figure 69: Asia Pacific Protein Chip Industry Revenue Share (%), by Country 2024 & 2032
- Figure 70: Asia Pacific Protein Chip Industry Volume Share (%), by Country 2024 & 2032
- Figure 71: Middle East and Africa Protein Chip Industry Revenue (Million), by Product Type 2024 & 2032
- Figure 72: Middle East and Africa Protein Chip Industry Volume (K Unit), by Product Type 2024 & 2032
- Figure 73: Middle East and Africa Protein Chip Industry Revenue Share (%), by Product Type 2024 & 2032
- Figure 74: Middle East and Africa Protein Chip Industry Volume Share (%), by Product Type 2024 & 2032
- Figure 75: Middle East and Africa Protein Chip Industry Revenue (Million), by Application 2024 & 2032
- Figure 76: Middle East and Africa Protein Chip Industry Volume (K Unit), by Application 2024 & 2032
- Figure 77: Middle East and Africa Protein Chip Industry Revenue Share (%), by Application 2024 & 2032
- Figure 78: Middle East and Africa Protein Chip Industry Volume Share (%), by Application 2024 & 2032
- Figure 79: Middle East and Africa Protein Chip Industry Revenue (Million), by End User 2024 & 2032
- Figure 80: Middle East and Africa Protein Chip Industry Volume (K Unit), by End User 2024 & 2032
- Figure 81: Middle East and Africa Protein Chip Industry Revenue Share (%), by End User 2024 & 2032
- Figure 82: Middle East and Africa Protein Chip Industry Volume Share (%), by End User 2024 & 2032
- Figure 83: Middle East and Africa Protein Chip Industry Revenue (Million), by Country 2024 & 2032
- Figure 84: Middle East and Africa Protein Chip Industry Volume (K Unit), by Country 2024 & 2032
- Figure 85: Middle East and Africa Protein Chip Industry Revenue Share (%), by Country 2024 & 2032
- Figure 86: Middle East and Africa Protein Chip Industry Volume Share (%), by Country 2024 & 2032
- Figure 87: South America Protein Chip Industry Revenue (Million), by Product Type 2024 & 2032
- Figure 88: South America Protein Chip Industry Volume (K Unit), by Product Type 2024 & 2032
- Figure 89: South America Protein Chip Industry Revenue Share (%), by Product Type 2024 & 2032
- Figure 90: South America Protein Chip Industry Volume Share (%), by Product Type 2024 & 2032
- Figure 91: South America Protein Chip Industry Revenue (Million), by Application 2024 & 2032
- Figure 92: South America Protein Chip Industry Volume (K Unit), by Application 2024 & 2032
- Figure 93: South America Protein Chip Industry Revenue Share (%), by Application 2024 & 2032
- Figure 94: South America Protein Chip Industry Volume Share (%), by Application 2024 & 2032
- Figure 95: South America Protein Chip Industry Revenue (Million), by End User 2024 & 2032
- Figure 96: South America Protein Chip Industry Volume (K Unit), by End User 2024 & 2032
- Figure 97: South America Protein Chip Industry Revenue Share (%), by End User 2024 & 2032
- Figure 98: South America Protein Chip Industry Volume Share (%), by End User 2024 & 2032
- Figure 99: South America Protein Chip Industry Revenue (Million), by Country 2024 & 2032
- Figure 100: South America Protein Chip Industry Volume (K Unit), by Country 2024 & 2032
- Figure 101: South America Protein Chip Industry Revenue Share (%), by Country 2024 & 2032
- Figure 102: South America Protein Chip Industry Volume Share (%), by Country 2024 & 2032
List of Tables
- Table 1: Global Protein Chip Industry Revenue Million Forecast, by Region 2019 & 2032
- Table 2: Global Protein Chip Industry Volume K Unit Forecast, by Region 2019 & 2032
- Table 3: Global Protein Chip Industry Revenue Million Forecast, by Product Type 2019 & 2032
- Table 4: Global Protein Chip Industry Volume K Unit Forecast, by Product Type 2019 & 2032
- Table 5: Global Protein Chip Industry Revenue Million Forecast, by Application 2019 & 2032
- Table 6: Global Protein Chip Industry Volume K Unit Forecast, by Application 2019 & 2032
- Table 7: Global Protein Chip Industry Revenue Million Forecast, by End User 2019 & 2032
- Table 8: Global Protein Chip Industry Volume K Unit Forecast, by End User 2019 & 2032
- Table 9: Global Protein Chip Industry Revenue Million Forecast, by Region 2019 & 2032
- Table 10: Global Protein Chip Industry Volume K Unit Forecast, by Region 2019 & 2032
- Table 11: Global Protein Chip Industry Revenue Million Forecast, by Country 2019 & 2032
- Table 12: Global Protein Chip Industry Volume K Unit Forecast, by Country 2019 & 2032
- Table 13: United States Protein Chip Industry Revenue (Million) Forecast, by Application 2019 & 2032
- Table 14: United States Protein Chip Industry Volume (K Unit) Forecast, by Application 2019 & 2032
- Table 15: Canada Protein Chip Industry Revenue (Million) Forecast, by Application 2019 & 2032
- Table 16: Canada Protein Chip Industry Volume (K Unit) Forecast, by Application 2019 & 2032
- Table 17: Mexico Protein Chip Industry Revenue (Million) Forecast, by Application 2019 & 2032
- Table 18: Mexico Protein Chip Industry Volume (K Unit) Forecast, by Application 2019 & 2032
- Table 19: Global Protein Chip Industry Revenue Million Forecast, by Country 2019 & 2032
- Table 20: Global Protein Chip Industry Volume K Unit Forecast, by Country 2019 & 2032
- Table 21: Germany Protein Chip Industry Revenue (Million) Forecast, by Application 2019 & 2032
- Table 22: Germany Protein Chip Industry Volume (K Unit) Forecast, by Application 2019 & 2032
- Table 23: United Kingdom Protein Chip Industry Revenue (Million) Forecast, by Application 2019 & 2032
- Table 24: United Kingdom Protein Chip Industry Volume (K Unit) Forecast, by Application 2019 & 2032
- Table 25: France Protein Chip Industry Revenue (Million) Forecast, by Application 2019 & 2032
- Table 26: France Protein Chip Industry Volume (K Unit) Forecast, by Application 2019 & 2032
- Table 27: Italy Protein Chip Industry Revenue (Million) Forecast, by Application 2019 & 2032
- Table 28: Italy Protein Chip Industry Volume (K Unit) Forecast, by Application 2019 & 2032
- Table 29: Spain Protein Chip Industry Revenue (Million) Forecast, by Application 2019 & 2032
- Table 30: Spain Protein Chip Industry Volume (K Unit) Forecast, by Application 2019 & 2032
- Table 31: Rest of Europe Protein Chip Industry Revenue (Million) Forecast, by Application 2019 & 2032
- Table 32: Rest of Europe Protein Chip Industry Volume (K Unit) Forecast, by Application 2019 & 2032
- Table 33: Global Protein Chip Industry Revenue Million Forecast, by Country 2019 & 2032
- Table 34: Global Protein Chip Industry Volume K Unit Forecast, by Country 2019 & 2032
- Table 35: China Protein Chip Industry Revenue (Million) Forecast, by Application 2019 & 2032
- Table 36: China Protein Chip Industry Volume (K Unit) Forecast, by Application 2019 & 2032
- Table 37: Japan Protein Chip Industry Revenue (Million) Forecast, by Application 2019 & 2032
- Table 38: Japan Protein Chip Industry Volume (K Unit) Forecast, by Application 2019 & 2032
- Table 39: India Protein Chip Industry Revenue (Million) Forecast, by Application 2019 & 2032
- Table 40: India Protein Chip Industry Volume (K Unit) Forecast, by Application 2019 & 2032
- Table 41: Australia Protein Chip Industry Revenue (Million) Forecast, by Application 2019 & 2032
- Table 42: Australia Protein Chip Industry Volume (K Unit) Forecast, by Application 2019 & 2032
- Table 43: South Korea Protein Chip Industry Revenue (Million) Forecast, by Application 2019 & 2032
- Table 44: South Korea Protein Chip Industry Volume (K Unit) Forecast, by Application 2019 & 2032
- Table 45: Rest of Asia Pacific Protein Chip Industry Revenue (Million) Forecast, by Application 2019 & 2032
- Table 46: Rest of Asia Pacific Protein Chip Industry Volume (K Unit) Forecast, by Application 2019 & 2032
- Table 47: Global Protein Chip Industry Revenue Million Forecast, by Country 2019 & 2032
- Table 48: Global Protein Chip Industry Volume K Unit Forecast, by Country 2019 & 2032
- Table 49: GCC Protein Chip Industry Revenue (Million) Forecast, by Application 2019 & 2032
- Table 50: GCC Protein Chip Industry Volume (K Unit) Forecast, by Application 2019 & 2032
- Table 51: South Africa Protein Chip Industry Revenue (Million) Forecast, by Application 2019 & 2032
- Table 52: South Africa Protein Chip Industry Volume (K Unit) Forecast, by Application 2019 & 2032
- Table 53: Rest of Middle East and Africa Protein Chip Industry Revenue (Million) Forecast, by Application 2019 & 2032
- Table 54: Rest of Middle East and Africa Protein Chip Industry Volume (K Unit) Forecast, by Application 2019 & 2032
- Table 55: Global Protein Chip Industry Revenue Million Forecast, by Country 2019 & 2032
- Table 56: Global Protein Chip Industry Volume K Unit Forecast, by Country 2019 & 2032
- Table 57: Brazil Protein Chip Industry Revenue (Million) Forecast, by Application 2019 & 2032
- Table 58: Brazil Protein Chip Industry Volume (K Unit) Forecast, by Application 2019 & 2032
- Table 59: Argentina Protein Chip Industry Revenue (Million) Forecast, by Application 2019 & 2032
- Table 60: Argentina Protein Chip Industry Volume (K Unit) Forecast, by Application 2019 & 2032
- Table 61: Rest of South America Protein Chip Industry Revenue (Million) Forecast, by Application 2019 & 2032
- Table 62: Rest of South America Protein Chip Industry Volume (K Unit) Forecast, by Application 2019 & 2032
- Table 63: Global Protein Chip Industry Revenue Million Forecast, by Product Type 2019 & 2032
- Table 64: Global Protein Chip Industry Volume K Unit Forecast, by Product Type 2019 & 2032
- Table 65: Global Protein Chip Industry Revenue Million Forecast, by Application 2019 & 2032
- Table 66: Global Protein Chip Industry Volume K Unit Forecast, by Application 2019 & 2032
- Table 67: Global Protein Chip Industry Revenue Million Forecast, by End User 2019 & 2032
- Table 68: Global Protein Chip Industry Volume K Unit Forecast, by End User 2019 & 2032
- Table 69: Global Protein Chip Industry Revenue Million Forecast, by Country 2019 & 2032
- Table 70: Global Protein Chip Industry Volume K Unit Forecast, by Country 2019 & 2032
- Table 71: United States Protein Chip Industry Revenue (Million) Forecast, by Application 2019 & 2032
- Table 72: United States Protein Chip Industry Volume (K Unit) Forecast, by Application 2019 & 2032
- Table 73: Canada Protein Chip Industry Revenue (Million) Forecast, by Application 2019 & 2032
- Table 74: Canada Protein Chip Industry Volume (K Unit) Forecast, by Application 2019 & 2032
- Table 75: Mexico Protein Chip Industry Revenue (Million) Forecast, by Application 2019 & 2032
- Table 76: Mexico Protein Chip Industry Volume (K Unit) Forecast, by Application 2019 & 2032
- Table 77: Global Protein Chip Industry Revenue Million Forecast, by Product Type 2019 & 2032
- Table 78: Global Protein Chip Industry Volume K Unit Forecast, by Product Type 2019 & 2032
- Table 79: Global Protein Chip Industry Revenue Million Forecast, by Application 2019 & 2032
- Table 80: Global Protein Chip Industry Volume K Unit Forecast, by Application 2019 & 2032
- Table 81: Global Protein Chip Industry Revenue Million Forecast, by End User 2019 & 2032
- Table 82: Global Protein Chip Industry Volume K Unit Forecast, by End User 2019 & 2032
- Table 83: Global Protein Chip Industry Revenue Million Forecast, by Country 2019 & 2032
- Table 84: Global Protein Chip Industry Volume K Unit Forecast, by Country 2019 & 2032
- Table 85: Germany Protein Chip Industry Revenue (Million) Forecast, by Application 2019 & 2032
- Table 86: Germany Protein Chip Industry Volume (K Unit) Forecast, by Application 2019 & 2032
- Table 87: United Kingdom Protein Chip Industry Revenue (Million) Forecast, by Application 2019 & 2032
- Table 88: United Kingdom Protein Chip Industry Volume (K Unit) Forecast, by Application 2019 & 2032
- Table 89: France Protein Chip Industry Revenue (Million) Forecast, by Application 2019 & 2032
- Table 90: France Protein Chip Industry Volume (K Unit) Forecast, by Application 2019 & 2032
- Table 91: Italy Protein Chip Industry Revenue (Million) Forecast, by Application 2019 & 2032
- Table 92: Italy Protein Chip Industry Volume (K Unit) Forecast, by Application 2019 & 2032
- Table 93: Spain Protein Chip Industry Revenue (Million) Forecast, by Application 2019 & 2032
- Table 94: Spain Protein Chip Industry Volume (K Unit) Forecast, by Application 2019 & 2032
- Table 95: Rest of Europe Protein Chip Industry Revenue (Million) Forecast, by Application 2019 & 2032
- Table 96: Rest of Europe Protein Chip Industry Volume (K Unit) Forecast, by Application 2019 & 2032
- Table 97: Global Protein Chip Industry Revenue Million Forecast, by Product Type 2019 & 2032
- Table 98: Global Protein Chip Industry Volume K Unit Forecast, by Product Type 2019 & 2032
- Table 99: Global Protein Chip Industry Revenue Million Forecast, by Application 2019 & 2032
- Table 100: Global Protein Chip Industry Volume K Unit Forecast, by Application 2019 & 2032
- Table 101: Global Protein Chip Industry Revenue Million Forecast, by End User 2019 & 2032
- Table 102: Global Protein Chip Industry Volume K Unit Forecast, by End User 2019 & 2032
- Table 103: Global Protein Chip Industry Revenue Million Forecast, by Country 2019 & 2032
- Table 104: Global Protein Chip Industry Volume K Unit Forecast, by Country 2019 & 2032
- Table 105: China Protein Chip Industry Revenue (Million) Forecast, by Application 2019 & 2032
- Table 106: China Protein Chip Industry Volume (K Unit) Forecast, by Application 2019 & 2032
- Table 107: Japan Protein Chip Industry Revenue (Million) Forecast, by Application 2019 & 2032
- Table 108: Japan Protein Chip Industry Volume (K Unit) Forecast, by Application 2019 & 2032
- Table 109: India Protein Chip Industry Revenue (Million) Forecast, by Application 2019 & 2032
- Table 110: India Protein Chip Industry Volume (K Unit) Forecast, by Application 2019 & 2032
- Table 111: Australia Protein Chip Industry Revenue (Million) Forecast, by Application 2019 & 2032
- Table 112: Australia Protein Chip Industry Volume (K Unit) Forecast, by Application 2019 & 2032
- Table 113: South Korea Protein Chip Industry Revenue (Million) Forecast, by Application 2019 & 2032
- Table 114: South Korea Protein Chip Industry Volume (K Unit) Forecast, by Application 2019 & 2032
- Table 115: Rest of Asia Pacific Protein Chip Industry Revenue (Million) Forecast, by Application 2019 & 2032
- Table 116: Rest of Asia Pacific Protein Chip Industry Volume (K Unit) Forecast, by Application 2019 & 2032
- Table 117: Global Protein Chip Industry Revenue Million Forecast, by Product Type 2019 & 2032
- Table 118: Global Protein Chip Industry Volume K Unit Forecast, by Product Type 2019 & 2032
- Table 119: Global Protein Chip Industry Revenue Million Forecast, by Application 2019 & 2032
- Table 120: Global Protein Chip Industry Volume K Unit Forecast, by Application 2019 & 2032
- Table 121: Global Protein Chip Industry Revenue Million Forecast, by End User 2019 & 2032
- Table 122: Global Protein Chip Industry Volume K Unit Forecast, by End User 2019 & 2032
- Table 123: Global Protein Chip Industry Revenue Million Forecast, by Country 2019 & 2032
- Table 124: Global Protein Chip Industry Volume K Unit Forecast, by Country 2019 & 2032
- Table 125: GCC Protein Chip Industry Revenue (Million) Forecast, by Application 2019 & 2032
- Table 126: GCC Protein Chip Industry Volume (K Unit) Forecast, by Application 2019 & 2032
- Table 127: South Africa Protein Chip Industry Revenue (Million) Forecast, by Application 2019 & 2032
- Table 128: South Africa Protein Chip Industry Volume (K Unit) Forecast, by Application 2019 & 2032
- Table 129: Rest of Middle East and Africa Protein Chip Industry Revenue (Million) Forecast, by Application 2019 & 2032
- Table 130: Rest of Middle East and Africa Protein Chip Industry Volume (K Unit) Forecast, by Application 2019 & 2032
- Table 131: Global Protein Chip Industry Revenue Million Forecast, by Product Type 2019 & 2032
- Table 132: Global Protein Chip Industry Volume K Unit Forecast, by Product Type 2019 & 2032
- Table 133: Global Protein Chip Industry Revenue Million Forecast, by Application 2019 & 2032
- Table 134: Global Protein Chip Industry Volume K Unit Forecast, by Application 2019 & 2032
- Table 135: Global Protein Chip Industry Revenue Million Forecast, by End User 2019 & 2032
- Table 136: Global Protein Chip Industry Volume K Unit Forecast, by End User 2019 & 2032
- Table 137: Global Protein Chip Industry Revenue Million Forecast, by Country 2019 & 2032
- Table 138: Global Protein Chip Industry Volume K Unit Forecast, by Country 2019 & 2032
- Table 139: Brazil Protein Chip Industry Revenue (Million) Forecast, by Application 2019 & 2032
- Table 140: Brazil Protein Chip Industry Volume (K Unit) Forecast, by Application 2019 & 2032
- Table 141: Argentina Protein Chip Industry Revenue (Million) Forecast, by Application 2019 & 2032
- Table 142: Argentina Protein Chip Industry Volume (K Unit) Forecast, by Application 2019 & 2032
- Table 143: Rest of South America Protein Chip Industry Revenue (Million) Forecast, by Application 2019 & 2032
- Table 144: Rest of South America Protein Chip Industry Volume (K Unit) Forecast, by Application 2019 & 2032
Frequently Asked Questions
1. What is the projected Compound Annual Growth Rate (CAGR) of the Protein Chip Industry?
The projected CAGR is approximately 11.73%.
2. Which companies are prominent players in the Protein Chip Industry?
Key companies in the market include Promega Corporation, Bio-Rad Laboratories Inc, Merck KGaA, Abcam Plc, F Hoffmann-La Roche Ltd, Cell Signaling Technology Inc, Danaher Corporation, Qiagen, PerkinElmer Inc, Thermo Fisher Scientific.
3. What are the main segments of the Protein Chip Industry?
The market segments include Product Type, Application, End User.
4. Can you provide details about the market size?
The market size is estimated to be USD 2.03 Million as of 2022.
5. What are some drivers contributing to market growth?
Increasing Incidence of Chronic and Infectious Diseases; Technological Advancements in Protein Assay Techniques; Increasing Expenditure on Pharmaceutical and Biological Research and Development.
6. What are the notable trends driving market growth?
Drug Discovery and Development Segment is Expected to Hold a Significant Share in the Protein Assay Market during the Forecast Period of the Study.
7. Are there any restraints impacting market growth?
High Cost of Multiplex Assay Equipment.
8. Can you provide examples of recent developments in the market?
In March 2022, Biognosys launched an expanded suite of proteomics platforms that provide pharmaceutical and diagnostics customers with deep biological insights across the entire R&D pipeline, from early-stage discovery to clinical settings.
9. What pricing options are available for accessing the report?
Pricing options include single-user, multi-user, and enterprise licenses priced at USD 4750, USD 5250, and USD 8750 respectively.
10. Is the market size provided in terms of value or volume?
The market size is provided in terms of value, measured in Million and volume, measured in K Unit.
11. Are there any specific market keywords associated with the report?
Yes, the market keyword associated with the report is "Protein Chip Industry," which aids in identifying and referencing the specific market segment covered.
12. How do I determine which pricing option suits my needs best?
The pricing options vary based on user requirements and access needs. Individual users may opt for single-user licenses, while businesses requiring broader access may choose multi-user or enterprise licenses for cost-effective access to the report.
13. Are there any additional resources or data provided in the Protein Chip Industry report?
While the report offers comprehensive insights, it's advisable to review the specific contents or supplementary materials provided to ascertain if additional resources or data are available.
14. How can I stay updated on further developments or reports in the Protein Chip Industry?
To stay informed about further developments, trends, and reports in the Protein Chip Industry, consider subscribing to industry newsletters, following relevant companies and organizations, or regularly checking reputable industry news sources and publications.
Methodology
Step 1 - Identification of Relevant Samples Size from Population Database


Step 2 - Approaches for Defining Global Market Size (Value, Volume* & Price*)

Note*: In applicable scenarios
Step 3 - Data Sources
Primary Research
- Web Analytics
- Survey Reports
- Research Institute
- Latest Research Reports
- Opinion Leaders
Secondary Research
- Annual Reports
- White Paper
- Latest Press Release
- Industry Association
- Paid Database
- Investor Presentations

Step 4 - Data Triangulation
Involves using different sources of information in order to increase the validity of a study
These sources are likely to be stakeholders in a program - participants, other researchers, program staff, other community members, and so on.
Then we put all data in single framework & apply various statistical tools to find out the dynamic on the market.
During the analysis stage, feedback from the stakeholder groups would be compared to determine areas of agreement as well as areas of divergence


