
Key Insights
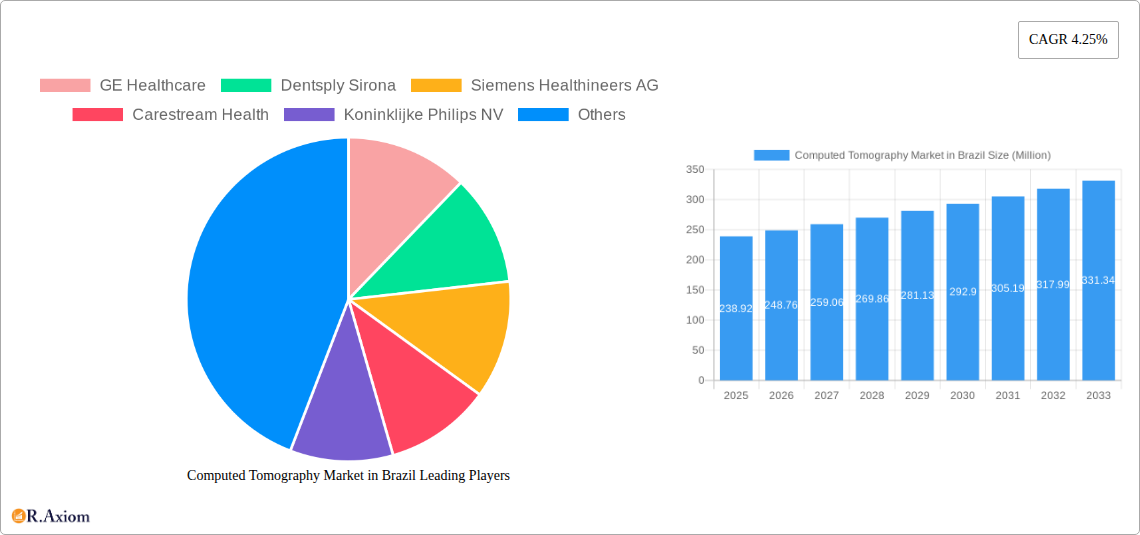
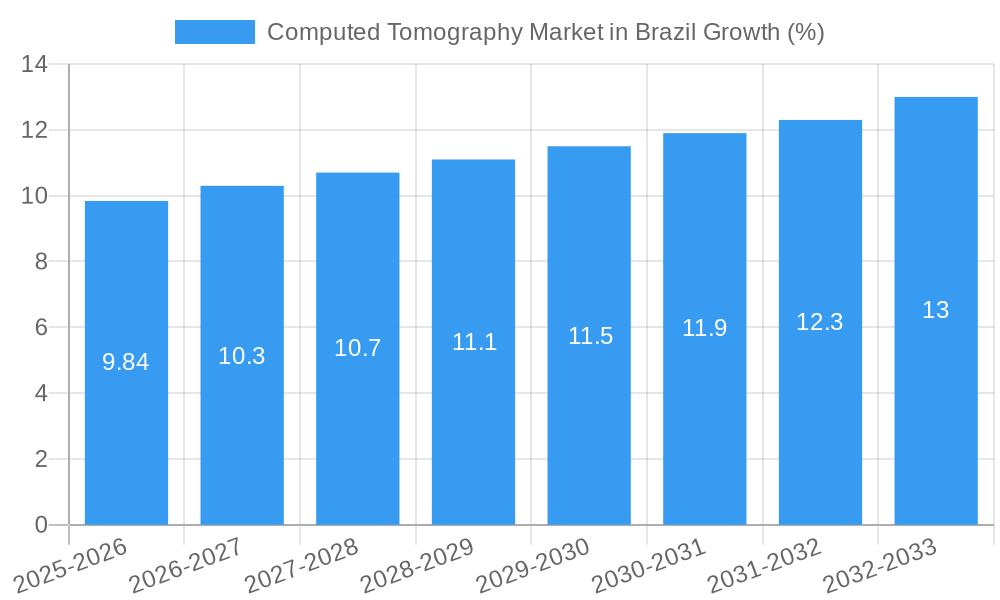
The Brazilian Computed Tomography (CT) market, valued at $238.92 million in 2025, is projected to experience robust growth, driven by factors such as increasing prevalence of chronic diseases (cancer, cardiovascular conditions, neurological disorders), rising healthcare expenditure, and technological advancements leading to improved image quality and faster scan times. The market is segmented by type (low, medium, and high slice CT scanners), application (oncology, neurology, cardiovascular, musculoskeletal, and other applications), and end-user (hospitals, diagnostic centers, and other end-users). While hospitals currently dominate the end-user segment, the growing number of specialized diagnostic centers is expected to fuel segment growth. Technological advancements, such as multi-slice CT scanners and advanced image reconstruction techniques, are key market drivers, enhancing diagnostic capabilities and reducing examination times. However, the high cost of equipment and maintenance, coupled with the need for skilled professionals to operate and interpret CT scans, present challenges to market expansion. The market's growth is further influenced by government initiatives to improve healthcare infrastructure and expand access to advanced medical technologies within Brazil. Given the 4.25% CAGR, the market is expected to continue its steady expansion over the forecast period (2025-2033), with significant opportunities for established players like GE Healthcare, Siemens Healthineers AG, and Philips, as well as emerging players seeking to penetrate this lucrative market.
The competitive landscape is characterized by both established multinational corporations and regional players. These companies are engaged in intense competition, focusing on product innovation, strategic partnerships, and acquisitions to maintain their market share and expand their reach. Growth within specific application segments, particularly oncology and cardiology, is expected to outpace other segments due to the increasing incidence of related diseases. The market's future prospects remain positive, contingent on continued investment in healthcare infrastructure and sustained economic growth in Brazil. Furthermore, the expansion of private healthcare provision and the increasing adoption of advanced imaging techniques in smaller cities and rural areas will likely contribute to significant market expansion in the coming years.
Computed Tomography Market in Brazil: A Comprehensive Market Report (2019-2033)
This in-depth report provides a comprehensive analysis of the Computed Tomography (CT) market in Brazil, offering actionable insights for industry stakeholders. The study period spans from 2019 to 2033, with 2025 serving as the base and estimated year. The report meticulously examines market size, segmentation, growth drivers, challenges, and opportunities within the Brazilian CT landscape.
Computed Tomography Market in Brazil Market Concentration & Innovation
This section analyzes the competitive landscape of the Brazilian CT market, examining market concentration, innovation drivers, regulatory influences, and key industry developments. The report assesses the market share held by major players like GE Healthcare, Dentsply Sirona, Siemens Healthineers AG, Carestream Health, Koninklijke Philips NV, Canon Medical Systems Corporation, Samsung Medison, and Planmeca Group (Planmed OY). Market concentration is evaluated using metrics like the Herfindahl-Hirschman Index (HHI), illustrating the degree of competition and the dominance of key players. The report quantifies the impact of mergers and acquisitions (M&A) activities, including deal values where available. Innovation is assessed through the analysis of new product launches, technological advancements (e.g., multi-slice CT, AI-powered image analysis), and the adoption of these innovations in the Brazilian healthcare system. Regulatory frameworks influencing market access and product approvals are also explored. The analysis incorporates data on product substitutes, their market penetration, and their impact on the CT market. Finally, the evolution of end-user preferences and trends influencing market dynamics are examined. The section concludes with a projection of future market concentration based on anticipated M&A activity and technological advancements. For instance, while the exact M&A deal values aren't publicly available for all transactions, the report assesses the overall impact of such activities on the market structure and competitiveness, considering factors like market share changes and pricing strategies post-acquisition.
Computed Tomography Market in Brazil Industry Trends & Insights
This section delves into the key trends and insights shaping the Brazilian CT market. It analyzes market growth drivers, including increasing prevalence of chronic diseases necessitating advanced diagnostic imaging, expanding healthcare infrastructure, and rising government initiatives to improve healthcare access. The report examines technological disruptions like the adoption of multi-slice CT scanners, AI-driven image analysis, and mobile CT units. Consumer preferences regarding diagnostic speed, image quality, and radiation exposure are analyzed. The competitive dynamics are assessed through a detailed comparison of major players based on their product portfolios, market strategies, and technological capabilities. The report quantifies market growth using the Compound Annual Growth Rate (CAGR) for the historical period (2019-2024) and provides a forecast for the future period (2025-2033). Market penetration rates for different types of CT scanners (low-slice, medium-slice, high-slice) are also analyzed to provide a nuanced understanding of market evolution. The report highlights the current market size (xx Million) and provides a forecast for 2033 (xx Million).
Dominant Markets & Segments in Computed Tomography Market in Brazil
This section identifies the leading segments within the Brazilian CT market based on type (low-slice, medium-slice, high-slice), application (oncology, neurology, cardiovascular, musculoskeletal, other), and end-user (hospitals, diagnostic centers, other). The analysis is supported by detailed explanations of the key drivers behind the dominance of each segment.
- Type: The report will identify the dominant CT scanner type (e.g., high-slice due to its superior image quality and diagnostic capabilities) and justify its market leadership.
- Application: This section will pinpoint the leading application area (e.g., oncology due to the high prevalence of cancer and the necessity of precise CT scans for diagnosis and treatment planning) and provide a rationale.
- End-User: This segment will highlight the primary end-user (e.g., hospitals due to their greater capacity to invest in advanced medical equipment and their large patient volumes) and analyze the factors contributing to their market share.
For each segment, the report will present detailed data such as market size (in Million), growth projections, and competitive dynamics using a combination of bullet points and paragraphs. Factors such as economic policies impacting healthcare spending, infrastructure development, and regional variations in healthcare access are incorporated into the analysis to justify segment dominance.
Computed Tomography Market in Brazil Product Developments
Recent years have witnessed significant advancements in CT technology, including the introduction of multi-slice CT scanners with improved image resolution and reduced radiation exposure. AI-powered image analysis tools are being integrated into CT systems to enhance diagnostic accuracy and workflow efficiency. Mobile CT units are gaining traction, particularly in regions with limited access to healthcare. These developments cater to the growing demand for faster, more precise, and accessible diagnostic imaging solutions, offering competitive advantages to providers who embrace them.
Report Scope & Segmentation Analysis
This report comprehensively segments the Brazilian CT market based on:
Type: Low-slice, Medium-slice, and High-slice CT scanners, each with specific growth projections and market size estimates (in Million) for the forecast period (2025-2033). Competitive dynamics within each type segment will be explored.
Application: Oncology, Neurology, Cardiovascular, Musculoskeletal, and Other Applications, with corresponding market size estimations (in Million), growth rates, and competitive landscape analyses.
End-User: Hospitals, Diagnostic Centers, and Other End Users, with individual market size breakdowns (in Million), growth projections, and competitive analyses considering market share, pricing strategies, and customer acquisition tactics.
Key Drivers of Computed Tomography Market in Brazil Growth
The growth of the Brazilian CT market is primarily driven by several factors: an increasing prevalence of chronic diseases requiring advanced imaging, substantial investments in healthcare infrastructure by both the public and private sectors, rising disposable incomes enabling greater access to private healthcare, and government initiatives focusing on improving healthcare access and quality. Technological advancements, such as the development of multi-slice CT scanners and AI-driven image analysis, further contribute to market expansion. Favorable regulatory policies facilitating market entry and product approvals also play a significant role.
Challenges in the Computed Tomography Market in Brazil Sector
The Brazilian CT market faces several challenges, including high equipment costs, limitations in healthcare infrastructure in certain regions, stringent regulatory requirements impacting market access and approvals, and a competitive landscape with both established international and local players. These factors can limit market growth, particularly in underserved areas. Supply chain disruptions and currency fluctuations also pose significant challenges. The report quantifies the impact of these challenges on market growth and estimates potential revenue losses caused by these factors (xx Million).
Emerging Opportunities in Computed Tomography Market in Brazil
Several opportunities exist for growth within the Brazilian CT market. The expanding private healthcare sector presents a significant opportunity for CT equipment providers. The rising adoption of telemedicine and remote diagnostic services presents a new avenue for growth, and the potential for expansion into underserved regions offers substantial market penetration opportunities. Government initiatives to improve healthcare infrastructure and increase access to advanced diagnostics create a positive outlook. The integration of AI and machine learning into CT systems is an important emerging trend with considerable market potential.
Leading Players in the Computed Tomography Market in Brazil Market
- GE Healthcare
- Dentsply Sirona
- Siemens Healthineers AG
- Carestream Health
- Koninklijke Philips NV
- Canon Medical Systems Corporation
- Samsung Medison
- Planmeca Group (Planmed OY)
Key Developments in Computed Tomography Market in Brazil Industry
- November 2020: Samsung NeuroLogica Mobile Stroke CT scanner donation to Santa Lucia Hospital Network in Brasilia, showcasing increased access to advanced technology in underserved areas.
- June 2020: Partnership between Agfa and VMI Technologies to launch computed tomography production in Brazil, signifying a shift towards local manufacturing and potential cost reductions.
Strategic Outlook for Computed Tomography Market in Brazil Market
The Brazilian CT market exhibits significant growth potential driven by factors such as increasing disease prevalence, infrastructure development, and technological advancements. The rising adoption of private healthcare and government support for healthcare improvement initiatives further contribute to a positive outlook. Strategic opportunities exist for players focusing on affordable, high-quality CT solutions and those targeting underserved regions with mobile or compact systems. The market's future growth is contingent upon addressing challenges related to cost, infrastructure, and regulatory hurdles. The long-term outlook remains optimistic, anticipating substantial market expansion over the forecast period (2025-2033).
Computed Tomography Market in Brazil Segmentation
-
1. Type
- 1.1. Low Slice
- 1.2. Medium Slice
- 1.3. High Slice
-
2. Application
- 2.1. Oncology
- 2.2. Neurology
- 2.3. Cardiovascular
- 2.4. Musculoskeletal
- 2.5. Other Applications
-
3. End User
- 3.1. Hospitals
- 3.2. Diagnostic Centers
- 3.3. Other End Users
Computed Tomography Market in Brazil Segmentation By Geography
-
1. North America
- 1.1. United States
- 1.2. Canada
- 1.3. Mexico
-
2. South America
- 2.1. Brazil
- 2.2. Argentina
- 2.3. Rest of South America
-
3. Europe
- 3.1. United Kingdom
- 3.2. Germany
- 3.3. France
- 3.4. Italy
- 3.5. Spain
- 3.6. Russia
- 3.7. Benelux
- 3.8. Nordics
- 3.9. Rest of Europe
-
4. Middle East & Africa
- 4.1. Turkey
- 4.2. Israel
- 4.3. GCC
- 4.4. North Africa
- 4.5. South Africa
- 4.6. Rest of Middle East & Africa
-
5. Asia Pacific
- 5.1. China
- 5.2. India
- 5.3. Japan
- 5.4. South Korea
- 5.5. ASEAN
- 5.6. Oceania
- 5.7. Rest of Asia Pacific
Computed Tomography Market in Brazil REPORT HIGHLIGHTS
| Aspects | Details |
|---|---|
| Study Period | 2019-2033 |
| Base Year | 2024 |
| Estimated Year | 2025 |
| Forecast Period | 2025-2033 |
| Historical Period | 2019-2024 |
| Growth Rate | CAGR of 4.25% from 2019-2033 |
| Segmentation |
|
Table of Contents
- 1. Introduction
- 1.1. Research Scope
- 1.2. Market Segmentation
- 1.3. Research Methodology
- 1.4. Definitions and Assumptions
- 2. Executive Summary
- 2.1. Introduction
- 3. Market Dynamics
- 3.1. Introduction
- 3.2. Market Drivers
- 3.2.1. Increasing Prevalence of Chronic Diseases; Rising Geriatric Population; Increasing Technological Advancements
- 3.3. Market Restrains
- 3.3.1. Lack Of Proper Reimbursement And Stringent Regulatory Approval Procedures; High Cost of Equipment
- 3.4. Market Trends
- 3.4.1. Oncology Segment is Expected to Hold a Significant Market Share Over the Forecast Period
- 4. Market Factor Analysis
- 4.1. Porters Five Forces
- 4.2. Supply/Value Chain
- 4.3. PESTEL analysis
- 4.4. Market Entropy
- 4.5. Patent/Trademark Analysis
- 5. Global Computed Tomography Market in Brazil Analysis, Insights and Forecast, 2019-2031
- 5.1. Market Analysis, Insights and Forecast - by Type
- 5.1.1. Low Slice
- 5.1.2. Medium Slice
- 5.1.3. High Slice
- 5.2. Market Analysis, Insights and Forecast - by Application
- 5.2.1. Oncology
- 5.2.2. Neurology
- 5.2.3. Cardiovascular
- 5.2.4. Musculoskeletal
- 5.2.5. Other Applications
- 5.3. Market Analysis, Insights and Forecast - by End User
- 5.3.1. Hospitals
- 5.3.2. Diagnostic Centers
- 5.3.3. Other End Users
- 5.4. Market Analysis, Insights and Forecast - by Region
- 5.4.1. North America
- 5.4.2. South America
- 5.4.3. Europe
- 5.4.4. Middle East & Africa
- 5.4.5. Asia Pacific
- 5.1. Market Analysis, Insights and Forecast - by Type
- 6. North America Computed Tomography Market in Brazil Analysis, Insights and Forecast, 2019-2031
- 6.1. Market Analysis, Insights and Forecast - by Type
- 6.1.1. Low Slice
- 6.1.2. Medium Slice
- 6.1.3. High Slice
- 6.2. Market Analysis, Insights and Forecast - by Application
- 6.2.1. Oncology
- 6.2.2. Neurology
- 6.2.3. Cardiovascular
- 6.2.4. Musculoskeletal
- 6.2.5. Other Applications
- 6.3. Market Analysis, Insights and Forecast - by End User
- 6.3.1. Hospitals
- 6.3.2. Diagnostic Centers
- 6.3.3. Other End Users
- 6.1. Market Analysis, Insights and Forecast - by Type
- 7. South America Computed Tomography Market in Brazil Analysis, Insights and Forecast, 2019-2031
- 7.1. Market Analysis, Insights and Forecast - by Type
- 7.1.1. Low Slice
- 7.1.2. Medium Slice
- 7.1.3. High Slice
- 7.2. Market Analysis, Insights and Forecast - by Application
- 7.2.1. Oncology
- 7.2.2. Neurology
- 7.2.3. Cardiovascular
- 7.2.4. Musculoskeletal
- 7.2.5. Other Applications
- 7.3. Market Analysis, Insights and Forecast - by End User
- 7.3.1. Hospitals
- 7.3.2. Diagnostic Centers
- 7.3.3. Other End Users
- 7.1. Market Analysis, Insights and Forecast - by Type
- 8. Europe Computed Tomography Market in Brazil Analysis, Insights and Forecast, 2019-2031
- 8.1. Market Analysis, Insights and Forecast - by Type
- 8.1.1. Low Slice
- 8.1.2. Medium Slice
- 8.1.3. High Slice
- 8.2. Market Analysis, Insights and Forecast - by Application
- 8.2.1. Oncology
- 8.2.2. Neurology
- 8.2.3. Cardiovascular
- 8.2.4. Musculoskeletal
- 8.2.5. Other Applications
- 8.3. Market Analysis, Insights and Forecast - by End User
- 8.3.1. Hospitals
- 8.3.2. Diagnostic Centers
- 8.3.3. Other End Users
- 8.1. Market Analysis, Insights and Forecast - by Type
- 9. Middle East & Africa Computed Tomography Market in Brazil Analysis, Insights and Forecast, 2019-2031
- 9.1. Market Analysis, Insights and Forecast - by Type
- 9.1.1. Low Slice
- 9.1.2. Medium Slice
- 9.1.3. High Slice
- 9.2. Market Analysis, Insights and Forecast - by Application
- 9.2.1. Oncology
- 9.2.2. Neurology
- 9.2.3. Cardiovascular
- 9.2.4. Musculoskeletal
- 9.2.5. Other Applications
- 9.3. Market Analysis, Insights and Forecast - by End User
- 9.3.1. Hospitals
- 9.3.2. Diagnostic Centers
- 9.3.3. Other End Users
- 9.1. Market Analysis, Insights and Forecast - by Type
- 10. Asia Pacific Computed Tomography Market in Brazil Analysis, Insights and Forecast, 2019-2031
- 10.1. Market Analysis, Insights and Forecast - by Type
- 10.1.1. Low Slice
- 10.1.2. Medium Slice
- 10.1.3. High Slice
- 10.2. Market Analysis, Insights and Forecast - by Application
- 10.2.1. Oncology
- 10.2.2. Neurology
- 10.2.3. Cardiovascular
- 10.2.4. Musculoskeletal
- 10.2.5. Other Applications
- 10.3. Market Analysis, Insights and Forecast - by End User
- 10.3.1. Hospitals
- 10.3.2. Diagnostic Centers
- 10.3.3. Other End Users
- 10.1. Market Analysis, Insights and Forecast - by Type
- 11. Competitive Analysis
- 11.1. Global Market Share Analysis 2024
- 11.2. Company Profiles
- 11.2.1 GE Healthcare
- 11.2.1.1. Overview
- 11.2.1.2. Products
- 11.2.1.3. SWOT Analysis
- 11.2.1.4. Recent Developments
- 11.2.1.5. Financials (Based on Availability)
- 11.2.2 Dentsply Sirona
- 11.2.2.1. Overview
- 11.2.2.2. Products
- 11.2.2.3. SWOT Analysis
- 11.2.2.4. Recent Developments
- 11.2.2.5. Financials (Based on Availability)
- 11.2.3 Siemens Healthineers AG
- 11.2.3.1. Overview
- 11.2.3.2. Products
- 11.2.3.3. SWOT Analysis
- 11.2.3.4. Recent Developments
- 11.2.3.5. Financials (Based on Availability)
- 11.2.4 Carestream Health
- 11.2.4.1. Overview
- 11.2.4.2. Products
- 11.2.4.3. SWOT Analysis
- 11.2.4.4. Recent Developments
- 11.2.4.5. Financials (Based on Availability)
- 11.2.5 Koninklijke Philips NV
- 11.2.5.1. Overview
- 11.2.5.2. Products
- 11.2.5.3. SWOT Analysis
- 11.2.5.4. Recent Developments
- 11.2.5.5. Financials (Based on Availability)
- 11.2.6 Canon Medical Systems Corporation
- 11.2.6.1. Overview
- 11.2.6.2. Products
- 11.2.6.3. SWOT Analysis
- 11.2.6.4. Recent Developments
- 11.2.6.5. Financials (Based on Availability)
- 11.2.7 Samsung Medison
- 11.2.7.1. Overview
- 11.2.7.2. Products
- 11.2.7.3. SWOT Analysis
- 11.2.7.4. Recent Developments
- 11.2.7.5. Financials (Based on Availability)
- 11.2.8 Planmeca Group (Planmed OY)
- 11.2.8.1. Overview
- 11.2.8.2. Products
- 11.2.8.3. SWOT Analysis
- 11.2.8.4. Recent Developments
- 11.2.8.5. Financials (Based on Availability)
- 11.2.1 GE Healthcare
List of Figures
- Figure 1: Global Computed Tomography Market in Brazil Revenue Breakdown (Million, %) by Region 2024 & 2032
- Figure 2: Brazil Computed Tomography Market in Brazil Revenue (Million), by Country 2024 & 2032
- Figure 3: Brazil Computed Tomography Market in Brazil Revenue Share (%), by Country 2024 & 2032
- Figure 4: North America Computed Tomography Market in Brazil Revenue (Million), by Type 2024 & 2032
- Figure 5: North America Computed Tomography Market in Brazil Revenue Share (%), by Type 2024 & 2032
- Figure 6: North America Computed Tomography Market in Brazil Revenue (Million), by Application 2024 & 2032
- Figure 7: North America Computed Tomography Market in Brazil Revenue Share (%), by Application 2024 & 2032
- Figure 8: North America Computed Tomography Market in Brazil Revenue (Million), by End User 2024 & 2032
- Figure 9: North America Computed Tomography Market in Brazil Revenue Share (%), by End User 2024 & 2032
- Figure 10: North America Computed Tomography Market in Brazil Revenue (Million), by Country 2024 & 2032
- Figure 11: North America Computed Tomography Market in Brazil Revenue Share (%), by Country 2024 & 2032
- Figure 12: South America Computed Tomography Market in Brazil Revenue (Million), by Type 2024 & 2032
- Figure 13: South America Computed Tomography Market in Brazil Revenue Share (%), by Type 2024 & 2032
- Figure 14: South America Computed Tomography Market in Brazil Revenue (Million), by Application 2024 & 2032
- Figure 15: South America Computed Tomography Market in Brazil Revenue Share (%), by Application 2024 & 2032
- Figure 16: South America Computed Tomography Market in Brazil Revenue (Million), by End User 2024 & 2032
- Figure 17: South America Computed Tomography Market in Brazil Revenue Share (%), by End User 2024 & 2032
- Figure 18: South America Computed Tomography Market in Brazil Revenue (Million), by Country 2024 & 2032
- Figure 19: South America Computed Tomography Market in Brazil Revenue Share (%), by Country 2024 & 2032
- Figure 20: Europe Computed Tomography Market in Brazil Revenue (Million), by Type 2024 & 2032
- Figure 21: Europe Computed Tomography Market in Brazil Revenue Share (%), by Type 2024 & 2032
- Figure 22: Europe Computed Tomography Market in Brazil Revenue (Million), by Application 2024 & 2032
- Figure 23: Europe Computed Tomography Market in Brazil Revenue Share (%), by Application 2024 & 2032
- Figure 24: Europe Computed Tomography Market in Brazil Revenue (Million), by End User 2024 & 2032
- Figure 25: Europe Computed Tomography Market in Brazil Revenue Share (%), by End User 2024 & 2032
- Figure 26: Europe Computed Tomography Market in Brazil Revenue (Million), by Country 2024 & 2032
- Figure 27: Europe Computed Tomography Market in Brazil Revenue Share (%), by Country 2024 & 2032
- Figure 28: Middle East & Africa Computed Tomography Market in Brazil Revenue (Million), by Type 2024 & 2032
- Figure 29: Middle East & Africa Computed Tomography Market in Brazil Revenue Share (%), by Type 2024 & 2032
- Figure 30: Middle East & Africa Computed Tomography Market in Brazil Revenue (Million), by Application 2024 & 2032
- Figure 31: Middle East & Africa Computed Tomography Market in Brazil Revenue Share (%), by Application 2024 & 2032
- Figure 32: Middle East & Africa Computed Tomography Market in Brazil Revenue (Million), by End User 2024 & 2032
- Figure 33: Middle East & Africa Computed Tomography Market in Brazil Revenue Share (%), by End User 2024 & 2032
- Figure 34: Middle East & Africa Computed Tomography Market in Brazil Revenue (Million), by Country 2024 & 2032
- Figure 35: Middle East & Africa Computed Tomography Market in Brazil Revenue Share (%), by Country 2024 & 2032
- Figure 36: Asia Pacific Computed Tomography Market in Brazil Revenue (Million), by Type 2024 & 2032
- Figure 37: Asia Pacific Computed Tomography Market in Brazil Revenue Share (%), by Type 2024 & 2032
- Figure 38: Asia Pacific Computed Tomography Market in Brazil Revenue (Million), by Application 2024 & 2032
- Figure 39: Asia Pacific Computed Tomography Market in Brazil Revenue Share (%), by Application 2024 & 2032
- Figure 40: Asia Pacific Computed Tomography Market in Brazil Revenue (Million), by End User 2024 & 2032
- Figure 41: Asia Pacific Computed Tomography Market in Brazil Revenue Share (%), by End User 2024 & 2032
- Figure 42: Asia Pacific Computed Tomography Market in Brazil Revenue (Million), by Country 2024 & 2032
- Figure 43: Asia Pacific Computed Tomography Market in Brazil Revenue Share (%), by Country 2024 & 2032
List of Tables
- Table 1: Global Computed Tomography Market in Brazil Revenue Million Forecast, by Region 2019 & 2032
- Table 2: Global Computed Tomography Market in Brazil Revenue Million Forecast, by Type 2019 & 2032
- Table 3: Global Computed Tomography Market in Brazil Revenue Million Forecast, by Application 2019 & 2032
- Table 4: Global Computed Tomography Market in Brazil Revenue Million Forecast, by End User 2019 & 2032
- Table 5: Global Computed Tomography Market in Brazil Revenue Million Forecast, by Region 2019 & 2032
- Table 6: Global Computed Tomography Market in Brazil Revenue Million Forecast, by Country 2019 & 2032
- Table 7: Global Computed Tomography Market in Brazil Revenue Million Forecast, by Type 2019 & 2032
- Table 8: Global Computed Tomography Market in Brazil Revenue Million Forecast, by Application 2019 & 2032
- Table 9: Global Computed Tomography Market in Brazil Revenue Million Forecast, by End User 2019 & 2032
- Table 10: Global Computed Tomography Market in Brazil Revenue Million Forecast, by Country 2019 & 2032
- Table 11: United States Computed Tomography Market in Brazil Revenue (Million) Forecast, by Application 2019 & 2032
- Table 12: Canada Computed Tomography Market in Brazil Revenue (Million) Forecast, by Application 2019 & 2032
- Table 13: Mexico Computed Tomography Market in Brazil Revenue (Million) Forecast, by Application 2019 & 2032
- Table 14: Global Computed Tomography Market in Brazil Revenue Million Forecast, by Type 2019 & 2032
- Table 15: Global Computed Tomography Market in Brazil Revenue Million Forecast, by Application 2019 & 2032
- Table 16: Global Computed Tomography Market in Brazil Revenue Million Forecast, by End User 2019 & 2032
- Table 17: Global Computed Tomography Market in Brazil Revenue Million Forecast, by Country 2019 & 2032
- Table 18: Brazil Computed Tomography Market in Brazil Revenue (Million) Forecast, by Application 2019 & 2032
- Table 19: Argentina Computed Tomography Market in Brazil Revenue (Million) Forecast, by Application 2019 & 2032
- Table 20: Rest of South America Computed Tomography Market in Brazil Revenue (Million) Forecast, by Application 2019 & 2032
- Table 21: Global Computed Tomography Market in Brazil Revenue Million Forecast, by Type 2019 & 2032
- Table 22: Global Computed Tomography Market in Brazil Revenue Million Forecast, by Application 2019 & 2032
- Table 23: Global Computed Tomography Market in Brazil Revenue Million Forecast, by End User 2019 & 2032
- Table 24: Global Computed Tomography Market in Brazil Revenue Million Forecast, by Country 2019 & 2032
- Table 25: United Kingdom Computed Tomography Market in Brazil Revenue (Million) Forecast, by Application 2019 & 2032
- Table 26: Germany Computed Tomography Market in Brazil Revenue (Million) Forecast, by Application 2019 & 2032
- Table 27: France Computed Tomography Market in Brazil Revenue (Million) Forecast, by Application 2019 & 2032
- Table 28: Italy Computed Tomography Market in Brazil Revenue (Million) Forecast, by Application 2019 & 2032
- Table 29: Spain Computed Tomography Market in Brazil Revenue (Million) Forecast, by Application 2019 & 2032
- Table 30: Russia Computed Tomography Market in Brazil Revenue (Million) Forecast, by Application 2019 & 2032
- Table 31: Benelux Computed Tomography Market in Brazil Revenue (Million) Forecast, by Application 2019 & 2032
- Table 32: Nordics Computed Tomography Market in Brazil Revenue (Million) Forecast, by Application 2019 & 2032
- Table 33: Rest of Europe Computed Tomography Market in Brazil Revenue (Million) Forecast, by Application 2019 & 2032
- Table 34: Global Computed Tomography Market in Brazil Revenue Million Forecast, by Type 2019 & 2032
- Table 35: Global Computed Tomography Market in Brazil Revenue Million Forecast, by Application 2019 & 2032
- Table 36: Global Computed Tomography Market in Brazil Revenue Million Forecast, by End User 2019 & 2032
- Table 37: Global Computed Tomography Market in Brazil Revenue Million Forecast, by Country 2019 & 2032
- Table 38: Turkey Computed Tomography Market in Brazil Revenue (Million) Forecast, by Application 2019 & 2032
- Table 39: Israel Computed Tomography Market in Brazil Revenue (Million) Forecast, by Application 2019 & 2032
- Table 40: GCC Computed Tomography Market in Brazil Revenue (Million) Forecast, by Application 2019 & 2032
- Table 41: North Africa Computed Tomography Market in Brazil Revenue (Million) Forecast, by Application 2019 & 2032
- Table 42: South Africa Computed Tomography Market in Brazil Revenue (Million) Forecast, by Application 2019 & 2032
- Table 43: Rest of Middle East & Africa Computed Tomography Market in Brazil Revenue (Million) Forecast, by Application 2019 & 2032
- Table 44: Global Computed Tomography Market in Brazil Revenue Million Forecast, by Type 2019 & 2032
- Table 45: Global Computed Tomography Market in Brazil Revenue Million Forecast, by Application 2019 & 2032
- Table 46: Global Computed Tomography Market in Brazil Revenue Million Forecast, by End User 2019 & 2032
- Table 47: Global Computed Tomography Market in Brazil Revenue Million Forecast, by Country 2019 & 2032
- Table 48: China Computed Tomography Market in Brazil Revenue (Million) Forecast, by Application 2019 & 2032
- Table 49: India Computed Tomography Market in Brazil Revenue (Million) Forecast, by Application 2019 & 2032
- Table 50: Japan Computed Tomography Market in Brazil Revenue (Million) Forecast, by Application 2019 & 2032
- Table 51: South Korea Computed Tomography Market in Brazil Revenue (Million) Forecast, by Application 2019 & 2032
- Table 52: ASEAN Computed Tomography Market in Brazil Revenue (Million) Forecast, by Application 2019 & 2032
- Table 53: Oceania Computed Tomography Market in Brazil Revenue (Million) Forecast, by Application 2019 & 2032
- Table 54: Rest of Asia Pacific Computed Tomography Market in Brazil Revenue (Million) Forecast, by Application 2019 & 2032
Frequently Asked Questions
1. What is the projected Compound Annual Growth Rate (CAGR) of the Computed Tomography Market in Brazil?
The projected CAGR is approximately 4.25%.
2. Which companies are prominent players in the Computed Tomography Market in Brazil?
Key companies in the market include GE Healthcare, Dentsply Sirona, Siemens Healthineers AG, Carestream Health, Koninklijke Philips NV, Canon Medical Systems Corporation, Samsung Medison, Planmeca Group (Planmed OY).
3. What are the main segments of the Computed Tomography Market in Brazil?
The market segments include Type, Application, End User.
4. Can you provide details about the market size?
The market size is estimated to be USD 238.92 Million as of 2022.
5. What are some drivers contributing to market growth?
Increasing Prevalence of Chronic Diseases; Rising Geriatric Population; Increasing Technological Advancements.
6. What are the notable trends driving market growth?
Oncology Segment is Expected to Hold a Significant Market Share Over the Forecast Period.
7. Are there any restraints impacting market growth?
Lack Of Proper Reimbursement And Stringent Regulatory Approval Procedures; High Cost of Equipment.
8. Can you provide examples of recent developments in the market?
In November 2020, a Samsung NeuroLogica Mobile Stroke CT scanner was given to the Santa Lucia Hospital Network in Brasilia, Brazil.
9. What pricing options are available for accessing the report?
Pricing options include single-user, multi-user, and enterprise licenses priced at USD 3800, USD 4500, and USD 5800 respectively.
10. Is the market size provided in terms of value or volume?
The market size is provided in terms of value, measured in Million.
11. Are there any specific market keywords associated with the report?
Yes, the market keyword associated with the report is "Computed Tomography Market in Brazil," which aids in identifying and referencing the specific market segment covered.
12. How do I determine which pricing option suits my needs best?
The pricing options vary based on user requirements and access needs. Individual users may opt for single-user licenses, while businesses requiring broader access may choose multi-user or enterprise licenses for cost-effective access to the report.
13. Are there any additional resources or data provided in the Computed Tomography Market in Brazil report?
While the report offers comprehensive insights, it's advisable to review the specific contents or supplementary materials provided to ascertain if additional resources or data are available.
14. How can I stay updated on further developments or reports in the Computed Tomography Market in Brazil?
To stay informed about further developments, trends, and reports in the Computed Tomography Market in Brazil, consider subscribing to industry newsletters, following relevant companies and organizations, or regularly checking reputable industry news sources and publications.
Methodology
Step 1 - Identification of Relevant Samples Size from Population Database


Step 2 - Approaches for Defining Global Market Size (Value, Volume* & Price*)

Note*: In applicable scenarios
Step 3 - Data Sources
Primary Research
- Web Analytics
- Survey Reports
- Research Institute
- Latest Research Reports
- Opinion Leaders
Secondary Research
- Annual Reports
- White Paper
- Latest Press Release
- Industry Association
- Paid Database
- Investor Presentations

Step 4 - Data Triangulation
Involves using different sources of information in order to increase the validity of a study
These sources are likely to be stakeholders in a program - participants, other researchers, program staff, other community members, and so on.
Then we put all data in single framework & apply various statistical tools to find out the dynamic on the market.
During the analysis stage, feedback from the stakeholder groups would be compared to determine areas of agreement as well as areas of divergence


