
Key Insights
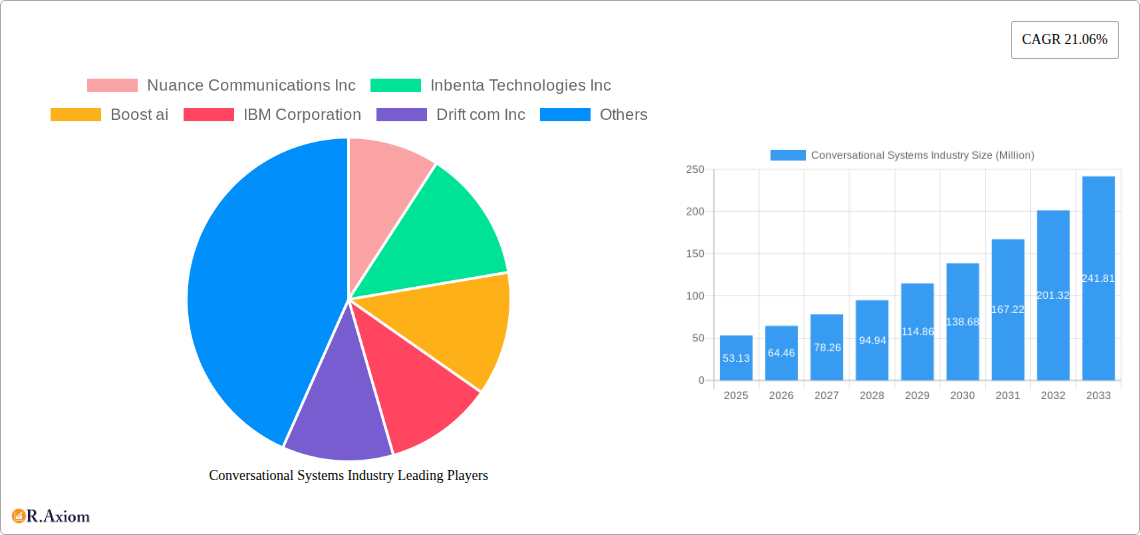
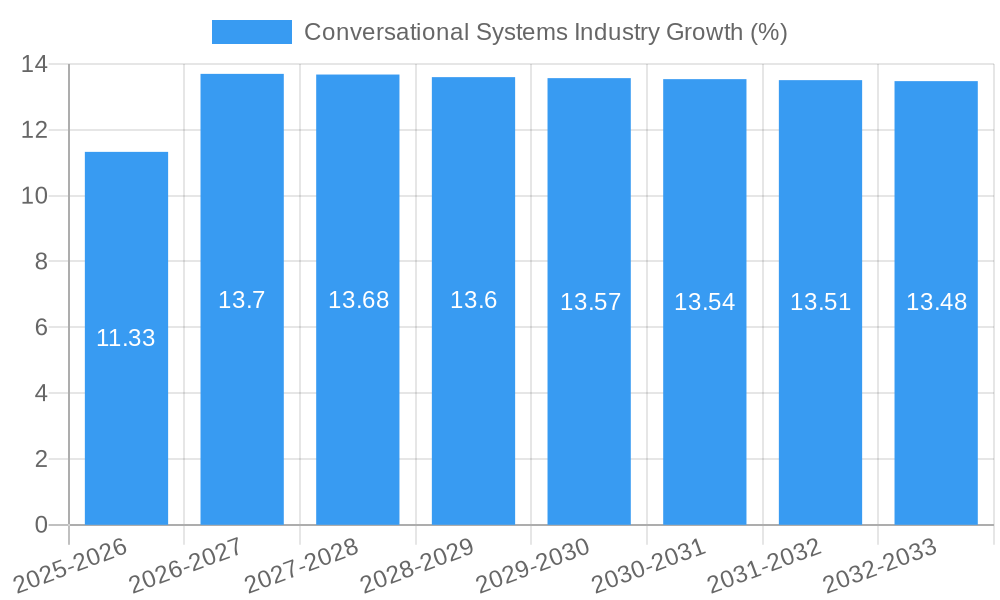
The Conversational AI Systems market, valued at $53.13 million in 2025, is experiencing robust growth, projected to expand significantly over the forecast period (2025-2033) with a Compound Annual Growth Rate (CAGR) of 21.06%. This rapid expansion is fueled by several key drivers. The increasing adoption of cloud-based solutions offers scalability and cost-effectiveness, attracting both small and medium-sized enterprises (SMEs) and large enterprises. Furthermore, the rising demand for enhanced customer experience across diverse sectors like IT & Telecommunications, BFSI (Banking, Financial Services, and Insurance), and retail is driving market growth. The versatility of conversational AI, encompassing voice and text-based interactions across uni-modal and multi-modal platforms, caters to a wide spectrum of user preferences and application needs. Technological advancements in natural language processing (NLP) and machine learning (ML) continuously improve the accuracy and sophistication of these systems, further fueling market adoption.
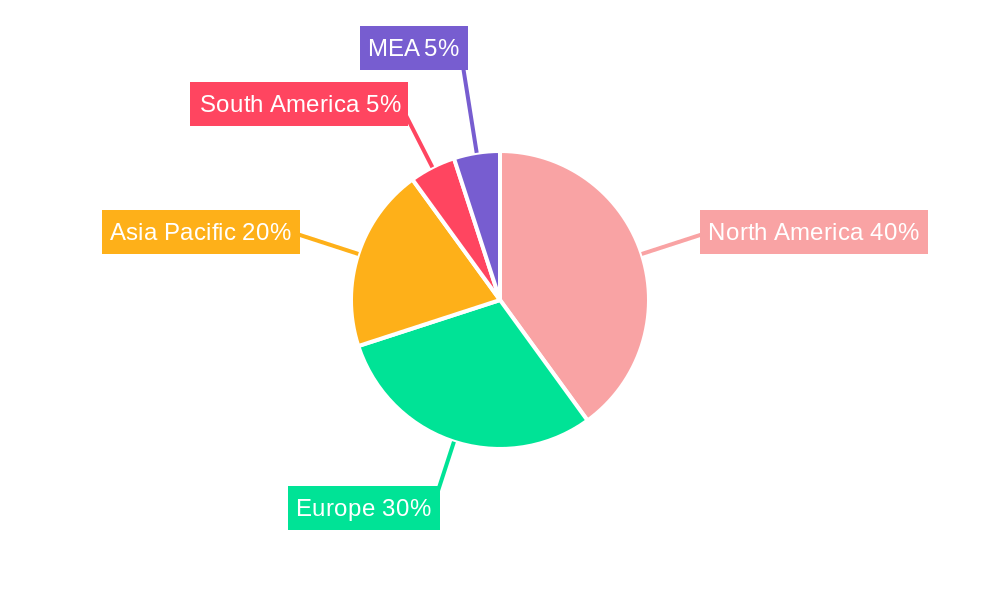
Market segmentation reveals valuable insights into growth drivers. While the cloud deployment model is expected to dominate, on-premise solutions will retain a niche, catering to specific security and compliance needs. Large enterprises currently represent a significant portion of the market due to their greater resources and complex communication requirements, but the SME segment is predicted to experience rapid growth as the technology becomes more accessible and affordable. The IT & Telecommunications and BFSI sectors currently lead in adoption, but significant opportunities exist in other sectors such as government, retail, energy, and education, where improved customer service and operational efficiency are key priorities. The increasing complexity of customer interactions is pushing the market towards multi-modal systems, enhancing user engagement and satisfaction. Geographical distribution indicates North America and Europe as currently dominant regions, but Asia-Pacific is expected to witness substantial growth due to rising digital adoption and a burgeoning technological landscape. Competition is fierce among established players such as Nuance, IBM, Google, Microsoft, and Amazon, alongside emerging innovative companies, fostering innovation and driving down costs.
Conversational Systems Industry Market Report: 2019-2033
This comprehensive report provides a detailed analysis of the Conversational Systems industry, offering invaluable insights for stakeholders, investors, and businesses operating within this dynamic sector. The report covers the period from 2019 to 2033, with a focus on the estimated year 2025 and a forecast period extending to 2033. The study incorporates meticulous analysis of market segments, key players, and emerging trends, enabling informed decision-making and strategic planning. The global market value is projected to reach xx Million by 2033, exhibiting a significant CAGR of xx% during the forecast period.
Conversational Systems Industry Market Concentration & Innovation
The Conversational Systems market is characterized by a moderate level of concentration, with several key players holding significant market share. However, the landscape is also highly innovative, with constant introductions of new technologies and applications driving significant growth. Nuance Communications Inc., IBM Corporation, Google LLC (Alphabet Inc.), Microsoft Corporation, and Amazon Web Services Inc. are among the leading players, collectively holding an estimated xx% market share in 2025. Market share fluctuates based on technological advancements, strategic partnerships, and mergers and acquisitions (M&A) activities. Recent M&A activities, while not always publicly disclosed with exact values, reveal a trend towards consolidation, with deal values ranging from tens to hundreds of Millions depending on the size and strategic importance of the acquired company.
- Innovation Drivers: AI advancements (NLP, machine learning), cloud computing expansion, increased demand for automated customer service, and the growing adoption of conversational interfaces across various industries.
- Regulatory Frameworks: Regulations related to data privacy (GDPR, CCPA) and AI ethics are shaping industry practices and influencing product development.
- Product Substitutes: Traditional customer service methods (phone calls, email) pose some level of competition, although the efficiency and scalability of conversational systems are driving significant substitution.
- End-User Trends: Businesses increasingly prioritize personalized customer experiences and operational efficiency, fueling demand for conversational systems.
- M&A Activities: Strategic acquisitions are common, reflecting the competitive landscape and the drive for technological expansion and market consolidation. The total M&A value in the last 5 years is estimated at xx Million.
Conversational Systems Industry Industry Trends & Insights
The Conversational Systems market is experiencing robust growth driven by several key factors. The increasing adoption of AI and machine learning is enabling more sophisticated and human-like conversational interfaces. The shift towards cloud-based deployments offers businesses scalability and cost-effectiveness. Consumer preferences for seamless, 24/7 support are also fueling demand. Furthermore, competitive dynamics are driving innovation, with companies constantly striving to improve the accuracy, efficiency, and personalization of their conversational systems. The market penetration for conversational AI in customer service is currently at approximately xx%, projected to reach xx% by 2033. The overall market is expected to exhibit a Compound Annual Growth Rate (CAGR) of xx% during the forecast period (2025-2033).
Dominant Markets & Segments in Conversational Systems Industry
The Conversational Systems market shows strong growth across various segments, with some exhibiting particularly strong dominance.
- By Deployment: The Cloud segment is the dominant force, driven by its scalability, cost-effectiveness, and accessibility. On-premise deployments remain relevant for specific security-sensitive applications.
- By Enterprise Size: Large Enterprises currently dominate the market due to their greater investment capacity and complex operational needs. However, the adoption rate among Small and Medium Enterprises (SMEs) is rapidly increasing.
- By End-user Verticals: The BFSI (Banking, Financial Services, and Insurance) sector leads in adoption, followed closely by IT & Telecommunication and Retail. Government, Energy & Power, and other end-user verticals are showing significant growth potential.
- By Modality Type: Multi-modal systems (combining voice and text) are gaining traction over uni-modal systems, offering richer user interactions and improved accessibility.
- By Type: Voice-assisted systems are currently the more prevalent type, however, text-assisted systems are experiencing strong growth, particularly in sectors where written communication is dominant.
Key Drivers for Dominant Segments:
- BFSI: Stringent regulatory compliance needs, a large customer base, and the focus on improving customer service drive high adoption.
- Cloud Deployment: Scalability, cost efficiency, and ease of implementation make cloud-based conversational systems highly attractive.
- Large Enterprises: Larger budgets and complex business processes necessitate sophisticated solutions that conversational AI effectively provides.
Conversational Systems Industry Product Developments
Recent product innovations focus on enhancing natural language processing (NLP), integrating advanced AI capabilities, and expanding cross-platform compatibility. Companies are developing more sophisticated conversational AI models capable of handling complex user queries, understanding context, and providing personalized responses. The integration of AI-powered analytics allows businesses to gather insights from conversational data, leading to improvements in customer service and operational efficiency. This focus on enhanced user experience, seamless integration and data-driven insights contribute to a strong market fit.
Report Scope & Segmentation Analysis
This report comprehensively analyzes the Conversational Systems market across various segments. The detailed segmentation by Deployment (On-Premise, Cloud), Enterprise Size (Small & Medium Enterprises, Large Enterprises), End-user Verticals (IT & Telecommunication, BFSI, Government, Retail, Energy & Power, Other), Modality Type (Uni-Modal, Multi-Modal), and Type (Voice Assisted, Text Assisted, Other) allows for granular understanding of market dynamics within each segment. Growth projections, market sizes, and competitive dynamics are analyzed for each segment, providing a comprehensive view of the market landscape. For instance, the Cloud deployment segment is projected to exhibit a CAGR of xx% during the forecast period due to its inherent advantages.
Key Drivers of Conversational Systems Industry Growth
The Conversational Systems industry's growth is driven by several key factors: Firstly, technological advancements in AI and NLP are continually enhancing the capabilities of conversational AI systems. Secondly, the increasing demand for enhanced customer experiences and operational efficiency drives adoption across various industries. Thirdly, supportive government initiatives and investments in AI technology are fostering industry growth. The decreasing cost of cloud infrastructure and the increasing availability of skilled developers further contribute to the growth trajectory.
Challenges in the Conversational Systems Industry Sector
The industry faces challenges such as the need for high-quality data for training AI models, concerns about data privacy and security, and ensuring the ethical development and deployment of conversational AI systems. Maintaining accuracy and overcoming biases in AI algorithms is crucial. High upfront investment costs for implementation and integration can also be a barrier for some businesses. Furthermore, the competition is intense, requiring continuous innovation to stay ahead. These factors could collectively impact the market growth by approximately xx% if not properly addressed.
Emerging Opportunities in Conversational Systems Industry
Emerging opportunities include the expanding use of conversational AI in emerging economies, the integration of conversational AI into the Internet of Things (IoT) devices, and the development of more sophisticated AI assistants capable of handling increasingly complex tasks. The growth of niche applications in areas such as healthcare, education, and smart homes presents further opportunities. Personalization and proactive engagement driven by AI are emerging as key differentiators.
Leading Players in the Conversational Systems Industry Market
- Nuance Communications Inc
- Inbenta Technologies Inc
- Boost ai
- IBM Corporation
- Drift com Inc
- Google LLC (Alphabet Inc)
- Microsoft Corporation
- Amazon Web Services Inc
- Oracle Corporation
- SAP SE
Key Developments in Conversational Systems Industry Industry
- March 2023: Google LLC (Alphabet Inc.) announced plans to integrate AI into healthcare, impacting medical examinations, research, and app development. This signifies a significant market expansion into the healthcare sector.
- November 2022: Moveworks partnered with Wipro, offering scalable IT solutions that enhance efficiency and employee satisfaction. This collaboration demonstrates the expanding applications of conversational AI within enterprise IT.
- May 2022: DRUID and BARQ Systems partnered to accelerate digital transformation and RPA implementations in the Middle East and Africa. This highlights the growing importance of conversational AI in driving digital transformation initiatives globally.
Strategic Outlook for Conversational Systems Industry Market
The Conversational Systems market is poised for significant growth, driven by ongoing technological advancements, increasing adoption across diverse industries, and the expanding scope of applications. The focus on improving the accuracy, personalization, and security of conversational AI systems will be crucial for continued market expansion. The emergence of new applications and integration with other technologies will further fuel growth, making this a highly promising sector for investment and innovation in the coming years.
Conversational Systems Industry Segmentation
-
1. Modality Type
- 1.1. Uni-Modal
- 1.2. Multi-Modal
-
2. Type
- 2.1. Voice Assisted
- 2.2. Text Assisted
- 2.3. Other Types
-
3. Deployment
- 3.1. On-Premise
- 3.2. Cloud
-
4. Enterprise Size
- 4.1. Small & Medium Enterprises
- 4.2. Large Enterprises
-
5. End-user Verticals
- 5.1. IT & Telecommunication
- 5.2. BFSI
- 5.3. Government
- 5.4. Retail
- 5.5. Energy & Power
- 5.6. Other En
Conversational Systems Industry Segmentation By Geography
- 1. North America
- 2. Europe
- 3. Asia
- 4. Australia and New Zealand
- 5. Latin America
- 6. Middle East and Africa
Conversational Systems Industry REPORT HIGHLIGHTS
| Aspects | Details |
|---|---|
| Study Period | 2019-2033 |
| Base Year | 2024 |
| Estimated Year | 2025 |
| Forecast Period | 2025-2033 |
| Historical Period | 2019-2024 |
| Growth Rate | CAGR of 21.06% from 2019-2033 |
| Segmentation |
|
Table of Contents
- 1. Introduction
- 1.1. Research Scope
- 1.2. Market Segmentation
- 1.3. Research Methodology
- 1.4. Definitions and Assumptions
- 2. Executive Summary
- 2.1. Introduction
- 3. Market Dynamics
- 3.1. Introduction
- 3.2. Market Drivers
- 3.2.1. Rising Usage of AI-based Solutions for Customer Services
- 3.3. Market Restrains
- 3.3.1. Lack of Cybersecurity Professionals; High Reliance on Traditional Authentication Methods and Low Preparedness
- 3.4. Market Trends
- 3.4.1. Rising Usage of AI-based Solutions for Customer Services Drives the Market Growth
- 4. Market Factor Analysis
- 4.1. Porters Five Forces
- 4.2. Supply/Value Chain
- 4.3. PESTEL analysis
- 4.4. Market Entropy
- 4.5. Patent/Trademark Analysis
- 5. Global Conversational Systems Industry Analysis, Insights and Forecast, 2019-2031
- 5.1. Market Analysis, Insights and Forecast - by Modality Type
- 5.1.1. Uni-Modal
- 5.1.2. Multi-Modal
- 5.2. Market Analysis, Insights and Forecast - by Type
- 5.2.1. Voice Assisted
- 5.2.2. Text Assisted
- 5.2.3. Other Types
- 5.3. Market Analysis, Insights and Forecast - by Deployment
- 5.3.1. On-Premise
- 5.3.2. Cloud
- 5.4. Market Analysis, Insights and Forecast - by Enterprise Size
- 5.4.1. Small & Medium Enterprises
- 5.4.2. Large Enterprises
- 5.5. Market Analysis, Insights and Forecast - by End-user Verticals
- 5.5.1. IT & Telecommunication
- 5.5.2. BFSI
- 5.5.3. Government
- 5.5.4. Retail
- 5.5.5. Energy & Power
- 5.5.6. Other En
- 5.6. Market Analysis, Insights and Forecast - by Region
- 5.6.1. North America
- 5.6.2. Europe
- 5.6.3. Asia
- 5.6.4. Australia and New Zealand
- 5.6.5. Latin America
- 5.6.6. Middle East and Africa
- 5.1. Market Analysis, Insights and Forecast - by Modality Type
- 6. North America Conversational Systems Industry Analysis, Insights and Forecast, 2019-2031
- 6.1. Market Analysis, Insights and Forecast - by Modality Type
- 6.1.1. Uni-Modal
- 6.1.2. Multi-Modal
- 6.2. Market Analysis, Insights and Forecast - by Type
- 6.2.1. Voice Assisted
- 6.2.2. Text Assisted
- 6.2.3. Other Types
- 6.3. Market Analysis, Insights and Forecast - by Deployment
- 6.3.1. On-Premise
- 6.3.2. Cloud
- 6.4. Market Analysis, Insights and Forecast - by Enterprise Size
- 6.4.1. Small & Medium Enterprises
- 6.4.2. Large Enterprises
- 6.5. Market Analysis, Insights and Forecast - by End-user Verticals
- 6.5.1. IT & Telecommunication
- 6.5.2. BFSI
- 6.5.3. Government
- 6.5.4. Retail
- 6.5.5. Energy & Power
- 6.5.6. Other En
- 6.1. Market Analysis, Insights and Forecast - by Modality Type
- 7. Europe Conversational Systems Industry Analysis, Insights and Forecast, 2019-2031
- 7.1. Market Analysis, Insights and Forecast - by Modality Type
- 7.1.1. Uni-Modal
- 7.1.2. Multi-Modal
- 7.2. Market Analysis, Insights and Forecast - by Type
- 7.2.1. Voice Assisted
- 7.2.2. Text Assisted
- 7.2.3. Other Types
- 7.3. Market Analysis, Insights and Forecast - by Deployment
- 7.3.1. On-Premise
- 7.3.2. Cloud
- 7.4. Market Analysis, Insights and Forecast - by Enterprise Size
- 7.4.1. Small & Medium Enterprises
- 7.4.2. Large Enterprises
- 7.5. Market Analysis, Insights and Forecast - by End-user Verticals
- 7.5.1. IT & Telecommunication
- 7.5.2. BFSI
- 7.5.3. Government
- 7.5.4. Retail
- 7.5.5. Energy & Power
- 7.5.6. Other En
- 7.1. Market Analysis, Insights and Forecast - by Modality Type
- 8. Asia Conversational Systems Industry Analysis, Insights and Forecast, 2019-2031
- 8.1. Market Analysis, Insights and Forecast - by Modality Type
- 8.1.1. Uni-Modal
- 8.1.2. Multi-Modal
- 8.2. Market Analysis, Insights and Forecast - by Type
- 8.2.1. Voice Assisted
- 8.2.2. Text Assisted
- 8.2.3. Other Types
- 8.3. Market Analysis, Insights and Forecast - by Deployment
- 8.3.1. On-Premise
- 8.3.2. Cloud
- 8.4. Market Analysis, Insights and Forecast - by Enterprise Size
- 8.4.1. Small & Medium Enterprises
- 8.4.2. Large Enterprises
- 8.5. Market Analysis, Insights and Forecast - by End-user Verticals
- 8.5.1. IT & Telecommunication
- 8.5.2. BFSI
- 8.5.3. Government
- 8.5.4. Retail
- 8.5.5. Energy & Power
- 8.5.6. Other En
- 8.1. Market Analysis, Insights and Forecast - by Modality Type
- 9. Australia and New Zealand Conversational Systems Industry Analysis, Insights and Forecast, 2019-2031
- 9.1. Market Analysis, Insights and Forecast - by Modality Type
- 9.1.1. Uni-Modal
- 9.1.2. Multi-Modal
- 9.2. Market Analysis, Insights and Forecast - by Type
- 9.2.1. Voice Assisted
- 9.2.2. Text Assisted
- 9.2.3. Other Types
- 9.3. Market Analysis, Insights and Forecast - by Deployment
- 9.3.1. On-Premise
- 9.3.2. Cloud
- 9.4. Market Analysis, Insights and Forecast - by Enterprise Size
- 9.4.1. Small & Medium Enterprises
- 9.4.2. Large Enterprises
- 9.5. Market Analysis, Insights and Forecast - by End-user Verticals
- 9.5.1. IT & Telecommunication
- 9.5.2. BFSI
- 9.5.3. Government
- 9.5.4. Retail
- 9.5.5. Energy & Power
- 9.5.6. Other En
- 9.1. Market Analysis, Insights and Forecast - by Modality Type
- 10. Latin America Conversational Systems Industry Analysis, Insights and Forecast, 2019-2031
- 10.1. Market Analysis, Insights and Forecast - by Modality Type
- 10.1.1. Uni-Modal
- 10.1.2. Multi-Modal
- 10.2. Market Analysis, Insights and Forecast - by Type
- 10.2.1. Voice Assisted
- 10.2.2. Text Assisted
- 10.2.3. Other Types
- 10.3. Market Analysis, Insights and Forecast - by Deployment
- 10.3.1. On-Premise
- 10.3.2. Cloud
- 10.4. Market Analysis, Insights and Forecast - by Enterprise Size
- 10.4.1. Small & Medium Enterprises
- 10.4.2. Large Enterprises
- 10.5. Market Analysis, Insights and Forecast - by End-user Verticals
- 10.5.1. IT & Telecommunication
- 10.5.2. BFSI
- 10.5.3. Government
- 10.5.4. Retail
- 10.5.5. Energy & Power
- 10.5.6. Other En
- 10.1. Market Analysis, Insights and Forecast - by Modality Type
- 11. Middle East and Africa Conversational Systems Industry Analysis, Insights and Forecast, 2019-2031
- 11.1. Market Analysis, Insights and Forecast - by Modality Type
- 11.1.1. Uni-Modal
- 11.1.2. Multi-Modal
- 11.2. Market Analysis, Insights and Forecast - by Type
- 11.2.1. Voice Assisted
- 11.2.2. Text Assisted
- 11.2.3. Other Types
- 11.3. Market Analysis, Insights and Forecast - by Deployment
- 11.3.1. On-Premise
- 11.3.2. Cloud
- 11.4. Market Analysis, Insights and Forecast - by Enterprise Size
- 11.4.1. Small & Medium Enterprises
- 11.4.2. Large Enterprises
- 11.5. Market Analysis, Insights and Forecast - by End-user Verticals
- 11.5.1. IT & Telecommunication
- 11.5.2. BFSI
- 11.5.3. Government
- 11.5.4. Retail
- 11.5.5. Energy & Power
- 11.5.6. Other En
- 11.1. Market Analysis, Insights and Forecast - by Modality Type
- 12. North America Conversational Systems Industry Analysis, Insights and Forecast, 2019-2031
- 12.1. Market Analysis, Insights and Forecast - By Country/Sub-region
- 12.1.1 United States
- 12.1.2 Canada
- 12.1.3 Mexico
- 13. Europe Conversational Systems Industry Analysis, Insights and Forecast, 2019-2031
- 13.1. Market Analysis, Insights and Forecast - By Country/Sub-region
- 13.1.1 Germany
- 13.1.2 United Kingdom
- 13.1.3 France
- 13.1.4 Spain
- 13.1.5 Italy
- 13.1.6 Spain
- 13.1.7 Belgium
- 13.1.8 Netherland
- 13.1.9 Nordics
- 13.1.10 Rest of Europe
- 14. Asia Pacific Conversational Systems Industry Analysis, Insights and Forecast, 2019-2031
- 14.1. Market Analysis, Insights and Forecast - By Country/Sub-region
- 14.1.1 China
- 14.1.2 Japan
- 14.1.3 India
- 14.1.4 South Korea
- 14.1.5 Southeast Asia
- 14.1.6 Australia
- 14.1.7 Indonesia
- 14.1.8 Phillipes
- 14.1.9 Singapore
- 14.1.10 Thailandc
- 14.1.11 Rest of Asia Pacific
- 15. South America Conversational Systems Industry Analysis, Insights and Forecast, 2019-2031
- 15.1. Market Analysis, Insights and Forecast - By Country/Sub-region
- 15.1.1 Brazil
- 15.1.2 Argentina
- 15.1.3 Peru
- 15.1.4 Chile
- 15.1.5 Colombia
- 15.1.6 Ecuador
- 15.1.7 Venezuela
- 15.1.8 Rest of South America
- 16. North America Conversational Systems Industry Analysis, Insights and Forecast, 2019-2031
- 16.1. Market Analysis, Insights and Forecast - By Country/Sub-region
- 16.1.1 United States
- 16.1.2 Canada
- 16.1.3 Mexico
- 17. MEA Conversational Systems Industry Analysis, Insights and Forecast, 2019-2031
- 17.1. Market Analysis, Insights and Forecast - By Country/Sub-region
- 17.1.1 United Arab Emirates
- 17.1.2 Saudi Arabia
- 17.1.3 South Africa
- 17.1.4 Rest of Middle East and Africa
- 18. Competitive Analysis
- 18.1. Global Market Share Analysis 2024
- 18.2. Company Profiles
- 18.2.1 Nuance Communications Inc
- 18.2.1.1. Overview
- 18.2.1.2. Products
- 18.2.1.3. SWOT Analysis
- 18.2.1.4. Recent Developments
- 18.2.1.5. Financials (Based on Availability)
- 18.2.2 Inbenta Technologies Inc
- 18.2.2.1. Overview
- 18.2.2.2. Products
- 18.2.2.3. SWOT Analysis
- 18.2.2.4. Recent Developments
- 18.2.2.5. Financials (Based on Availability)
- 18.2.3 Boost ai
- 18.2.3.1. Overview
- 18.2.3.2. Products
- 18.2.3.3. SWOT Analysis
- 18.2.3.4. Recent Developments
- 18.2.3.5. Financials (Based on Availability)
- 18.2.4 IBM Corporation
- 18.2.4.1. Overview
- 18.2.4.2. Products
- 18.2.4.3. SWOT Analysis
- 18.2.4.4. Recent Developments
- 18.2.4.5. Financials (Based on Availability)
- 18.2.5 Drift com Inc
- 18.2.5.1. Overview
- 18.2.5.2. Products
- 18.2.5.3. SWOT Analysis
- 18.2.5.4. Recent Developments
- 18.2.5.5. Financials (Based on Availability)
- 18.2.6 Google LLC (Alphabet Inc )
- 18.2.6.1. Overview
- 18.2.6.2. Products
- 18.2.6.3. SWOT Analysis
- 18.2.6.4. Recent Developments
- 18.2.6.5. Financials (Based on Availability)
- 18.2.7 Microsoft Corporation
- 18.2.7.1. Overview
- 18.2.7.2. Products
- 18.2.7.3. SWOT Analysis
- 18.2.7.4. Recent Developments
- 18.2.7.5. Financials (Based on Availability)
- 18.2.8 Amazon Web Services Inc
- 18.2.8.1. Overview
- 18.2.8.2. Products
- 18.2.8.3. SWOT Analysis
- 18.2.8.4. Recent Developments
- 18.2.8.5. Financials (Based on Availability)
- 18.2.9 Oracle Corporation
- 18.2.9.1. Overview
- 18.2.9.2. Products
- 18.2.9.3. SWOT Analysis
- 18.2.9.4. Recent Developments
- 18.2.9.5. Financials (Based on Availability)
- 18.2.10 SAP SE
- 18.2.10.1. Overview
- 18.2.10.2. Products
- 18.2.10.3. SWOT Analysis
- 18.2.10.4. Recent Developments
- 18.2.10.5. Financials (Based on Availability)
- 18.2.1 Nuance Communications Inc
List of Figures
- Figure 1: Global Conversational Systems Industry Revenue Breakdown (Million, %) by Region 2024 & 2032
- Figure 2: North America Conversational Systems Industry Revenue (Million), by Country 2024 & 2032
- Figure 3: North America Conversational Systems Industry Revenue Share (%), by Country 2024 & 2032
- Figure 4: Europe Conversational Systems Industry Revenue (Million), by Country 2024 & 2032
- Figure 5: Europe Conversational Systems Industry Revenue Share (%), by Country 2024 & 2032
- Figure 6: Asia Pacific Conversational Systems Industry Revenue (Million), by Country 2024 & 2032
- Figure 7: Asia Pacific Conversational Systems Industry Revenue Share (%), by Country 2024 & 2032
- Figure 8: South America Conversational Systems Industry Revenue (Million), by Country 2024 & 2032
- Figure 9: South America Conversational Systems Industry Revenue Share (%), by Country 2024 & 2032
- Figure 10: North America Conversational Systems Industry Revenue (Million), by Country 2024 & 2032
- Figure 11: North America Conversational Systems Industry Revenue Share (%), by Country 2024 & 2032
- Figure 12: MEA Conversational Systems Industry Revenue (Million), by Country 2024 & 2032
- Figure 13: MEA Conversational Systems Industry Revenue Share (%), by Country 2024 & 2032
- Figure 14: North America Conversational Systems Industry Revenue (Million), by Modality Type 2024 & 2032
- Figure 15: North America Conversational Systems Industry Revenue Share (%), by Modality Type 2024 & 2032
- Figure 16: North America Conversational Systems Industry Revenue (Million), by Type 2024 & 2032
- Figure 17: North America Conversational Systems Industry Revenue Share (%), by Type 2024 & 2032
- Figure 18: North America Conversational Systems Industry Revenue (Million), by Deployment 2024 & 2032
- Figure 19: North America Conversational Systems Industry Revenue Share (%), by Deployment 2024 & 2032
- Figure 20: North America Conversational Systems Industry Revenue (Million), by Enterprise Size 2024 & 2032
- Figure 21: North America Conversational Systems Industry Revenue Share (%), by Enterprise Size 2024 & 2032
- Figure 22: North America Conversational Systems Industry Revenue (Million), by End-user Verticals 2024 & 2032
- Figure 23: North America Conversational Systems Industry Revenue Share (%), by End-user Verticals 2024 & 2032
- Figure 24: North America Conversational Systems Industry Revenue (Million), by Country 2024 & 2032
- Figure 25: North America Conversational Systems Industry Revenue Share (%), by Country 2024 & 2032
- Figure 26: Europe Conversational Systems Industry Revenue (Million), by Modality Type 2024 & 2032
- Figure 27: Europe Conversational Systems Industry Revenue Share (%), by Modality Type 2024 & 2032
- Figure 28: Europe Conversational Systems Industry Revenue (Million), by Type 2024 & 2032
- Figure 29: Europe Conversational Systems Industry Revenue Share (%), by Type 2024 & 2032
- Figure 30: Europe Conversational Systems Industry Revenue (Million), by Deployment 2024 & 2032
- Figure 31: Europe Conversational Systems Industry Revenue Share (%), by Deployment 2024 & 2032
- Figure 32: Europe Conversational Systems Industry Revenue (Million), by Enterprise Size 2024 & 2032
- Figure 33: Europe Conversational Systems Industry Revenue Share (%), by Enterprise Size 2024 & 2032
- Figure 34: Europe Conversational Systems Industry Revenue (Million), by End-user Verticals 2024 & 2032
- Figure 35: Europe Conversational Systems Industry Revenue Share (%), by End-user Verticals 2024 & 2032
- Figure 36: Europe Conversational Systems Industry Revenue (Million), by Country 2024 & 2032
- Figure 37: Europe Conversational Systems Industry Revenue Share (%), by Country 2024 & 2032
- Figure 38: Asia Conversational Systems Industry Revenue (Million), by Modality Type 2024 & 2032
- Figure 39: Asia Conversational Systems Industry Revenue Share (%), by Modality Type 2024 & 2032
- Figure 40: Asia Conversational Systems Industry Revenue (Million), by Type 2024 & 2032
- Figure 41: Asia Conversational Systems Industry Revenue Share (%), by Type 2024 & 2032
- Figure 42: Asia Conversational Systems Industry Revenue (Million), by Deployment 2024 & 2032
- Figure 43: Asia Conversational Systems Industry Revenue Share (%), by Deployment 2024 & 2032
- Figure 44: Asia Conversational Systems Industry Revenue (Million), by Enterprise Size 2024 & 2032
- Figure 45: Asia Conversational Systems Industry Revenue Share (%), by Enterprise Size 2024 & 2032
- Figure 46: Asia Conversational Systems Industry Revenue (Million), by End-user Verticals 2024 & 2032
- Figure 47: Asia Conversational Systems Industry Revenue Share (%), by End-user Verticals 2024 & 2032
- Figure 48: Asia Conversational Systems Industry Revenue (Million), by Country 2024 & 2032
- Figure 49: Asia Conversational Systems Industry Revenue Share (%), by Country 2024 & 2032
- Figure 50: Australia and New Zealand Conversational Systems Industry Revenue (Million), by Modality Type 2024 & 2032
- Figure 51: Australia and New Zealand Conversational Systems Industry Revenue Share (%), by Modality Type 2024 & 2032
- Figure 52: Australia and New Zealand Conversational Systems Industry Revenue (Million), by Type 2024 & 2032
- Figure 53: Australia and New Zealand Conversational Systems Industry Revenue Share (%), by Type 2024 & 2032
- Figure 54: Australia and New Zealand Conversational Systems Industry Revenue (Million), by Deployment 2024 & 2032
- Figure 55: Australia and New Zealand Conversational Systems Industry Revenue Share (%), by Deployment 2024 & 2032
- Figure 56: Australia and New Zealand Conversational Systems Industry Revenue (Million), by Enterprise Size 2024 & 2032
- Figure 57: Australia and New Zealand Conversational Systems Industry Revenue Share (%), by Enterprise Size 2024 & 2032
- Figure 58: Australia and New Zealand Conversational Systems Industry Revenue (Million), by End-user Verticals 2024 & 2032
- Figure 59: Australia and New Zealand Conversational Systems Industry Revenue Share (%), by End-user Verticals 2024 & 2032
- Figure 60: Australia and New Zealand Conversational Systems Industry Revenue (Million), by Country 2024 & 2032
- Figure 61: Australia and New Zealand Conversational Systems Industry Revenue Share (%), by Country 2024 & 2032
- Figure 62: Latin America Conversational Systems Industry Revenue (Million), by Modality Type 2024 & 2032
- Figure 63: Latin America Conversational Systems Industry Revenue Share (%), by Modality Type 2024 & 2032
- Figure 64: Latin America Conversational Systems Industry Revenue (Million), by Type 2024 & 2032
- Figure 65: Latin America Conversational Systems Industry Revenue Share (%), by Type 2024 & 2032
- Figure 66: Latin America Conversational Systems Industry Revenue (Million), by Deployment 2024 & 2032
- Figure 67: Latin America Conversational Systems Industry Revenue Share (%), by Deployment 2024 & 2032
- Figure 68: Latin America Conversational Systems Industry Revenue (Million), by Enterprise Size 2024 & 2032
- Figure 69: Latin America Conversational Systems Industry Revenue Share (%), by Enterprise Size 2024 & 2032
- Figure 70: Latin America Conversational Systems Industry Revenue (Million), by End-user Verticals 2024 & 2032
- Figure 71: Latin America Conversational Systems Industry Revenue Share (%), by End-user Verticals 2024 & 2032
- Figure 72: Latin America Conversational Systems Industry Revenue (Million), by Country 2024 & 2032
- Figure 73: Latin America Conversational Systems Industry Revenue Share (%), by Country 2024 & 2032
- Figure 74: Middle East and Africa Conversational Systems Industry Revenue (Million), by Modality Type 2024 & 2032
- Figure 75: Middle East and Africa Conversational Systems Industry Revenue Share (%), by Modality Type 2024 & 2032
- Figure 76: Middle East and Africa Conversational Systems Industry Revenue (Million), by Type 2024 & 2032
- Figure 77: Middle East and Africa Conversational Systems Industry Revenue Share (%), by Type 2024 & 2032
- Figure 78: Middle East and Africa Conversational Systems Industry Revenue (Million), by Deployment 2024 & 2032
- Figure 79: Middle East and Africa Conversational Systems Industry Revenue Share (%), by Deployment 2024 & 2032
- Figure 80: Middle East and Africa Conversational Systems Industry Revenue (Million), by Enterprise Size 2024 & 2032
- Figure 81: Middle East and Africa Conversational Systems Industry Revenue Share (%), by Enterprise Size 2024 & 2032
- Figure 82: Middle East and Africa Conversational Systems Industry Revenue (Million), by End-user Verticals 2024 & 2032
- Figure 83: Middle East and Africa Conversational Systems Industry Revenue Share (%), by End-user Verticals 2024 & 2032
- Figure 84: Middle East and Africa Conversational Systems Industry Revenue (Million), by Country 2024 & 2032
- Figure 85: Middle East and Africa Conversational Systems Industry Revenue Share (%), by Country 2024 & 2032
List of Tables
- Table 1: Global Conversational Systems Industry Revenue Million Forecast, by Region 2019 & 2032
- Table 2: Global Conversational Systems Industry Revenue Million Forecast, by Modality Type 2019 & 2032
- Table 3: Global Conversational Systems Industry Revenue Million Forecast, by Type 2019 & 2032
- Table 4: Global Conversational Systems Industry Revenue Million Forecast, by Deployment 2019 & 2032
- Table 5: Global Conversational Systems Industry Revenue Million Forecast, by Enterprise Size 2019 & 2032
- Table 6: Global Conversational Systems Industry Revenue Million Forecast, by End-user Verticals 2019 & 2032
- Table 7: Global Conversational Systems Industry Revenue Million Forecast, by Region 2019 & 2032
- Table 8: Global Conversational Systems Industry Revenue Million Forecast, by Country 2019 & 2032
- Table 9: United States Conversational Systems Industry Revenue (Million) Forecast, by Application 2019 & 2032
- Table 10: Canada Conversational Systems Industry Revenue (Million) Forecast, by Application 2019 & 2032
- Table 11: Mexico Conversational Systems Industry Revenue (Million) Forecast, by Application 2019 & 2032
- Table 12: Global Conversational Systems Industry Revenue Million Forecast, by Country 2019 & 2032
- Table 13: Germany Conversational Systems Industry Revenue (Million) Forecast, by Application 2019 & 2032
- Table 14: United Kingdom Conversational Systems Industry Revenue (Million) Forecast, by Application 2019 & 2032
- Table 15: France Conversational Systems Industry Revenue (Million) Forecast, by Application 2019 & 2032
- Table 16: Spain Conversational Systems Industry Revenue (Million) Forecast, by Application 2019 & 2032
- Table 17: Italy Conversational Systems Industry Revenue (Million) Forecast, by Application 2019 & 2032
- Table 18: Spain Conversational Systems Industry Revenue (Million) Forecast, by Application 2019 & 2032
- Table 19: Belgium Conversational Systems Industry Revenue (Million) Forecast, by Application 2019 & 2032
- Table 20: Netherland Conversational Systems Industry Revenue (Million) Forecast, by Application 2019 & 2032
- Table 21: Nordics Conversational Systems Industry Revenue (Million) Forecast, by Application 2019 & 2032
- Table 22: Rest of Europe Conversational Systems Industry Revenue (Million) Forecast, by Application 2019 & 2032
- Table 23: Global Conversational Systems Industry Revenue Million Forecast, by Country 2019 & 2032
- Table 24: China Conversational Systems Industry Revenue (Million) Forecast, by Application 2019 & 2032
- Table 25: Japan Conversational Systems Industry Revenue (Million) Forecast, by Application 2019 & 2032
- Table 26: India Conversational Systems Industry Revenue (Million) Forecast, by Application 2019 & 2032
- Table 27: South Korea Conversational Systems Industry Revenue (Million) Forecast, by Application 2019 & 2032
- Table 28: Southeast Asia Conversational Systems Industry Revenue (Million) Forecast, by Application 2019 & 2032
- Table 29: Australia Conversational Systems Industry Revenue (Million) Forecast, by Application 2019 & 2032
- Table 30: Indonesia Conversational Systems Industry Revenue (Million) Forecast, by Application 2019 & 2032
- Table 31: Phillipes Conversational Systems Industry Revenue (Million) Forecast, by Application 2019 & 2032
- Table 32: Singapore Conversational Systems Industry Revenue (Million) Forecast, by Application 2019 & 2032
- Table 33: Thailandc Conversational Systems Industry Revenue (Million) Forecast, by Application 2019 & 2032
- Table 34: Rest of Asia Pacific Conversational Systems Industry Revenue (Million) Forecast, by Application 2019 & 2032
- Table 35: Global Conversational Systems Industry Revenue Million Forecast, by Country 2019 & 2032
- Table 36: Brazil Conversational Systems Industry Revenue (Million) Forecast, by Application 2019 & 2032
- Table 37: Argentina Conversational Systems Industry Revenue (Million) Forecast, by Application 2019 & 2032
- Table 38: Peru Conversational Systems Industry Revenue (Million) Forecast, by Application 2019 & 2032
- Table 39: Chile Conversational Systems Industry Revenue (Million) Forecast, by Application 2019 & 2032
- Table 40: Colombia Conversational Systems Industry Revenue (Million) Forecast, by Application 2019 & 2032
- Table 41: Ecuador Conversational Systems Industry Revenue (Million) Forecast, by Application 2019 & 2032
- Table 42: Venezuela Conversational Systems Industry Revenue (Million) Forecast, by Application 2019 & 2032
- Table 43: Rest of South America Conversational Systems Industry Revenue (Million) Forecast, by Application 2019 & 2032
- Table 44: Global Conversational Systems Industry Revenue Million Forecast, by Country 2019 & 2032
- Table 45: United States Conversational Systems Industry Revenue (Million) Forecast, by Application 2019 & 2032
- Table 46: Canada Conversational Systems Industry Revenue (Million) Forecast, by Application 2019 & 2032
- Table 47: Mexico Conversational Systems Industry Revenue (Million) Forecast, by Application 2019 & 2032
- Table 48: Global Conversational Systems Industry Revenue Million Forecast, by Country 2019 & 2032
- Table 49: United Arab Emirates Conversational Systems Industry Revenue (Million) Forecast, by Application 2019 & 2032
- Table 50: Saudi Arabia Conversational Systems Industry Revenue (Million) Forecast, by Application 2019 & 2032
- Table 51: South Africa Conversational Systems Industry Revenue (Million) Forecast, by Application 2019 & 2032
- Table 52: Rest of Middle East and Africa Conversational Systems Industry Revenue (Million) Forecast, by Application 2019 & 2032
- Table 53: Global Conversational Systems Industry Revenue Million Forecast, by Modality Type 2019 & 2032
- Table 54: Global Conversational Systems Industry Revenue Million Forecast, by Type 2019 & 2032
- Table 55: Global Conversational Systems Industry Revenue Million Forecast, by Deployment 2019 & 2032
- Table 56: Global Conversational Systems Industry Revenue Million Forecast, by Enterprise Size 2019 & 2032
- Table 57: Global Conversational Systems Industry Revenue Million Forecast, by End-user Verticals 2019 & 2032
- Table 58: Global Conversational Systems Industry Revenue Million Forecast, by Country 2019 & 2032
- Table 59: Global Conversational Systems Industry Revenue Million Forecast, by Modality Type 2019 & 2032
- Table 60: Global Conversational Systems Industry Revenue Million Forecast, by Type 2019 & 2032
- Table 61: Global Conversational Systems Industry Revenue Million Forecast, by Deployment 2019 & 2032
- Table 62: Global Conversational Systems Industry Revenue Million Forecast, by Enterprise Size 2019 & 2032
- Table 63: Global Conversational Systems Industry Revenue Million Forecast, by End-user Verticals 2019 & 2032
- Table 64: Global Conversational Systems Industry Revenue Million Forecast, by Country 2019 & 2032
- Table 65: Global Conversational Systems Industry Revenue Million Forecast, by Modality Type 2019 & 2032
- Table 66: Global Conversational Systems Industry Revenue Million Forecast, by Type 2019 & 2032
- Table 67: Global Conversational Systems Industry Revenue Million Forecast, by Deployment 2019 & 2032
- Table 68: Global Conversational Systems Industry Revenue Million Forecast, by Enterprise Size 2019 & 2032
- Table 69: Global Conversational Systems Industry Revenue Million Forecast, by End-user Verticals 2019 & 2032
- Table 70: Global Conversational Systems Industry Revenue Million Forecast, by Country 2019 & 2032
- Table 71: Global Conversational Systems Industry Revenue Million Forecast, by Modality Type 2019 & 2032
- Table 72: Global Conversational Systems Industry Revenue Million Forecast, by Type 2019 & 2032
- Table 73: Global Conversational Systems Industry Revenue Million Forecast, by Deployment 2019 & 2032
- Table 74: Global Conversational Systems Industry Revenue Million Forecast, by Enterprise Size 2019 & 2032
- Table 75: Global Conversational Systems Industry Revenue Million Forecast, by End-user Verticals 2019 & 2032
- Table 76: Global Conversational Systems Industry Revenue Million Forecast, by Country 2019 & 2032
- Table 77: Global Conversational Systems Industry Revenue Million Forecast, by Modality Type 2019 & 2032
- Table 78: Global Conversational Systems Industry Revenue Million Forecast, by Type 2019 & 2032
- Table 79: Global Conversational Systems Industry Revenue Million Forecast, by Deployment 2019 & 2032
- Table 80: Global Conversational Systems Industry Revenue Million Forecast, by Enterprise Size 2019 & 2032
- Table 81: Global Conversational Systems Industry Revenue Million Forecast, by End-user Verticals 2019 & 2032
- Table 82: Global Conversational Systems Industry Revenue Million Forecast, by Country 2019 & 2032
- Table 83: Global Conversational Systems Industry Revenue Million Forecast, by Modality Type 2019 & 2032
- Table 84: Global Conversational Systems Industry Revenue Million Forecast, by Type 2019 & 2032
- Table 85: Global Conversational Systems Industry Revenue Million Forecast, by Deployment 2019 & 2032
- Table 86: Global Conversational Systems Industry Revenue Million Forecast, by Enterprise Size 2019 & 2032
- Table 87: Global Conversational Systems Industry Revenue Million Forecast, by End-user Verticals 2019 & 2032
- Table 88: Global Conversational Systems Industry Revenue Million Forecast, by Country 2019 & 2032
Frequently Asked Questions
1. What is the projected Compound Annual Growth Rate (CAGR) of the Conversational Systems Industry?
The projected CAGR is approximately 21.06%.
2. Which companies are prominent players in the Conversational Systems Industry?
Key companies in the market include Nuance Communications Inc, Inbenta Technologies Inc, Boost ai, IBM Corporation, Drift com Inc, Google LLC (Alphabet Inc ), Microsoft Corporation, Amazon Web Services Inc, Oracle Corporation, SAP SE.
3. What are the main segments of the Conversational Systems Industry?
The market segments include Modality Type, Type, Deployment, Enterprise Size, End-user Verticals.
4. Can you provide details about the market size?
The market size is estimated to be USD 53.13 Million as of 2022.
5. What are some drivers contributing to market growth?
Rising Usage of AI-based Solutions for Customer Services.
6. What are the notable trends driving market growth?
Rising Usage of AI-based Solutions for Customer Services Drives the Market Growth.
7. Are there any restraints impacting market growth?
Lack of Cybersecurity Professionals; High Reliance on Traditional Authentication Methods and Low Preparedness.
8. Can you provide examples of recent developments in the market?
March 2023: Google LLC (Alphabet Inc.) has announced Plans to integrate artificial intelligence into health related initiatives, including an update on the use of language generation technology in medical examinations and AI assisted research, ways to help consumers find information more quickly through Internet searching and tools to help developers build healthcare apps throughout the world.
9. What pricing options are available for accessing the report?
Pricing options include single-user, multi-user, and enterprise licenses priced at USD 4750, USD 5250, and USD 8750 respectively.
10. Is the market size provided in terms of value or volume?
The market size is provided in terms of value, measured in Million.
11. Are there any specific market keywords associated with the report?
Yes, the market keyword associated with the report is "Conversational Systems Industry," which aids in identifying and referencing the specific market segment covered.
12. How do I determine which pricing option suits my needs best?
The pricing options vary based on user requirements and access needs. Individual users may opt for single-user licenses, while businesses requiring broader access may choose multi-user or enterprise licenses for cost-effective access to the report.
13. Are there any additional resources or data provided in the Conversational Systems Industry report?
While the report offers comprehensive insights, it's advisable to review the specific contents or supplementary materials provided to ascertain if additional resources or data are available.
14. How can I stay updated on further developments or reports in the Conversational Systems Industry?
To stay informed about further developments, trends, and reports in the Conversational Systems Industry, consider subscribing to industry newsletters, following relevant companies and organizations, or regularly checking reputable industry news sources and publications.
Methodology
Step 1 - Identification of Relevant Samples Size from Population Database


Step 2 - Approaches for Defining Global Market Size (Value, Volume* & Price*)

Note*: In applicable scenarios
Step 3 - Data Sources
Primary Research
- Web Analytics
- Survey Reports
- Research Institute
- Latest Research Reports
- Opinion Leaders
Secondary Research
- Annual Reports
- White Paper
- Latest Press Release
- Industry Association
- Paid Database
- Investor Presentations

Step 4 - Data Triangulation
Involves using different sources of information in order to increase the validity of a study
These sources are likely to be stakeholders in a program - participants, other researchers, program staff, other community members, and so on.
Then we put all data in single framework & apply various statistical tools to find out the dynamic on the market.
During the analysis stage, feedback from the stakeholder groups would be compared to determine areas of agreement as well as areas of divergence


