
Key Insights
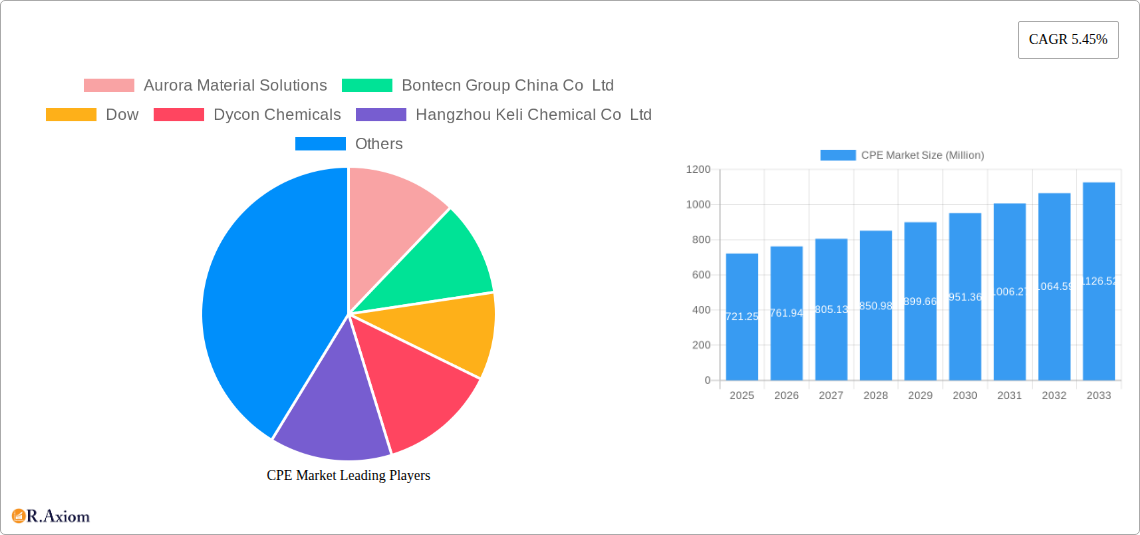
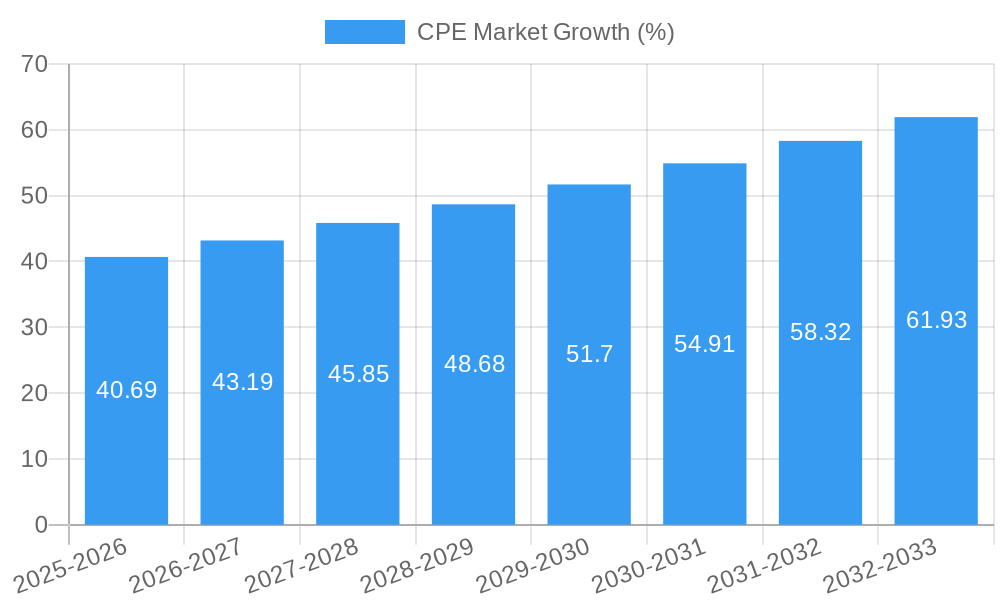
The Chlorinated Polyethylene (CPE) market, valued at $721.25 million in 2025, is projected to experience robust growth, driven by increasing demand from diverse sectors like wire and cable, automotive, and construction. A compound annual growth rate (CAGR) of 5.45% from 2025 to 2033 indicates a significant expansion of the market size. This growth is fueled by several factors, including the rising adoption of CPE in applications requiring superior flexibility, durability, and chemical resistance. The automotive industry's demand for lightweight, yet strong, materials is significantly contributing to market growth, along with the expanding construction sector's need for durable and weather-resistant materials. Furthermore, advancements in CPE formulations, leading to enhanced performance characteristics and broader applications, are also driving market expansion. Competitive landscape analysis reveals a mix of established global players and regional manufacturers, suggesting a dynamic market with opportunities for both established and emerging companies.
However, the market faces some restraints. Fluctuations in raw material prices, particularly chlorine and ethylene, can impact CPE production costs and profitability. Environmental concerns related to the manufacturing process and the potential for long-term environmental impact are also influencing market dynamics. Stricter environmental regulations in certain regions could pose challenges to some manufacturers, necessitating investment in cleaner production technologies. Nevertheless, the overall outlook for the CPE market remains positive, driven by ongoing technological advancements, increasing demand from key industries, and the inherent advantages of CPE in various applications. The market is poised for substantial growth throughout the forecast period, with opportunities for innovation and expansion across different geographic regions.
CPE Market: A Comprehensive Report (2019-2033)
This in-depth report provides a comprehensive analysis of the CPE (Chlorinated Polyethylene) market, offering invaluable insights for industry stakeholders. Covering the period from 2019 to 2033, with a base year of 2025, this study unveils market dynamics, growth drivers, challenges, and opportunities, enabling informed strategic decision-making. The report incorporates data from leading players like Aurora Material Solutions, Bontecn Group China Co Ltd, Dow, Dycon Chemicals, Hangzhou Keli Chemical Co Ltd, Jiangsu Tianteng Chemical Industry Co Ltd, Resonac Holdings Corporation, Shandong Gaoxin Chemical Co Ltd, Shandong Ketian Chemical Co Ltd, Shandong Novista Chemical Ltd (Novista Group), Shandong Xiangsheng New Materials Technology Co Ltd, Shandong Xuye New Materials Co Ltd, Sundow Polymers Co Ltd, and Weifang Yaxing Chemical Co Ltd, but the list is not exhaustive.
CPE Market Market Concentration & Innovation
The CPE market exhibits a moderately concentrated landscape, with a few major players holding significant market share. Market concentration is analyzed based on revenue, production volume, and geographical presence. Innovation in the CPE market is driven by the need for improved performance characteristics, such as enhanced flexibility, impact resistance, and chemical resistance. This is leading to the development of specialized CPE grades for diverse applications. Regulatory frameworks concerning environmental compliance and material safety are also significant drivers of innovation. Product substitutes, including other polymers like PVC and EVA, pose competitive pressure, forcing CPE manufacturers to continually improve their product offerings. End-user trends, particularly in the construction and automotive sectors, are shaping demand for specific CPE grades. Mergers and acquisitions (M&A) activities, like the May 2024 acquisition of EnCom Polymers by Aurora Plastics, illustrate the strategic consolidation within the industry. These M&A activities, estimated at xx Million USD annually in the historical period, aim to expand product portfolios and gain market share. For instance, the Aurora acquisition significantly boosted their CPE product line. The report offers a detailed analysis of market share distribution among key players and examines the financial implications of key M&A deals.
CPE Market Industry Trends & Insights
The global CPE market is projected to witness robust growth, with a CAGR of xx% during the forecast period (2025-2033). Key growth drivers include increasing demand from various end-use industries like construction (wire and cable coatings), automotive (interior parts), and packaging. Technological advancements in CPE production processes are improving efficiency and reducing costs, further fueling market expansion. Consumer preferences for durable and versatile materials are driving the adoption of CPE in diverse applications. The competitive landscape is characterized by both price competition and product differentiation. Market penetration is high in mature markets, while significant growth opportunities exist in emerging economies. The report provides a granular analysis of these trends, including regional variations and projections for specific CPE grades. The impact of technological disruptions such as the introduction of advanced polymerization techniques is also assessed.
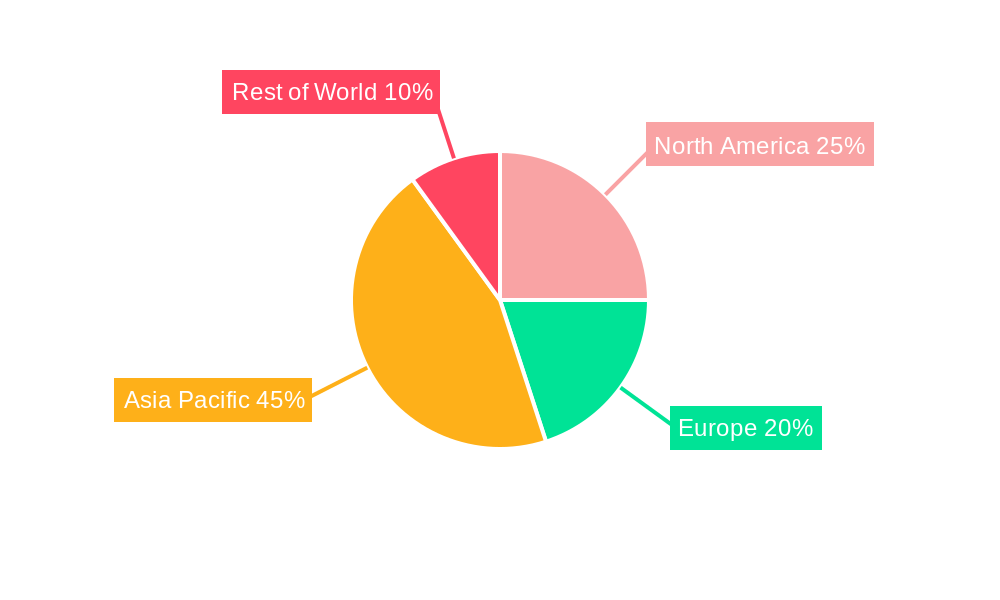
Dominant Markets & Segments in CPE Market
The Asia-Pacific region currently dominates the CPE market, driven by rapid industrialization and expanding infrastructure development in countries like China and India.
- Key Drivers in Asia-Pacific:
- Strong economic growth
- Expanding construction and automotive sectors
- Government initiatives supporting infrastructure development
- Increasing demand for durable and cost-effective materials
Within Asia-Pacific, China holds the largest market share due to its massive manufacturing base and significant demand from various industries. The report details the dominance of this region through in-depth analysis of consumption patterns, market size, and competitive landscapes. Other regions, such as North America and Europe, also exhibit significant market size but display slower growth rates compared to the Asia-Pacific region. This section comprehensively examines the factors contributing to the regional disparity in market dominance.
CPE Market Product Developments
Recent product innovations in the CPE market focus on enhancing material properties like flame retardancy, UV resistance, and improved processability. These developments cater to specific end-user requirements, widening the application spectrum of CPE. The introduction of specialty CPE grades with enhanced performance characteristics provides manufacturers a competitive edge, allowing them to target niche applications and command premium prices. These advancements are influencing market dynamics by creating new opportunities and driving innovation across the value chain.
Report Scope & Segmentation Analysis
This report segments the CPE market based on several parameters:
By Type: This section details various CPE types (e.g., high molecular weight, medium molecular weight, low molecular weight) and projects their individual growth trajectories and market sizes.
By Application: This section examines the market segmentation based on end-use industries (e.g., construction, automotive, packaging). Growth projections and competitive landscapes are presented for each application segment.
By Region: This segmentation offers a detailed breakdown of market size and growth prospects across key regions globally.
Competitive dynamics vary significantly across these segments, with some segments exhibiting higher levels of consolidation than others.
Key Drivers of CPE Market Growth
Several factors fuel the growth of the CPE market. Technological advancements in CPE production processes lead to improved quality and cost-effectiveness. Strong economic growth in emerging economies fuels infrastructure development, driving demand for CPE in various construction and automotive applications. Favorable government policies and regulations in several countries incentivize the use of sustainable and durable materials, boosting CPE adoption.
Challenges in the CPE Market Sector
The CPE market faces certain challenges, including fluctuations in raw material prices, which directly affect production costs and profitability. Stringent environmental regulations regarding the disposal of CPE waste pose a hurdle for some manufacturers. Intense competition from substitute materials necessitates continuous product innovation and cost optimization to retain market share. These factors can collectively constrain market growth if not managed effectively.
Emerging Opportunities in CPE Market
The CPE market presents various opportunities, particularly in emerging economies with burgeoning infrastructure development. The development of bio-based or recycled CPE options caters to increasing environmental concerns and presents new avenues for growth. Demand for specialized CPE grades with enhanced performance characteristics in niche applications (e.g., medical devices) creates promising prospects.
Leading Players in the CPE Market Market
- Aurora Material Solutions
- Bontecn Group China Co Ltd
- Dow [Dow Website Link (replace with actual link if available)]
- Dycon Chemicals
- Hangzhou Keli Chemical Co Ltd
- Jiangsu Tianteng Chemical Industry Co Ltd
- Resonac Holdings Corporation [Resonac Holdings Website Link (replace with actual link if available)]
- Shandong Gaoxin Chemical Co Ltd
- Shandong Ketian Chemical Co Ltd
- Shandong Novista Chemical Ltd (Novista Group)
- Shandong Xiangsheng New Materials Technology Co Ltd
- Shandong Xuye New Materials Co Ltd
- Sundow Polymers Co Ltd
- Weifang Yaxing Chemical Co Ltd
*List Not Exhaustive
Key Developments in CPE Market Industry
- May 2024: Aurora Plastics LLC (Aurora) announced the acquisition of EnCom Polymers Inc., expanding its product offerings to include chlorinated polyethylene alloys (CPE). This acquisition strengthened Aurora Plastics LLC's product portfolio.
Strategic Outlook for CPE Market Market
The CPE market is poised for continued growth, driven by increasing demand from key end-use sectors. Technological advancements and the development of sustainable CPE solutions will shape future market dynamics. Strategic partnerships and collaborations will play a crucial role in driving innovation and expanding market reach. The long-term outlook remains positive, with significant opportunities for growth in both established and emerging markets.
CPE Market Segmentation
-
1. Product
- 1.1. CPE 135A
- 1.2. CPA 135B
- 1.3. Other Products
-
2. Application
- 2.1. Impact Modifier
- 2.2. Wire and Cable Jacketing
- 2.3. Hose and Tubing
- 2.4. Adhesives
- 2.5. Other Applications
CPE Market Segmentation By Geography
-
1. Asia Pacific
- 1.1. China
- 1.2. India
- 1.3. Japan
- 1.4. South Korea
- 1.5. Rest of Asia Pacific
-
2. North America
- 2.1. United States
- 2.2. Canada
- 2.3. Mexico
-
3. Europe
- 3.1. Germany
- 3.2. United Kingdom
- 3.3. France
- 3.4. Italy
- 3.5. Rest of Europe
-
4. South America
- 4.1. Brazil
- 4.2. Argentina
- 4.3. Rest of South America
-
5. Middle East and Africa
- 5.1. Saudi Arabia
- 5.2. South Africa
- 5.3. Rest of Middle East and Africa
CPE Market REPORT HIGHLIGHTS
| Aspects | Details |
|---|---|
| Study Period | 2019-2033 |
| Base Year | 2024 |
| Estimated Year | 2025 |
| Forecast Period | 2025-2033 |
| Historical Period | 2019-2024 |
| Growth Rate | CAGR of 5.45% from 2019-2033 |
| Segmentation |
|
Table of Contents
- 1. Introduction
- 1.1. Research Scope
- 1.2. Market Segmentation
- 1.3. Research Methodology
- 1.4. Definitions and Assumptions
- 2. Executive Summary
- 2.1. Introduction
- 3. Market Dynamics
- 3.1. Introduction
- 3.2. Market Drivers
- 3.2.1. Rising Demand for CPE-based Impact Modifiers in PVC Products; Growing Demand for CPE-based Hoses and Tubes in the Automotive Industry
- 3.3. Market Restrains
- 3.3.1. Rising Demand for CPE-based Impact Modifiers in PVC Products; Growing Demand for CPE-based Hoses and Tubes in the Automotive Industry
- 3.4. Market Trends
- 3.4.1. Impact Modifier is Expected to Dominate the Market
- 4. Market Factor Analysis
- 4.1. Porters Five Forces
- 4.2. Supply/Value Chain
- 4.3. PESTEL analysis
- 4.4. Market Entropy
- 4.5. Patent/Trademark Analysis
- 5. Global CPE Market Analysis, Insights and Forecast, 2019-2031
- 5.1. Market Analysis, Insights and Forecast - by Product
- 5.1.1. CPE 135A
- 5.1.2. CPA 135B
- 5.1.3. Other Products
- 5.2. Market Analysis, Insights and Forecast - by Application
- 5.2.1. Impact Modifier
- 5.2.2. Wire and Cable Jacketing
- 5.2.3. Hose and Tubing
- 5.2.4. Adhesives
- 5.2.5. Other Applications
- 5.3. Market Analysis, Insights and Forecast - by Region
- 5.3.1. Asia Pacific
- 5.3.2. North America
- 5.3.3. Europe
- 5.3.4. South America
- 5.3.5. Middle East and Africa
- 5.1. Market Analysis, Insights and Forecast - by Product
- 6. Asia Pacific CPE Market Analysis, Insights and Forecast, 2019-2031
- 6.1. Market Analysis, Insights and Forecast - by Product
- 6.1.1. CPE 135A
- 6.1.2. CPA 135B
- 6.1.3. Other Products
- 6.2. Market Analysis, Insights and Forecast - by Application
- 6.2.1. Impact Modifier
- 6.2.2. Wire and Cable Jacketing
- 6.2.3. Hose and Tubing
- 6.2.4. Adhesives
- 6.2.5. Other Applications
- 6.1. Market Analysis, Insights and Forecast - by Product
- 7. North America CPE Market Analysis, Insights and Forecast, 2019-2031
- 7.1. Market Analysis, Insights and Forecast - by Product
- 7.1.1. CPE 135A
- 7.1.2. CPA 135B
- 7.1.3. Other Products
- 7.2. Market Analysis, Insights and Forecast - by Application
- 7.2.1. Impact Modifier
- 7.2.2. Wire and Cable Jacketing
- 7.2.3. Hose and Tubing
- 7.2.4. Adhesives
- 7.2.5. Other Applications
- 7.1. Market Analysis, Insights and Forecast - by Product
- 8. Europe CPE Market Analysis, Insights and Forecast, 2019-2031
- 8.1. Market Analysis, Insights and Forecast - by Product
- 8.1.1. CPE 135A
- 8.1.2. CPA 135B
- 8.1.3. Other Products
- 8.2. Market Analysis, Insights and Forecast - by Application
- 8.2.1. Impact Modifier
- 8.2.2. Wire and Cable Jacketing
- 8.2.3. Hose and Tubing
- 8.2.4. Adhesives
- 8.2.5. Other Applications
- 8.1. Market Analysis, Insights and Forecast - by Product
- 9. South America CPE Market Analysis, Insights and Forecast, 2019-2031
- 9.1. Market Analysis, Insights and Forecast - by Product
- 9.1.1. CPE 135A
- 9.1.2. CPA 135B
- 9.1.3. Other Products
- 9.2. Market Analysis, Insights and Forecast - by Application
- 9.2.1. Impact Modifier
- 9.2.2. Wire and Cable Jacketing
- 9.2.3. Hose and Tubing
- 9.2.4. Adhesives
- 9.2.5. Other Applications
- 9.1. Market Analysis, Insights and Forecast - by Product
- 10. Middle East and Africa CPE Market Analysis, Insights and Forecast, 2019-2031
- 10.1. Market Analysis, Insights and Forecast - by Product
- 10.1.1. CPE 135A
- 10.1.2. CPA 135B
- 10.1.3. Other Products
- 10.2. Market Analysis, Insights and Forecast - by Application
- 10.2.1. Impact Modifier
- 10.2.2. Wire and Cable Jacketing
- 10.2.3. Hose and Tubing
- 10.2.4. Adhesives
- 10.2.5. Other Applications
- 10.1. Market Analysis, Insights and Forecast - by Product
- 11. Competitive Analysis
- 11.1. Global Market Share Analysis 2024
- 11.2. Company Profiles
- 11.2.1 Aurora Material Solutions
- 11.2.1.1. Overview
- 11.2.1.2. Products
- 11.2.1.3. SWOT Analysis
- 11.2.1.4. Recent Developments
- 11.2.1.5. Financials (Based on Availability)
- 11.2.2 Bontecn Group China Co Ltd
- 11.2.2.1. Overview
- 11.2.2.2. Products
- 11.2.2.3. SWOT Analysis
- 11.2.2.4. Recent Developments
- 11.2.2.5. Financials (Based on Availability)
- 11.2.3 Dow
- 11.2.3.1. Overview
- 11.2.3.2. Products
- 11.2.3.3. SWOT Analysis
- 11.2.3.4. Recent Developments
- 11.2.3.5. Financials (Based on Availability)
- 11.2.4 Dycon Chemicals
- 11.2.4.1. Overview
- 11.2.4.2. Products
- 11.2.4.3. SWOT Analysis
- 11.2.4.4. Recent Developments
- 11.2.4.5. Financials (Based on Availability)
- 11.2.5 Hangzhou Keli Chemical Co Ltd
- 11.2.5.1. Overview
- 11.2.5.2. Products
- 11.2.5.3. SWOT Analysis
- 11.2.5.4. Recent Developments
- 11.2.5.5. Financials (Based on Availability)
- 11.2.6 Jiangsu Tianteng Chemical Industry Co Ltd
- 11.2.6.1. Overview
- 11.2.6.2. Products
- 11.2.6.3. SWOT Analysis
- 11.2.6.4. Recent Developments
- 11.2.6.5. Financials (Based on Availability)
- 11.2.7 Resonac Holdings Corporation
- 11.2.7.1. Overview
- 11.2.7.2. Products
- 11.2.7.3. SWOT Analysis
- 11.2.7.4. Recent Developments
- 11.2.7.5. Financials (Based on Availability)
- 11.2.8 Shandong Gaoxin Chemical Co Ltd
- 11.2.8.1. Overview
- 11.2.8.2. Products
- 11.2.8.3. SWOT Analysis
- 11.2.8.4. Recent Developments
- 11.2.8.5. Financials (Based on Availability)
- 11.2.9 Shandong Ketian Chemical Co Ltd
- 11.2.9.1. Overview
- 11.2.9.2. Products
- 11.2.9.3. SWOT Analysis
- 11.2.9.4. Recent Developments
- 11.2.9.5. Financials (Based on Availability)
- 11.2.10 Shandong Novista Chemical Ltd (Novista Group)
- 11.2.10.1. Overview
- 11.2.10.2. Products
- 11.2.10.3. SWOT Analysis
- 11.2.10.4. Recent Developments
- 11.2.10.5. Financials (Based on Availability)
- 11.2.11 Shandong Xiangsheng New Materials Technology Co Ltd
- 11.2.11.1. Overview
- 11.2.11.2. Products
- 11.2.11.3. SWOT Analysis
- 11.2.11.4. Recent Developments
- 11.2.11.5. Financials (Based on Availability)
- 11.2.12 Shandong Xuye New Materials Co Ltd
- 11.2.12.1. Overview
- 11.2.12.2. Products
- 11.2.12.3. SWOT Analysis
- 11.2.12.4. Recent Developments
- 11.2.12.5. Financials (Based on Availability)
- 11.2.13 Sundow Polymers Co Ltd
- 11.2.13.1. Overview
- 11.2.13.2. Products
- 11.2.13.3. SWOT Analysis
- 11.2.13.4. Recent Developments
- 11.2.13.5. Financials (Based on Availability)
- 11.2.14 Weifang Yaxing Chemical Co Ltd*List Not Exhaustive
- 11.2.14.1. Overview
- 11.2.14.2. Products
- 11.2.14.3. SWOT Analysis
- 11.2.14.4. Recent Developments
- 11.2.14.5. Financials (Based on Availability)
- 11.2.1 Aurora Material Solutions
List of Figures
- Figure 1: Global CPE Market Revenue Breakdown (Million, %) by Region 2024 & 2032
- Figure 2: Global CPE Market Volume Breakdown (Million, %) by Region 2024 & 2032
- Figure 3: Asia Pacific CPE Market Revenue (Million), by Product 2024 & 2032
- Figure 4: Asia Pacific CPE Market Volume (Million), by Product 2024 & 2032
- Figure 5: Asia Pacific CPE Market Revenue Share (%), by Product 2024 & 2032
- Figure 6: Asia Pacific CPE Market Volume Share (%), by Product 2024 & 2032
- Figure 7: Asia Pacific CPE Market Revenue (Million), by Application 2024 & 2032
- Figure 8: Asia Pacific CPE Market Volume (Million), by Application 2024 & 2032
- Figure 9: Asia Pacific CPE Market Revenue Share (%), by Application 2024 & 2032
- Figure 10: Asia Pacific CPE Market Volume Share (%), by Application 2024 & 2032
- Figure 11: Asia Pacific CPE Market Revenue (Million), by Country 2024 & 2032
- Figure 12: Asia Pacific CPE Market Volume (Million), by Country 2024 & 2032
- Figure 13: Asia Pacific CPE Market Revenue Share (%), by Country 2024 & 2032
- Figure 14: Asia Pacific CPE Market Volume Share (%), by Country 2024 & 2032
- Figure 15: North America CPE Market Revenue (Million), by Product 2024 & 2032
- Figure 16: North America CPE Market Volume (Million), by Product 2024 & 2032
- Figure 17: North America CPE Market Revenue Share (%), by Product 2024 & 2032
- Figure 18: North America CPE Market Volume Share (%), by Product 2024 & 2032
- Figure 19: North America CPE Market Revenue (Million), by Application 2024 & 2032
- Figure 20: North America CPE Market Volume (Million), by Application 2024 & 2032
- Figure 21: North America CPE Market Revenue Share (%), by Application 2024 & 2032
- Figure 22: North America CPE Market Volume Share (%), by Application 2024 & 2032
- Figure 23: North America CPE Market Revenue (Million), by Country 2024 & 2032
- Figure 24: North America CPE Market Volume (Million), by Country 2024 & 2032
- Figure 25: North America CPE Market Revenue Share (%), by Country 2024 & 2032
- Figure 26: North America CPE Market Volume Share (%), by Country 2024 & 2032
- Figure 27: Europe CPE Market Revenue (Million), by Product 2024 & 2032
- Figure 28: Europe CPE Market Volume (Million), by Product 2024 & 2032
- Figure 29: Europe CPE Market Revenue Share (%), by Product 2024 & 2032
- Figure 30: Europe CPE Market Volume Share (%), by Product 2024 & 2032
- Figure 31: Europe CPE Market Revenue (Million), by Application 2024 & 2032
- Figure 32: Europe CPE Market Volume (Million), by Application 2024 & 2032
- Figure 33: Europe CPE Market Revenue Share (%), by Application 2024 & 2032
- Figure 34: Europe CPE Market Volume Share (%), by Application 2024 & 2032
- Figure 35: Europe CPE Market Revenue (Million), by Country 2024 & 2032
- Figure 36: Europe CPE Market Volume (Million), by Country 2024 & 2032
- Figure 37: Europe CPE Market Revenue Share (%), by Country 2024 & 2032
- Figure 38: Europe CPE Market Volume Share (%), by Country 2024 & 2032
- Figure 39: South America CPE Market Revenue (Million), by Product 2024 & 2032
- Figure 40: South America CPE Market Volume (Million), by Product 2024 & 2032
- Figure 41: South America CPE Market Revenue Share (%), by Product 2024 & 2032
- Figure 42: South America CPE Market Volume Share (%), by Product 2024 & 2032
- Figure 43: South America CPE Market Revenue (Million), by Application 2024 & 2032
- Figure 44: South America CPE Market Volume (Million), by Application 2024 & 2032
- Figure 45: South America CPE Market Revenue Share (%), by Application 2024 & 2032
- Figure 46: South America CPE Market Volume Share (%), by Application 2024 & 2032
- Figure 47: South America CPE Market Revenue (Million), by Country 2024 & 2032
- Figure 48: South America CPE Market Volume (Million), by Country 2024 & 2032
- Figure 49: South America CPE Market Revenue Share (%), by Country 2024 & 2032
- Figure 50: South America CPE Market Volume Share (%), by Country 2024 & 2032
- Figure 51: Middle East and Africa CPE Market Revenue (Million), by Product 2024 & 2032
- Figure 52: Middle East and Africa CPE Market Volume (Million), by Product 2024 & 2032
- Figure 53: Middle East and Africa CPE Market Revenue Share (%), by Product 2024 & 2032
- Figure 54: Middle East and Africa CPE Market Volume Share (%), by Product 2024 & 2032
- Figure 55: Middle East and Africa CPE Market Revenue (Million), by Application 2024 & 2032
- Figure 56: Middle East and Africa CPE Market Volume (Million), by Application 2024 & 2032
- Figure 57: Middle East and Africa CPE Market Revenue Share (%), by Application 2024 & 2032
- Figure 58: Middle East and Africa CPE Market Volume Share (%), by Application 2024 & 2032
- Figure 59: Middle East and Africa CPE Market Revenue (Million), by Country 2024 & 2032
- Figure 60: Middle East and Africa CPE Market Volume (Million), by Country 2024 & 2032
- Figure 61: Middle East and Africa CPE Market Revenue Share (%), by Country 2024 & 2032
- Figure 62: Middle East and Africa CPE Market Volume Share (%), by Country 2024 & 2032
List of Tables
- Table 1: Global CPE Market Revenue Million Forecast, by Region 2019 & 2032
- Table 2: Global CPE Market Volume Million Forecast, by Region 2019 & 2032
- Table 3: Global CPE Market Revenue Million Forecast, by Product 2019 & 2032
- Table 4: Global CPE Market Volume Million Forecast, by Product 2019 & 2032
- Table 5: Global CPE Market Revenue Million Forecast, by Application 2019 & 2032
- Table 6: Global CPE Market Volume Million Forecast, by Application 2019 & 2032
- Table 7: Global CPE Market Revenue Million Forecast, by Region 2019 & 2032
- Table 8: Global CPE Market Volume Million Forecast, by Region 2019 & 2032
- Table 9: Global CPE Market Revenue Million Forecast, by Product 2019 & 2032
- Table 10: Global CPE Market Volume Million Forecast, by Product 2019 & 2032
- Table 11: Global CPE Market Revenue Million Forecast, by Application 2019 & 2032
- Table 12: Global CPE Market Volume Million Forecast, by Application 2019 & 2032
- Table 13: Global CPE Market Revenue Million Forecast, by Country 2019 & 2032
- Table 14: Global CPE Market Volume Million Forecast, by Country 2019 & 2032
- Table 15: China CPE Market Revenue (Million) Forecast, by Application 2019 & 2032
- Table 16: China CPE Market Volume (Million) Forecast, by Application 2019 & 2032
- Table 17: India CPE Market Revenue (Million) Forecast, by Application 2019 & 2032
- Table 18: India CPE Market Volume (Million) Forecast, by Application 2019 & 2032
- Table 19: Japan CPE Market Revenue (Million) Forecast, by Application 2019 & 2032
- Table 20: Japan CPE Market Volume (Million) Forecast, by Application 2019 & 2032
- Table 21: South Korea CPE Market Revenue (Million) Forecast, by Application 2019 & 2032
- Table 22: South Korea CPE Market Volume (Million) Forecast, by Application 2019 & 2032
- Table 23: Rest of Asia Pacific CPE Market Revenue (Million) Forecast, by Application 2019 & 2032
- Table 24: Rest of Asia Pacific CPE Market Volume (Million) Forecast, by Application 2019 & 2032
- Table 25: Global CPE Market Revenue Million Forecast, by Product 2019 & 2032
- Table 26: Global CPE Market Volume Million Forecast, by Product 2019 & 2032
- Table 27: Global CPE Market Revenue Million Forecast, by Application 2019 & 2032
- Table 28: Global CPE Market Volume Million Forecast, by Application 2019 & 2032
- Table 29: Global CPE Market Revenue Million Forecast, by Country 2019 & 2032
- Table 30: Global CPE Market Volume Million Forecast, by Country 2019 & 2032
- Table 31: United States CPE Market Revenue (Million) Forecast, by Application 2019 & 2032
- Table 32: United States CPE Market Volume (Million) Forecast, by Application 2019 & 2032
- Table 33: Canada CPE Market Revenue (Million) Forecast, by Application 2019 & 2032
- Table 34: Canada CPE Market Volume (Million) Forecast, by Application 2019 & 2032
- Table 35: Mexico CPE Market Revenue (Million) Forecast, by Application 2019 & 2032
- Table 36: Mexico CPE Market Volume (Million) Forecast, by Application 2019 & 2032
- Table 37: Global CPE Market Revenue Million Forecast, by Product 2019 & 2032
- Table 38: Global CPE Market Volume Million Forecast, by Product 2019 & 2032
- Table 39: Global CPE Market Revenue Million Forecast, by Application 2019 & 2032
- Table 40: Global CPE Market Volume Million Forecast, by Application 2019 & 2032
- Table 41: Global CPE Market Revenue Million Forecast, by Country 2019 & 2032
- Table 42: Global CPE Market Volume Million Forecast, by Country 2019 & 2032
- Table 43: Germany CPE Market Revenue (Million) Forecast, by Application 2019 & 2032
- Table 44: Germany CPE Market Volume (Million) Forecast, by Application 2019 & 2032
- Table 45: United Kingdom CPE Market Revenue (Million) Forecast, by Application 2019 & 2032
- Table 46: United Kingdom CPE Market Volume (Million) Forecast, by Application 2019 & 2032
- Table 47: France CPE Market Revenue (Million) Forecast, by Application 2019 & 2032
- Table 48: France CPE Market Volume (Million) Forecast, by Application 2019 & 2032
- Table 49: Italy CPE Market Revenue (Million) Forecast, by Application 2019 & 2032
- Table 50: Italy CPE Market Volume (Million) Forecast, by Application 2019 & 2032
- Table 51: Rest of Europe CPE Market Revenue (Million) Forecast, by Application 2019 & 2032
- Table 52: Rest of Europe CPE Market Volume (Million) Forecast, by Application 2019 & 2032
- Table 53: Global CPE Market Revenue Million Forecast, by Product 2019 & 2032
- Table 54: Global CPE Market Volume Million Forecast, by Product 2019 & 2032
- Table 55: Global CPE Market Revenue Million Forecast, by Application 2019 & 2032
- Table 56: Global CPE Market Volume Million Forecast, by Application 2019 & 2032
- Table 57: Global CPE Market Revenue Million Forecast, by Country 2019 & 2032
- Table 58: Global CPE Market Volume Million Forecast, by Country 2019 & 2032
- Table 59: Brazil CPE Market Revenue (Million) Forecast, by Application 2019 & 2032
- Table 60: Brazil CPE Market Volume (Million) Forecast, by Application 2019 & 2032
- Table 61: Argentina CPE Market Revenue (Million) Forecast, by Application 2019 & 2032
- Table 62: Argentina CPE Market Volume (Million) Forecast, by Application 2019 & 2032
- Table 63: Rest of South America CPE Market Revenue (Million) Forecast, by Application 2019 & 2032
- Table 64: Rest of South America CPE Market Volume (Million) Forecast, by Application 2019 & 2032
- Table 65: Global CPE Market Revenue Million Forecast, by Product 2019 & 2032
- Table 66: Global CPE Market Volume Million Forecast, by Product 2019 & 2032
- Table 67: Global CPE Market Revenue Million Forecast, by Application 2019 & 2032
- Table 68: Global CPE Market Volume Million Forecast, by Application 2019 & 2032
- Table 69: Global CPE Market Revenue Million Forecast, by Country 2019 & 2032
- Table 70: Global CPE Market Volume Million Forecast, by Country 2019 & 2032
- Table 71: Saudi Arabia CPE Market Revenue (Million) Forecast, by Application 2019 & 2032
- Table 72: Saudi Arabia CPE Market Volume (Million) Forecast, by Application 2019 & 2032
- Table 73: South Africa CPE Market Revenue (Million) Forecast, by Application 2019 & 2032
- Table 74: South Africa CPE Market Volume (Million) Forecast, by Application 2019 & 2032
- Table 75: Rest of Middle East and Africa CPE Market Revenue (Million) Forecast, by Application 2019 & 2032
- Table 76: Rest of Middle East and Africa CPE Market Volume (Million) Forecast, by Application 2019 & 2032
Frequently Asked Questions
1. What is the projected Compound Annual Growth Rate (CAGR) of the CPE Market?
The projected CAGR is approximately 5.45%.
2. Which companies are prominent players in the CPE Market?
Key companies in the market include Aurora Material Solutions, Bontecn Group China Co Ltd, Dow, Dycon Chemicals, Hangzhou Keli Chemical Co Ltd, Jiangsu Tianteng Chemical Industry Co Ltd, Resonac Holdings Corporation, Shandong Gaoxin Chemical Co Ltd, Shandong Ketian Chemical Co Ltd, Shandong Novista Chemical Ltd (Novista Group), Shandong Xiangsheng New Materials Technology Co Ltd, Shandong Xuye New Materials Co Ltd, Sundow Polymers Co Ltd, Weifang Yaxing Chemical Co Ltd*List Not Exhaustive.
3. What are the main segments of the CPE Market?
The market segments include Product, Application.
4. Can you provide details about the market size?
The market size is estimated to be USD 721.25 Million as of 2022.
5. What are some drivers contributing to market growth?
Rising Demand for CPE-based Impact Modifiers in PVC Products; Growing Demand for CPE-based Hoses and Tubes in the Automotive Industry.
6. What are the notable trends driving market growth?
Impact Modifier is Expected to Dominate the Market.
7. Are there any restraints impacting market growth?
Rising Demand for CPE-based Impact Modifiers in PVC Products; Growing Demand for CPE-based Hoses and Tubes in the Automotive Industry.
8. Can you provide examples of recent developments in the market?
May 2024: Aurora Plastics LLC (Aurora) announced the acquisition of EnCom Polymers Inc., extending its product offering to include chlorinated polyethylene alloys (CPE). This acquisition strengthened Aurora Plastics LLC's product portfolio.
9. What pricing options are available for accessing the report?
Pricing options include single-user, multi-user, and enterprise licenses priced at USD 4750, USD 5250, and USD 8750 respectively.
10. Is the market size provided in terms of value or volume?
The market size is provided in terms of value, measured in Million and volume, measured in Million.
11. Are there any specific market keywords associated with the report?
Yes, the market keyword associated with the report is "CPE Market," which aids in identifying and referencing the specific market segment covered.
12. How do I determine which pricing option suits my needs best?
The pricing options vary based on user requirements and access needs. Individual users may opt for single-user licenses, while businesses requiring broader access may choose multi-user or enterprise licenses for cost-effective access to the report.
13. Are there any additional resources or data provided in the CPE Market report?
While the report offers comprehensive insights, it's advisable to review the specific contents or supplementary materials provided to ascertain if additional resources or data are available.
14. How can I stay updated on further developments or reports in the CPE Market?
To stay informed about further developments, trends, and reports in the CPE Market, consider subscribing to industry newsletters, following relevant companies and organizations, or regularly checking reputable industry news sources and publications.
Methodology
Step 1 - Identification of Relevant Samples Size from Population Database


Step 2 - Approaches for Defining Global Market Size (Value, Volume* & Price*)

Note*: In applicable scenarios
Step 3 - Data Sources
Primary Research
- Web Analytics
- Survey Reports
- Research Institute
- Latest Research Reports
- Opinion Leaders
Secondary Research
- Annual Reports
- White Paper
- Latest Press Release
- Industry Association
- Paid Database
- Investor Presentations

Step 4 - Data Triangulation
Involves using different sources of information in order to increase the validity of a study
These sources are likely to be stakeholders in a program - participants, other researchers, program staff, other community members, and so on.
Then we put all data in single framework & apply various statistical tools to find out the dynamic on the market.
During the analysis stage, feedback from the stakeholder groups would be compared to determine areas of agreement as well as areas of divergence


