
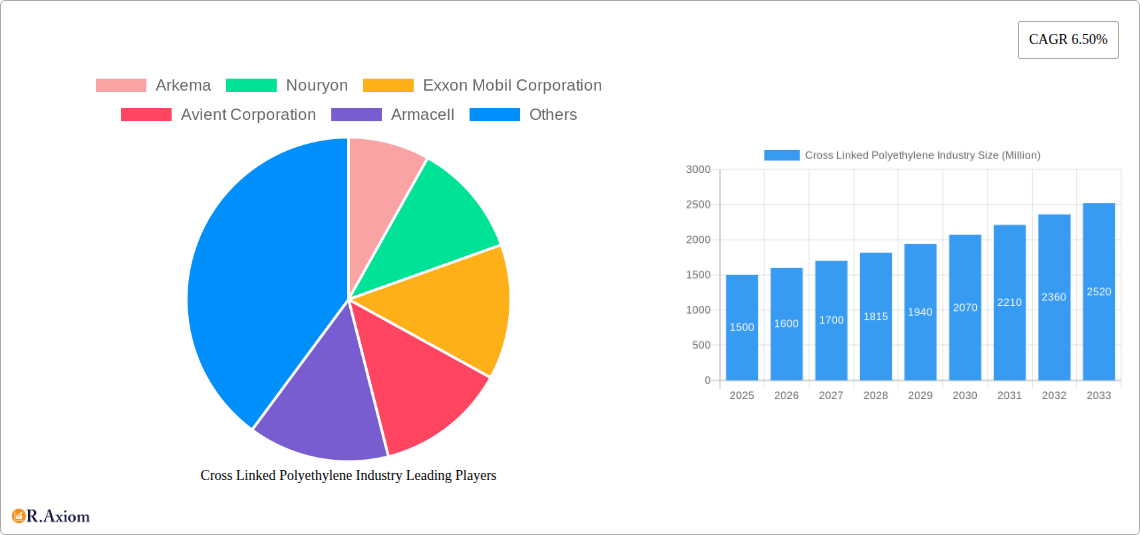
Key Insights
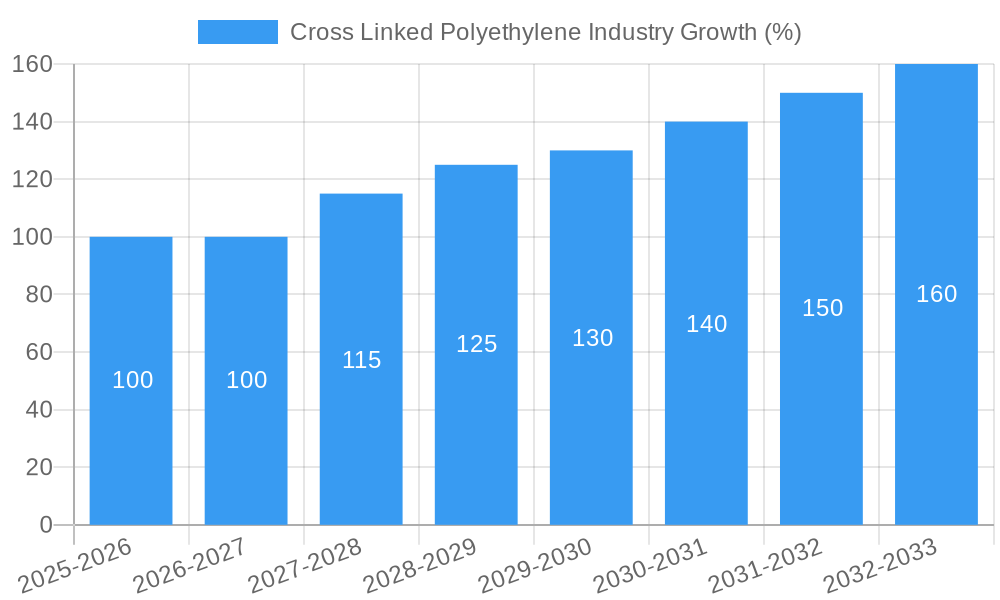
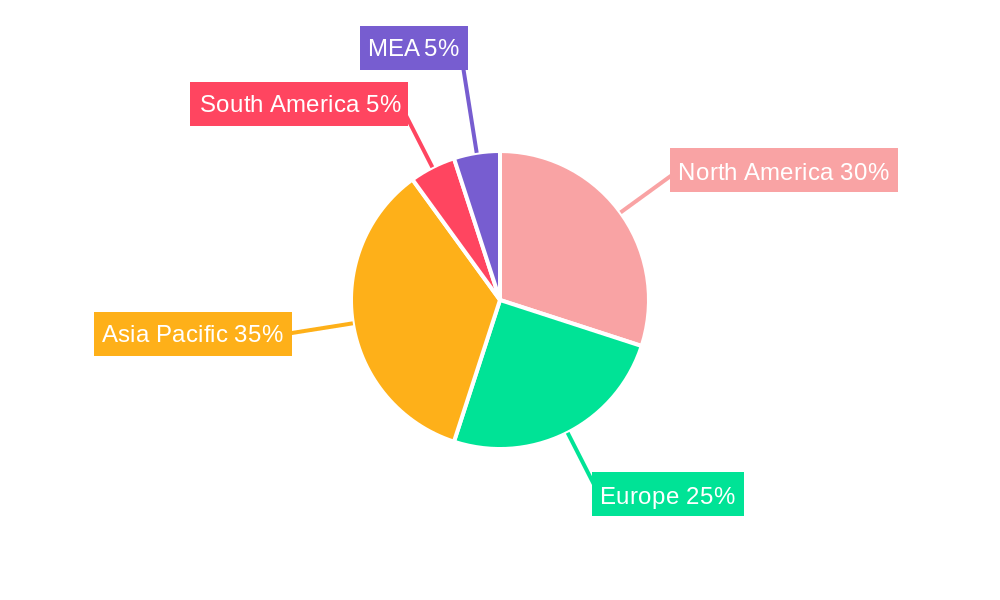
The cross-linked polyethylene (XLPE) market, valued at approximately $XX million in 2025, is projected to experience robust growth, driven by a compound annual growth rate (CAGR) of 6.50% from 2025 to 2033. This expansion is fueled by several key factors. The building and construction sector's increasing demand for insulation materials, particularly in high-performance applications like undersea cables and high-voltage power transmission, significantly contributes to market growth. Furthermore, the burgeoning electrical and electronics industry, with its need for high-dielectric strength and flexible insulation, presents a substantial opportunity for XLPE. Advances in XLPE technology, leading to improved durability, enhanced heat resistance, and greater flexibility, are further stimulating market adoption across diverse end-use sectors, including automotive, medical, and chemical industries. While the market faces challenges such as fluctuating raw material prices and stringent environmental regulations, the overall positive industry outlook is bolstered by ongoing research and development focusing on sustainable and high-performance XLPE formulations. The geographic distribution of this growth is expected to be fairly diverse, with North America and Asia-Pacific regions anticipated to lead due to their extensive infrastructure development and robust manufacturing sectors.
The competitive landscape within the XLPE market is characterized by the presence of both established multinational corporations and specialized manufacturers. Key players such as Arkema, Nouryon, ExxonMobil, Avient, and Dow are investing heavily in research and development to improve XLPE properties and expand their product portfolios. Strategic partnerships, mergers, and acquisitions are likely to continue shaping the market dynamics. Regional variations exist, with specific growth pockets emerging in developing economies fueled by increasing infrastructure investment and industrialization. The continued focus on improving insulation performance in energy-efficient buildings and the growing demand for reliable and safe electrical infrastructure will continue to underpin the positive growth trajectory of the XLPE market in the coming years. Furthermore, the ongoing shift towards renewable energy sources may present new opportunities for XLPE in applications such as solar panels and wind turbines.
Cross Linked Polyethylene (XLPE) Industry Report: 2019-2033
This comprehensive report provides a detailed analysis of the Cross Linked Polyethylene (XLPE) industry, offering valuable insights for stakeholders across the value chain. With a study period spanning 2019-2033, a base year of 2025, and a forecast period of 2025-2033, this report delivers critical data and projections to inform strategic decision-making. The report covers market size, segmentation, key players, industry trends, and future opportunities. The global market value in 2025 is estimated at xx Million, with a projected value of xx Million by 2033.
Cross Linked Polyethylene Industry Market Concentration & Innovation
The Cross Linked Polyethylene (XLPE) industry exhibits a moderately concentrated market structure, with several key players holding significant market share. Market concentration is influenced by factors such as economies of scale in production, technological advancements, and the presence of strong brand recognition. While precise market share data for individual companies is proprietary, leading players like Dow, Borealis AG, ExxonMobil, and Solvay SA command substantial portions. The industry is characterized by ongoing innovation, driven by the demand for enhanced material properties (e.g., higher temperature resistance, improved flexibility, and increased durability).
- Innovation Drivers: Focus on sustainability (bio-based XLPE, recyclability), improved processing technologies, and the development of specialized XLPE grades for niche applications.
- Regulatory Frameworks: Environmental regulations, including those related to plastic waste management and carbon emissions, are impacting the industry, promoting the adoption of sustainable XLPE solutions.
- Product Substitutes: Alternatives such as other polymers (e.g., PVC, fluoropolymers) and advanced composite materials pose some competitive pressure, although XLPE maintains advantages in certain applications due to its cost-effectiveness and performance characteristics.
- End-User Trends: Increasing demand from sectors like building & construction (pipes, insulation), electrical & electronics (cable jacketing), and automotive (under-hood components) are driving market growth.
- M&A Activities: The industry has witnessed several mergers and acquisitions in recent years, although quantifiable deal values are not publicly available for all transactions. These activities aim to consolidate market share, expand product portfolios, and enhance technological capabilities. For example, partnerships like the one between Borealis AG and Uponor reflect strategic alliances for innovation and market penetration.
Cross Linked Polyethylene Industry Industry Trends & Insights
The XLPE market is experiencing robust growth, driven by several key factors. The Compound Annual Growth Rate (CAGR) during the forecast period (2025-2033) is estimated to be xx%. This growth is fueled by increasing demand from diverse end-user sectors, particularly in developing economies experiencing rapid infrastructure development. Technological advancements, such as the development of high-performance XLPE grades with enhanced properties, are contributing to market expansion. Furthermore, consumer preferences are shifting towards sustainable and eco-friendly materials, influencing the development and adoption of recyclable and bio-based XLPE solutions. Competitive dynamics are characterized by both innovation and consolidation, with leading players investing in research and development and strategic partnerships to maintain their market positions. Market penetration is particularly high in established markets, with significant growth potential in emerging markets.
Dominant Markets & Segments in Cross Linked Polyethylene Industry
The building and construction sector represents a dominant end-use segment for XLPE, driven by its extensive use in pipes, insulation, and other applications. High-density polyethylene (HDPE) is a leading type of XLPE due to its superior mechanical properties, while LDPE finds applications where flexibility is crucial. Geographically, regions with robust infrastructure development and industrial growth, such as Asia-Pacific, are showing substantial growth in XLPE demand.
Key Drivers for Building & Construction: Increasing urbanization, infrastructure projects (water management, energy distribution), and government initiatives promoting sustainable building materials.
Key Drivers for Electrical & Electronics: Growing demand for high-voltage cables, data centers, and electrical installations in residential and commercial buildings.
Dominance Analysis: The dominance of building and construction and Asia-Pacific is attributed to factors such as rapid urbanization, economic growth, and favorable government policies. The dominance of HDPE is due to its versatility and high-performance properties.
Regional Dominance: Asia-Pacific (xx Million in 2025) is expected to be the dominant region due to significant infrastructure development and industrial growth.
Cross Linked Polyethylene Industry Product Developments
Recent product innovations in the XLPE industry focus on enhancing material properties, such as improved resistance to high temperatures and chemicals, increased flexibility, and enhanced durability. These advancements cater to specific application needs, creating competitive advantages for manufacturers. The emphasis on sustainability is also driving the development of recyclable and bio-based XLPE solutions. These product developments respond directly to the demands of various end-use industries, facilitating wider adoption and driving market growth. Further innovations incorporate nanomaterials to improve the performance of the polymer.
Report Scope & Segmentation Analysis
This report segments the XLPE market based on type (HDPE, LDPE, Other Types) and end-user industry (Building & Construction, Electrical & Electronics, Automotive, Medical, Chemical Industry, Other End-user Industries). Each segment's growth projections, market size (in Millions), and competitive dynamics are analyzed in detail. The building and construction segment shows the highest growth potential due to significant infrastructure investments and the inherent properties of XLPE for pipes and cabling. The electrical and electronics segment presents a large market opportunity driven by the increasing demand for advanced cable insulation and jacketing. The automotive industry is a steadily growing market for this material. Each segment displays unique dynamics based on the properties needed for specific applications.
Key Drivers of Cross Linked Polyethylene Industry Growth
Several key factors contribute to the growth of the XLPE market:
- Technological Advancements: Development of higher-performance XLPE grades with improved properties (e.g., heat resistance, flexibility) and the adoption of sustainable manufacturing processes.
- Economic Growth: Expanding infrastructure projects in developing economies and rising disposable incomes in developed nations drive demand for XLPE-based products.
- Government Regulations: Policies promoting sustainable construction materials and energy-efficient infrastructure are influencing the adoption of XLPE.
Challenges in the Cross Linked Polyethylene Industry Sector
The XLPE industry faces several challenges:
- Fluctuating Raw Material Prices: The cost of polyethylene resin, a key raw material, can impact XLPE production costs and profitability.
- Environmental Concerns: Growing environmental awareness and stricter regulations regarding plastic waste management necessitate the development of more sustainable solutions.
- Intense Competition: The presence of numerous players in the market creates competitive pressures, requiring continuous innovation and cost optimization.
Emerging Opportunities in Cross Linked Polyethylene Industry
The XLPE market presents several emerging opportunities:
- Sustainable XLPE Solutions: Demand for recyclable and bio-based XLPE is increasing, creating opportunities for manufacturers to develop and market eco-friendly products.
- Expansion into New Applications: XLPE's versatility allows for its use in innovative applications, creating growth potential in sectors beyond traditional end-use industries.
- Technological Advancements: Innovation in processing techniques and material science can enhance XLPE properties and open up new possibilities.
Leading Players in the Cross Linked Polyethylene Industry Market
- Arkema
- Nouryon
- Exxon Mobil Corporation
- Avient Corporation
- Armacell
- Dow
- Hanwha Chemical
- Lyondelbasell Industries NV
- Borealis AG
- Solvay SA
Key Developments in Cross Linked Polyethylene Industry Industry
- June 2022: Borealis AG partnered with Uponor to develop PE-X blue pipes made from PEX with renewable feedstock, accredited under the ISCC PLUS scheme. This development highlights the industry's focus on sustainability.
- January 2023: Borealis AG announced its Borcycle C chemical recycling process for PE-X and XLPE, enabling the creation of recycled polyethylene while maintaining industry standards. This demonstrates the growing importance of circular economy solutions in the XLPE industry.
Strategic Outlook for Cross Linked Polyethylene Industry Market
The XLPE market is poised for continued growth, driven by increasing demand from diverse end-use sectors and ongoing technological innovations. The focus on sustainability and the development of eco-friendly solutions will be crucial in shaping the future of the industry. Strategic partnerships and mergers & acquisitions will likely continue to reshape the market landscape. Expansion into new applications and geographic markets will present further growth opportunities for key players. The industry's commitment to circularity and the development of recyclable materials will be a major driver of future market success.
Cross Linked Polyethylene Industry Segmentation
-
1. Type
- 1.1. High-density Polyethylene (HDPE)
- 1.2. Low-density Polyethylene (LDPE)
- 1.3. Other Types
-
2. End-user Industry
- 2.1. Building and Construction
- 2.2. Electrical and Electronics
- 2.3. Automotive
- 2.4. Medical
- 2.5. Chemical Industry
- 2.6. Other End-user Industries
Cross Linked Polyethylene Industry Segmentation By Geography
-
1. Asia Pacific
- 1.1. China
- 1.2. India
- 1.3. Japan
- 1.4. South Korea
- 1.5. ASEAN Countries
- 1.6. Rest of Asia Pacific
-
2. North America
- 2.1. United States
- 2.2. Canada
- 2.3. Mexico
-
3. Europe
- 3.1. Germany
- 3.2. United Kingdom
- 3.3. Italy
- 3.4. France
- 3.5. Rest of Europe
-
4. South America
- 4.1. Brazil
- 4.2. Argentina
- 4.3. Rest of South America
- 5. Middle East
-
6. Saudi Arabia
- 6.1. South Africa
- 6.2. United Arab Emirates
- 6.3. Rest of Middle East
Cross Linked Polyethylene Industry REPORT HIGHLIGHTS
| Aspects | Details |
|---|---|
| Study Period | 2019-2033 |
| Base Year | 2024 |
| Estimated Year | 2025 |
| Forecast Period | 2025-2033 |
| Historical Period | 2019-2024 |
| Growth Rate | CAGR of 6.50% from 2019-2033 |
| Segmentation |
|
Table of Contents
- 1. Introduction
- 1.1. Research Scope
- 1.2. Market Segmentation
- 1.3. Research Methodology
- 1.4. Definitions and Assumptions
- 2. Executive Summary
- 2.1. Introduction
- 3. Market Dynamics
- 3.1. Introduction
- 3.2. Market Drivers
- 3.2.1 Low-cost
- 3.2.2 Flexibility
- 3.2.3 and Easy Installation Of XLPE; Surge in Demand from Pipe and Tubing Applications; Other Drivers
- 3.3. Market Restrains
- 3.3.1. Fluctuation in Raw Material Prices; Low Heat Transfer Resistance and Adhesion
- 3.4. Market Trends
- 3.4.1. Building and construction to Dominate the Market
- 4. Market Factor Analysis
- 4.1. Porters Five Forces
- 4.2. Supply/Value Chain
- 4.3. PESTEL analysis
- 4.4. Market Entropy
- 4.5. Patent/Trademark Analysis
- 5. Global Cross Linked Polyethylene Industry Analysis, Insights and Forecast, 2019-2031
- 5.1. Market Analysis, Insights and Forecast - by Type
- 5.1.1. High-density Polyethylene (HDPE)
- 5.1.2. Low-density Polyethylene (LDPE)
- 5.1.3. Other Types
- 5.2. Market Analysis, Insights and Forecast - by End-user Industry
- 5.2.1. Building and Construction
- 5.2.2. Electrical and Electronics
- 5.2.3. Automotive
- 5.2.4. Medical
- 5.2.5. Chemical Industry
- 5.2.6. Other End-user Industries
- 5.3. Market Analysis, Insights and Forecast - by Region
- 5.3.1. Asia Pacific
- 5.3.2. North America
- 5.3.3. Europe
- 5.3.4. South America
- 5.3.5. Middle East
- 5.3.6. Saudi Arabia
- 5.1. Market Analysis, Insights and Forecast - by Type
- 6. Asia Pacific Cross Linked Polyethylene Industry Analysis, Insights and Forecast, 2019-2031
- 6.1. Market Analysis, Insights and Forecast - by Type
- 6.1.1. High-density Polyethylene (HDPE)
- 6.1.2. Low-density Polyethylene (LDPE)
- 6.1.3. Other Types
- 6.2. Market Analysis, Insights and Forecast - by End-user Industry
- 6.2.1. Building and Construction
- 6.2.2. Electrical and Electronics
- 6.2.3. Automotive
- 6.2.4. Medical
- 6.2.5. Chemical Industry
- 6.2.6. Other End-user Industries
- 6.1. Market Analysis, Insights and Forecast - by Type
- 7. North America Cross Linked Polyethylene Industry Analysis, Insights and Forecast, 2019-2031
- 7.1. Market Analysis, Insights and Forecast - by Type
- 7.1.1. High-density Polyethylene (HDPE)
- 7.1.2. Low-density Polyethylene (LDPE)
- 7.1.3. Other Types
- 7.2. Market Analysis, Insights and Forecast - by End-user Industry
- 7.2.1. Building and Construction
- 7.2.2. Electrical and Electronics
- 7.2.3. Automotive
- 7.2.4. Medical
- 7.2.5. Chemical Industry
- 7.2.6. Other End-user Industries
- 7.1. Market Analysis, Insights and Forecast - by Type
- 8. Europe Cross Linked Polyethylene Industry Analysis, Insights and Forecast, 2019-2031
- 8.1. Market Analysis, Insights and Forecast - by Type
- 8.1.1. High-density Polyethylene (HDPE)
- 8.1.2. Low-density Polyethylene (LDPE)
- 8.1.3. Other Types
- 8.2. Market Analysis, Insights and Forecast - by End-user Industry
- 8.2.1. Building and Construction
- 8.2.2. Electrical and Electronics
- 8.2.3. Automotive
- 8.2.4. Medical
- 8.2.5. Chemical Industry
- 8.2.6. Other End-user Industries
- 8.1. Market Analysis, Insights and Forecast - by Type
- 9. South America Cross Linked Polyethylene Industry Analysis, Insights and Forecast, 2019-2031
- 9.1. Market Analysis, Insights and Forecast - by Type
- 9.1.1. High-density Polyethylene (HDPE)
- 9.1.2. Low-density Polyethylene (LDPE)
- 9.1.3. Other Types
- 9.2. Market Analysis, Insights and Forecast - by End-user Industry
- 9.2.1. Building and Construction
- 9.2.2. Electrical and Electronics
- 9.2.3. Automotive
- 9.2.4. Medical
- 9.2.5. Chemical Industry
- 9.2.6. Other End-user Industries
- 9.1. Market Analysis, Insights and Forecast - by Type
- 10. Middle East Cross Linked Polyethylene Industry Analysis, Insights and Forecast, 2019-2031
- 10.1. Market Analysis, Insights and Forecast - by Type
- 10.1.1. High-density Polyethylene (HDPE)
- 10.1.2. Low-density Polyethylene (LDPE)
- 10.1.3. Other Types
- 10.2. Market Analysis, Insights and Forecast - by End-user Industry
- 10.2.1. Building and Construction
- 10.2.2. Electrical and Electronics
- 10.2.3. Automotive
- 10.2.4. Medical
- 10.2.5. Chemical Industry
- 10.2.6. Other End-user Industries
- 10.1. Market Analysis, Insights and Forecast - by Type
- 11. Saudi Arabia Cross Linked Polyethylene Industry Analysis, Insights and Forecast, 2019-2031
- 11.1. Market Analysis, Insights and Forecast - by Type
- 11.1.1. High-density Polyethylene (HDPE)
- 11.1.2. Low-density Polyethylene (LDPE)
- 11.1.3. Other Types
- 11.2. Market Analysis, Insights and Forecast - by End-user Industry
- 11.2.1. Building and Construction
- 11.2.2. Electrical and Electronics
- 11.2.3. Automotive
- 11.2.4. Medical
- 11.2.5. Chemical Industry
- 11.2.6. Other End-user Industries
- 11.1. Market Analysis, Insights and Forecast - by Type
- 12. North America Cross Linked Polyethylene Industry Analysis, Insights and Forecast, 2019-2031
- 12.1. Market Analysis, Insights and Forecast - By Country/Sub-region
- 12.1.1 United States
- 12.1.2 Canada
- 12.1.3 Mexico
- 13. Europe Cross Linked Polyethylene Industry Analysis, Insights and Forecast, 2019-2031
- 13.1. Market Analysis, Insights and Forecast - By Country/Sub-region
- 13.1.1 Germany
- 13.1.2 France
- 13.1.3 Italy
- 13.1.4 United Kingdom
- 13.1.5 Netherlands
- 13.1.6 Rest of Europe
- 14. Asia Pacific Cross Linked Polyethylene Industry Analysis, Insights and Forecast, 2019-2031
- 14.1. Market Analysis, Insights and Forecast - By Country/Sub-region
- 14.1.1 China
- 14.1.2 Japan
- 14.1.3 India
- 14.1.4 South Korea
- 14.1.5 Taiwan
- 14.1.6 Australia
- 14.1.7 Rest of Asia-Pacific
- 15. South America Cross Linked Polyethylene Industry Analysis, Insights and Forecast, 2019-2031
- 15.1. Market Analysis, Insights and Forecast - By Country/Sub-region
- 15.1.1 Brazil
- 15.1.2 Argentina
- 15.1.3 Rest of South America
- 16. MEA Cross Linked Polyethylene Industry Analysis, Insights and Forecast, 2019-2031
- 16.1. Market Analysis, Insights and Forecast - By Country/Sub-region
- 16.1.1 Middle East
- 16.1.2 Africa
- 17. Competitive Analysis
- 17.1. Global Market Share Analysis 2024
- 17.2. Company Profiles
- 17.2.1 Arkema
- 17.2.1.1. Overview
- 17.2.1.2. Products
- 17.2.1.3. SWOT Analysis
- 17.2.1.4. Recent Developments
- 17.2.1.5. Financials (Based on Availability)
- 17.2.2 Nouryon
- 17.2.2.1. Overview
- 17.2.2.2. Products
- 17.2.2.3. SWOT Analysis
- 17.2.2.4. Recent Developments
- 17.2.2.5. Financials (Based on Availability)
- 17.2.3 Exxon Mobil Corporation
- 17.2.3.1. Overview
- 17.2.3.2. Products
- 17.2.3.3. SWOT Analysis
- 17.2.3.4. Recent Developments
- 17.2.3.5. Financials (Based on Availability)
- 17.2.4 Avient Corporation
- 17.2.4.1. Overview
- 17.2.4.2. Products
- 17.2.4.3. SWOT Analysis
- 17.2.4.4. Recent Developments
- 17.2.4.5. Financials (Based on Availability)
- 17.2.5 Armacell
- 17.2.5.1. Overview
- 17.2.5.2. Products
- 17.2.5.3. SWOT Analysis
- 17.2.5.4. Recent Developments
- 17.2.5.5. Financials (Based on Availability)
- 17.2.6 Dow
- 17.2.6.1. Overview
- 17.2.6.2. Products
- 17.2.6.3. SWOT Analysis
- 17.2.6.4. Recent Developments
- 17.2.6.5. Financials (Based on Availability)
- 17.2.7 Hanwha Chemical
- 17.2.7.1. Overview
- 17.2.7.2. Products
- 17.2.7.3. SWOT Analysis
- 17.2.7.4. Recent Developments
- 17.2.7.5. Financials (Based on Availability)
- 17.2.8 Lyondelbasell Industries NV
- 17.2.8.1. Overview
- 17.2.8.2. Products
- 17.2.8.3. SWOT Analysis
- 17.2.8.4. Recent Developments
- 17.2.8.5. Financials (Based on Availability)
- 17.2.9 Borealis AG
- 17.2.9.1. Overview
- 17.2.9.2. Products
- 17.2.9.3. SWOT Analysis
- 17.2.9.4. Recent Developments
- 17.2.9.5. Financials (Based on Availability)
- 17.2.10 Solvay SA
- 17.2.10.1. Overview
- 17.2.10.2. Products
- 17.2.10.3. SWOT Analysis
- 17.2.10.4. Recent Developments
- 17.2.10.5. Financials (Based on Availability)
- 17.2.1 Arkema
List of Figures
- Figure 1: Global Cross Linked Polyethylene Industry Revenue Breakdown (Million, %) by Region 2024 & 2032
- Figure 2: Global Cross Linked Polyethylene Industry Volume Breakdown (K Tons, %) by Region 2024 & 2032
- Figure 3: North America Cross Linked Polyethylene Industry Revenue (Million), by Country 2024 & 2032
- Figure 4: North America Cross Linked Polyethylene Industry Volume (K Tons), by Country 2024 & 2032
- Figure 5: North America Cross Linked Polyethylene Industry Revenue Share (%), by Country 2024 & 2032
- Figure 6: North America Cross Linked Polyethylene Industry Volume Share (%), by Country 2024 & 2032
- Figure 7: Europe Cross Linked Polyethylene Industry Revenue (Million), by Country 2024 & 2032
- Figure 8: Europe Cross Linked Polyethylene Industry Volume (K Tons), by Country 2024 & 2032
- Figure 9: Europe Cross Linked Polyethylene Industry Revenue Share (%), by Country 2024 & 2032
- Figure 10: Europe Cross Linked Polyethylene Industry Volume Share (%), by Country 2024 & 2032
- Figure 11: Asia Pacific Cross Linked Polyethylene Industry Revenue (Million), by Country 2024 & 2032
- Figure 12: Asia Pacific Cross Linked Polyethylene Industry Volume (K Tons), by Country 2024 & 2032
- Figure 13: Asia Pacific Cross Linked Polyethylene Industry Revenue Share (%), by Country 2024 & 2032
- Figure 14: Asia Pacific Cross Linked Polyethylene Industry Volume Share (%), by Country 2024 & 2032
- Figure 15: South America Cross Linked Polyethylene Industry Revenue (Million), by Country 2024 & 2032
- Figure 16: South America Cross Linked Polyethylene Industry Volume (K Tons), by Country 2024 & 2032
- Figure 17: South America Cross Linked Polyethylene Industry Revenue Share (%), by Country 2024 & 2032
- Figure 18: South America Cross Linked Polyethylene Industry Volume Share (%), by Country 2024 & 2032
- Figure 19: MEA Cross Linked Polyethylene Industry Revenue (Million), by Country 2024 & 2032
- Figure 20: MEA Cross Linked Polyethylene Industry Volume (K Tons), by Country 2024 & 2032
- Figure 21: MEA Cross Linked Polyethylene Industry Revenue Share (%), by Country 2024 & 2032
- Figure 22: MEA Cross Linked Polyethylene Industry Volume Share (%), by Country 2024 & 2032
- Figure 23: Asia Pacific Cross Linked Polyethylene Industry Revenue (Million), by Type 2024 & 2032
- Figure 24: Asia Pacific Cross Linked Polyethylene Industry Volume (K Tons), by Type 2024 & 2032
- Figure 25: Asia Pacific Cross Linked Polyethylene Industry Revenue Share (%), by Type 2024 & 2032
- Figure 26: Asia Pacific Cross Linked Polyethylene Industry Volume Share (%), by Type 2024 & 2032
- Figure 27: Asia Pacific Cross Linked Polyethylene Industry Revenue (Million), by End-user Industry 2024 & 2032
- Figure 28: Asia Pacific Cross Linked Polyethylene Industry Volume (K Tons), by End-user Industry 2024 & 2032
- Figure 29: Asia Pacific Cross Linked Polyethylene Industry Revenue Share (%), by End-user Industry 2024 & 2032
- Figure 30: Asia Pacific Cross Linked Polyethylene Industry Volume Share (%), by End-user Industry 2024 & 2032
- Figure 31: Asia Pacific Cross Linked Polyethylene Industry Revenue (Million), by Country 2024 & 2032
- Figure 32: Asia Pacific Cross Linked Polyethylene Industry Volume (K Tons), by Country 2024 & 2032
- Figure 33: Asia Pacific Cross Linked Polyethylene Industry Revenue Share (%), by Country 2024 & 2032
- Figure 34: Asia Pacific Cross Linked Polyethylene Industry Volume Share (%), by Country 2024 & 2032
- Figure 35: North America Cross Linked Polyethylene Industry Revenue (Million), by Type 2024 & 2032
- Figure 36: North America Cross Linked Polyethylene Industry Volume (K Tons), by Type 2024 & 2032
- Figure 37: North America Cross Linked Polyethylene Industry Revenue Share (%), by Type 2024 & 2032
- Figure 38: North America Cross Linked Polyethylene Industry Volume Share (%), by Type 2024 & 2032
- Figure 39: North America Cross Linked Polyethylene Industry Revenue (Million), by End-user Industry 2024 & 2032
- Figure 40: North America Cross Linked Polyethylene Industry Volume (K Tons), by End-user Industry 2024 & 2032
- Figure 41: North America Cross Linked Polyethylene Industry Revenue Share (%), by End-user Industry 2024 & 2032
- Figure 42: North America Cross Linked Polyethylene Industry Volume Share (%), by End-user Industry 2024 & 2032
- Figure 43: North America Cross Linked Polyethylene Industry Revenue (Million), by Country 2024 & 2032
- Figure 44: North America Cross Linked Polyethylene Industry Volume (K Tons), by Country 2024 & 2032
- Figure 45: North America Cross Linked Polyethylene Industry Revenue Share (%), by Country 2024 & 2032
- Figure 46: North America Cross Linked Polyethylene Industry Volume Share (%), by Country 2024 & 2032
- Figure 47: Europe Cross Linked Polyethylene Industry Revenue (Million), by Type 2024 & 2032
- Figure 48: Europe Cross Linked Polyethylene Industry Volume (K Tons), by Type 2024 & 2032
- Figure 49: Europe Cross Linked Polyethylene Industry Revenue Share (%), by Type 2024 & 2032
- Figure 50: Europe Cross Linked Polyethylene Industry Volume Share (%), by Type 2024 & 2032
- Figure 51: Europe Cross Linked Polyethylene Industry Revenue (Million), by End-user Industry 2024 & 2032
- Figure 52: Europe Cross Linked Polyethylene Industry Volume (K Tons), by End-user Industry 2024 & 2032
- Figure 53: Europe Cross Linked Polyethylene Industry Revenue Share (%), by End-user Industry 2024 & 2032
- Figure 54: Europe Cross Linked Polyethylene Industry Volume Share (%), by End-user Industry 2024 & 2032
- Figure 55: Europe Cross Linked Polyethylene Industry Revenue (Million), by Country 2024 & 2032
- Figure 56: Europe Cross Linked Polyethylene Industry Volume (K Tons), by Country 2024 & 2032
- Figure 57: Europe Cross Linked Polyethylene Industry Revenue Share (%), by Country 2024 & 2032
- Figure 58: Europe Cross Linked Polyethylene Industry Volume Share (%), by Country 2024 & 2032
- Figure 59: South America Cross Linked Polyethylene Industry Revenue (Million), by Type 2024 & 2032
- Figure 60: South America Cross Linked Polyethylene Industry Volume (K Tons), by Type 2024 & 2032
- Figure 61: South America Cross Linked Polyethylene Industry Revenue Share (%), by Type 2024 & 2032
- Figure 62: South America Cross Linked Polyethylene Industry Volume Share (%), by Type 2024 & 2032
- Figure 63: South America Cross Linked Polyethylene Industry Revenue (Million), by End-user Industry 2024 & 2032
- Figure 64: South America Cross Linked Polyethylene Industry Volume (K Tons), by End-user Industry 2024 & 2032
- Figure 65: South America Cross Linked Polyethylene Industry Revenue Share (%), by End-user Industry 2024 & 2032
- Figure 66: South America Cross Linked Polyethylene Industry Volume Share (%), by End-user Industry 2024 & 2032
- Figure 67: South America Cross Linked Polyethylene Industry Revenue (Million), by Country 2024 & 2032
- Figure 68: South America Cross Linked Polyethylene Industry Volume (K Tons), by Country 2024 & 2032
- Figure 69: South America Cross Linked Polyethylene Industry Revenue Share (%), by Country 2024 & 2032
- Figure 70: South America Cross Linked Polyethylene Industry Volume Share (%), by Country 2024 & 2032
- Figure 71: Middle East Cross Linked Polyethylene Industry Revenue (Million), by Type 2024 & 2032
- Figure 72: Middle East Cross Linked Polyethylene Industry Volume (K Tons), by Type 2024 & 2032
- Figure 73: Middle East Cross Linked Polyethylene Industry Revenue Share (%), by Type 2024 & 2032
- Figure 74: Middle East Cross Linked Polyethylene Industry Volume Share (%), by Type 2024 & 2032
- Figure 75: Middle East Cross Linked Polyethylene Industry Revenue (Million), by End-user Industry 2024 & 2032
- Figure 76: Middle East Cross Linked Polyethylene Industry Volume (K Tons), by End-user Industry 2024 & 2032
- Figure 77: Middle East Cross Linked Polyethylene Industry Revenue Share (%), by End-user Industry 2024 & 2032
- Figure 78: Middle East Cross Linked Polyethylene Industry Volume Share (%), by End-user Industry 2024 & 2032
- Figure 79: Middle East Cross Linked Polyethylene Industry Revenue (Million), by Country 2024 & 2032
- Figure 80: Middle East Cross Linked Polyethylene Industry Volume (K Tons), by Country 2024 & 2032
- Figure 81: Middle East Cross Linked Polyethylene Industry Revenue Share (%), by Country 2024 & 2032
- Figure 82: Middle East Cross Linked Polyethylene Industry Volume Share (%), by Country 2024 & 2032
- Figure 83: Saudi Arabia Cross Linked Polyethylene Industry Revenue (Million), by Type 2024 & 2032
- Figure 84: Saudi Arabia Cross Linked Polyethylene Industry Volume (K Tons), by Type 2024 & 2032
- Figure 85: Saudi Arabia Cross Linked Polyethylene Industry Revenue Share (%), by Type 2024 & 2032
- Figure 86: Saudi Arabia Cross Linked Polyethylene Industry Volume Share (%), by Type 2024 & 2032
- Figure 87: Saudi Arabia Cross Linked Polyethylene Industry Revenue (Million), by End-user Industry 2024 & 2032
- Figure 88: Saudi Arabia Cross Linked Polyethylene Industry Volume (K Tons), by End-user Industry 2024 & 2032
- Figure 89: Saudi Arabia Cross Linked Polyethylene Industry Revenue Share (%), by End-user Industry 2024 & 2032
- Figure 90: Saudi Arabia Cross Linked Polyethylene Industry Volume Share (%), by End-user Industry 2024 & 2032
- Figure 91: Saudi Arabia Cross Linked Polyethylene Industry Revenue (Million), by Country 2024 & 2032
- Figure 92: Saudi Arabia Cross Linked Polyethylene Industry Volume (K Tons), by Country 2024 & 2032
- Figure 93: Saudi Arabia Cross Linked Polyethylene Industry Revenue Share (%), by Country 2024 & 2032
- Figure 94: Saudi Arabia Cross Linked Polyethylene Industry Volume Share (%), by Country 2024 & 2032
List of Tables
- Table 1: Global Cross Linked Polyethylene Industry Revenue Million Forecast, by Region 2019 & 2032
- Table 2: Global Cross Linked Polyethylene Industry Volume K Tons Forecast, by Region 2019 & 2032
- Table 3: Global Cross Linked Polyethylene Industry Revenue Million Forecast, by Type 2019 & 2032
- Table 4: Global Cross Linked Polyethylene Industry Volume K Tons Forecast, by Type 2019 & 2032
- Table 5: Global Cross Linked Polyethylene Industry Revenue Million Forecast, by End-user Industry 2019 & 2032
- Table 6: Global Cross Linked Polyethylene Industry Volume K Tons Forecast, by End-user Industry 2019 & 2032
- Table 7: Global Cross Linked Polyethylene Industry Revenue Million Forecast, by Region 2019 & 2032
- Table 8: Global Cross Linked Polyethylene Industry Volume K Tons Forecast, by Region 2019 & 2032
- Table 9: Global Cross Linked Polyethylene Industry Revenue Million Forecast, by Country 2019 & 2032
- Table 10: Global Cross Linked Polyethylene Industry Volume K Tons Forecast, by Country 2019 & 2032
- Table 11: United States Cross Linked Polyethylene Industry Revenue (Million) Forecast, by Application 2019 & 2032
- Table 12: United States Cross Linked Polyethylene Industry Volume (K Tons) Forecast, by Application 2019 & 2032
- Table 13: Canada Cross Linked Polyethylene Industry Revenue (Million) Forecast, by Application 2019 & 2032
- Table 14: Canada Cross Linked Polyethylene Industry Volume (K Tons) Forecast, by Application 2019 & 2032
- Table 15: Mexico Cross Linked Polyethylene Industry Revenue (Million) Forecast, by Application 2019 & 2032
- Table 16: Mexico Cross Linked Polyethylene Industry Volume (K Tons) Forecast, by Application 2019 & 2032
- Table 17: Global Cross Linked Polyethylene Industry Revenue Million Forecast, by Country 2019 & 2032
- Table 18: Global Cross Linked Polyethylene Industry Volume K Tons Forecast, by Country 2019 & 2032
- Table 19: Germany Cross Linked Polyethylene Industry Revenue (Million) Forecast, by Application 2019 & 2032
- Table 20: Germany Cross Linked Polyethylene Industry Volume (K Tons) Forecast, by Application 2019 & 2032
- Table 21: France Cross Linked Polyethylene Industry Revenue (Million) Forecast, by Application 2019 & 2032
- Table 22: France Cross Linked Polyethylene Industry Volume (K Tons) Forecast, by Application 2019 & 2032
- Table 23: Italy Cross Linked Polyethylene Industry Revenue (Million) Forecast, by Application 2019 & 2032
- Table 24: Italy Cross Linked Polyethylene Industry Volume (K Tons) Forecast, by Application 2019 & 2032
- Table 25: United Kingdom Cross Linked Polyethylene Industry Revenue (Million) Forecast, by Application 2019 & 2032
- Table 26: United Kingdom Cross Linked Polyethylene Industry Volume (K Tons) Forecast, by Application 2019 & 2032
- Table 27: Netherlands Cross Linked Polyethylene Industry Revenue (Million) Forecast, by Application 2019 & 2032
- Table 28: Netherlands Cross Linked Polyethylene Industry Volume (K Tons) Forecast, by Application 2019 & 2032
- Table 29: Rest of Europe Cross Linked Polyethylene Industry Revenue (Million) Forecast, by Application 2019 & 2032
- Table 30: Rest of Europe Cross Linked Polyethylene Industry Volume (K Tons) Forecast, by Application 2019 & 2032
- Table 31: Global Cross Linked Polyethylene Industry Revenue Million Forecast, by Country 2019 & 2032
- Table 32: Global Cross Linked Polyethylene Industry Volume K Tons Forecast, by Country 2019 & 2032
- Table 33: China Cross Linked Polyethylene Industry Revenue (Million) Forecast, by Application 2019 & 2032
- Table 34: China Cross Linked Polyethylene Industry Volume (K Tons) Forecast, by Application 2019 & 2032
- Table 35: Japan Cross Linked Polyethylene Industry Revenue (Million) Forecast, by Application 2019 & 2032
- Table 36: Japan Cross Linked Polyethylene Industry Volume (K Tons) Forecast, by Application 2019 & 2032
- Table 37: India Cross Linked Polyethylene Industry Revenue (Million) Forecast, by Application 2019 & 2032
- Table 38: India Cross Linked Polyethylene Industry Volume (K Tons) Forecast, by Application 2019 & 2032
- Table 39: South Korea Cross Linked Polyethylene Industry Revenue (Million) Forecast, by Application 2019 & 2032
- Table 40: South Korea Cross Linked Polyethylene Industry Volume (K Tons) Forecast, by Application 2019 & 2032
- Table 41: Taiwan Cross Linked Polyethylene Industry Revenue (Million) Forecast, by Application 2019 & 2032
- Table 42: Taiwan Cross Linked Polyethylene Industry Volume (K Tons) Forecast, by Application 2019 & 2032
- Table 43: Australia Cross Linked Polyethylene Industry Revenue (Million) Forecast, by Application 2019 & 2032
- Table 44: Australia Cross Linked Polyethylene Industry Volume (K Tons) Forecast, by Application 2019 & 2032
- Table 45: Rest of Asia-Pacific Cross Linked Polyethylene Industry Revenue (Million) Forecast, by Application 2019 & 2032
- Table 46: Rest of Asia-Pacific Cross Linked Polyethylene Industry Volume (K Tons) Forecast, by Application 2019 & 2032
- Table 47: Global Cross Linked Polyethylene Industry Revenue Million Forecast, by Country 2019 & 2032
- Table 48: Global Cross Linked Polyethylene Industry Volume K Tons Forecast, by Country 2019 & 2032
- Table 49: Brazil Cross Linked Polyethylene Industry Revenue (Million) Forecast, by Application 2019 & 2032
- Table 50: Brazil Cross Linked Polyethylene Industry Volume (K Tons) Forecast, by Application 2019 & 2032
- Table 51: Argentina Cross Linked Polyethylene Industry Revenue (Million) Forecast, by Application 2019 & 2032
- Table 52: Argentina Cross Linked Polyethylene Industry Volume (K Tons) Forecast, by Application 2019 & 2032
- Table 53: Rest of South America Cross Linked Polyethylene Industry Revenue (Million) Forecast, by Application 2019 & 2032
- Table 54: Rest of South America Cross Linked Polyethylene Industry Volume (K Tons) Forecast, by Application 2019 & 2032
- Table 55: Global Cross Linked Polyethylene Industry Revenue Million Forecast, by Country 2019 & 2032
- Table 56: Global Cross Linked Polyethylene Industry Volume K Tons Forecast, by Country 2019 & 2032
- Table 57: Middle East Cross Linked Polyethylene Industry Revenue (Million) Forecast, by Application 2019 & 2032
- Table 58: Middle East Cross Linked Polyethylene Industry Volume (K Tons) Forecast, by Application 2019 & 2032
- Table 59: Africa Cross Linked Polyethylene Industry Revenue (Million) Forecast, by Application 2019 & 2032
- Table 60: Africa Cross Linked Polyethylene Industry Volume (K Tons) Forecast, by Application 2019 & 2032
- Table 61: Global Cross Linked Polyethylene Industry Revenue Million Forecast, by Type 2019 & 2032
- Table 62: Global Cross Linked Polyethylene Industry Volume K Tons Forecast, by Type 2019 & 2032
- Table 63: Global Cross Linked Polyethylene Industry Revenue Million Forecast, by End-user Industry 2019 & 2032
- Table 64: Global Cross Linked Polyethylene Industry Volume K Tons Forecast, by End-user Industry 2019 & 2032
- Table 65: Global Cross Linked Polyethylene Industry Revenue Million Forecast, by Country 2019 & 2032
- Table 66: Global Cross Linked Polyethylene Industry Volume K Tons Forecast, by Country 2019 & 2032
- Table 67: China Cross Linked Polyethylene Industry Revenue (Million) Forecast, by Application 2019 & 2032
- Table 68: China Cross Linked Polyethylene Industry Volume (K Tons) Forecast, by Application 2019 & 2032
- Table 69: India Cross Linked Polyethylene Industry Revenue (Million) Forecast, by Application 2019 & 2032
- Table 70: India Cross Linked Polyethylene Industry Volume (K Tons) Forecast, by Application 2019 & 2032
- Table 71: Japan Cross Linked Polyethylene Industry Revenue (Million) Forecast, by Application 2019 & 2032
- Table 72: Japan Cross Linked Polyethylene Industry Volume (K Tons) Forecast, by Application 2019 & 2032
- Table 73: South Korea Cross Linked Polyethylene Industry Revenue (Million) Forecast, by Application 2019 & 2032
- Table 74: South Korea Cross Linked Polyethylene Industry Volume (K Tons) Forecast, by Application 2019 & 2032
- Table 75: ASEAN Countries Cross Linked Polyethylene Industry Revenue (Million) Forecast, by Application 2019 & 2032
- Table 76: ASEAN Countries Cross Linked Polyethylene Industry Volume (K Tons) Forecast, by Application 2019 & 2032
- Table 77: Rest of Asia Pacific Cross Linked Polyethylene Industry Revenue (Million) Forecast, by Application 2019 & 2032
- Table 78: Rest of Asia Pacific Cross Linked Polyethylene Industry Volume (K Tons) Forecast, by Application 2019 & 2032
- Table 79: Global Cross Linked Polyethylene Industry Revenue Million Forecast, by Type 2019 & 2032
- Table 80: Global Cross Linked Polyethylene Industry Volume K Tons Forecast, by Type 2019 & 2032
- Table 81: Global Cross Linked Polyethylene Industry Revenue Million Forecast, by End-user Industry 2019 & 2032
- Table 82: Global Cross Linked Polyethylene Industry Volume K Tons Forecast, by End-user Industry 2019 & 2032
- Table 83: Global Cross Linked Polyethylene Industry Revenue Million Forecast, by Country 2019 & 2032
- Table 84: Global Cross Linked Polyethylene Industry Volume K Tons Forecast, by Country 2019 & 2032
- Table 85: United States Cross Linked Polyethylene Industry Revenue (Million) Forecast, by Application 2019 & 2032
- Table 86: United States Cross Linked Polyethylene Industry Volume (K Tons) Forecast, by Application 2019 & 2032
- Table 87: Canada Cross Linked Polyethylene Industry Revenue (Million) Forecast, by Application 2019 & 2032
- Table 88: Canada Cross Linked Polyethylene Industry Volume (K Tons) Forecast, by Application 2019 & 2032
- Table 89: Mexico Cross Linked Polyethylene Industry Revenue (Million) Forecast, by Application 2019 & 2032
- Table 90: Mexico Cross Linked Polyethylene Industry Volume (K Tons) Forecast, by Application 2019 & 2032
- Table 91: Global Cross Linked Polyethylene Industry Revenue Million Forecast, by Type 2019 & 2032
- Table 92: Global Cross Linked Polyethylene Industry Volume K Tons Forecast, by Type 2019 & 2032
- Table 93: Global Cross Linked Polyethylene Industry Revenue Million Forecast, by End-user Industry 2019 & 2032
- Table 94: Global Cross Linked Polyethylene Industry Volume K Tons Forecast, by End-user Industry 2019 & 2032
- Table 95: Global Cross Linked Polyethylene Industry Revenue Million Forecast, by Country 2019 & 2032
- Table 96: Global Cross Linked Polyethylene Industry Volume K Tons Forecast, by Country 2019 & 2032
- Table 97: Germany Cross Linked Polyethylene Industry Revenue (Million) Forecast, by Application 2019 & 2032
- Table 98: Germany Cross Linked Polyethylene Industry Volume (K Tons) Forecast, by Application 2019 & 2032
- Table 99: United Kingdom Cross Linked Polyethylene Industry Revenue (Million) Forecast, by Application 2019 & 2032
- Table 100: United Kingdom Cross Linked Polyethylene Industry Volume (K Tons) Forecast, by Application 2019 & 2032
- Table 101: Italy Cross Linked Polyethylene Industry Revenue (Million) Forecast, by Application 2019 & 2032
- Table 102: Italy Cross Linked Polyethylene Industry Volume (K Tons) Forecast, by Application 2019 & 2032
- Table 103: France Cross Linked Polyethylene Industry Revenue (Million) Forecast, by Application 2019 & 2032
- Table 104: France Cross Linked Polyethylene Industry Volume (K Tons) Forecast, by Application 2019 & 2032
- Table 105: Rest of Europe Cross Linked Polyethylene Industry Revenue (Million) Forecast, by Application 2019 & 2032
- Table 106: Rest of Europe Cross Linked Polyethylene Industry Volume (K Tons) Forecast, by Application 2019 & 2032
- Table 107: Global Cross Linked Polyethylene Industry Revenue Million Forecast, by Type 2019 & 2032
- Table 108: Global Cross Linked Polyethylene Industry Volume K Tons Forecast, by Type 2019 & 2032
- Table 109: Global Cross Linked Polyethylene Industry Revenue Million Forecast, by End-user Industry 2019 & 2032
- Table 110: Global Cross Linked Polyethylene Industry Volume K Tons Forecast, by End-user Industry 2019 & 2032
- Table 111: Global Cross Linked Polyethylene Industry Revenue Million Forecast, by Country 2019 & 2032
- Table 112: Global Cross Linked Polyethylene Industry Volume K Tons Forecast, by Country 2019 & 2032
- Table 113: Brazil Cross Linked Polyethylene Industry Revenue (Million) Forecast, by Application 2019 & 2032
- Table 114: Brazil Cross Linked Polyethylene Industry Volume (K Tons) Forecast, by Application 2019 & 2032
- Table 115: Argentina Cross Linked Polyethylene Industry Revenue (Million) Forecast, by Application 2019 & 2032
- Table 116: Argentina Cross Linked Polyethylene Industry Volume (K Tons) Forecast, by Application 2019 & 2032
- Table 117: Rest of South America Cross Linked Polyethylene Industry Revenue (Million) Forecast, by Application 2019 & 2032
- Table 118: Rest of South America Cross Linked Polyethylene Industry Volume (K Tons) Forecast, by Application 2019 & 2032
- Table 119: Global Cross Linked Polyethylene Industry Revenue Million Forecast, by Type 2019 & 2032
- Table 120: Global Cross Linked Polyethylene Industry Volume K Tons Forecast, by Type 2019 & 2032
- Table 121: Global Cross Linked Polyethylene Industry Revenue Million Forecast, by End-user Industry 2019 & 2032
- Table 122: Global Cross Linked Polyethylene Industry Volume K Tons Forecast, by End-user Industry 2019 & 2032
- Table 123: Global Cross Linked Polyethylene Industry Revenue Million Forecast, by Country 2019 & 2032
- Table 124: Global Cross Linked Polyethylene Industry Volume K Tons Forecast, by Country 2019 & 2032
- Table 125: Global Cross Linked Polyethylene Industry Revenue Million Forecast, by Type 2019 & 2032
- Table 126: Global Cross Linked Polyethylene Industry Volume K Tons Forecast, by Type 2019 & 2032
- Table 127: Global Cross Linked Polyethylene Industry Revenue Million Forecast, by End-user Industry 2019 & 2032
- Table 128: Global Cross Linked Polyethylene Industry Volume K Tons Forecast, by End-user Industry 2019 & 2032
- Table 129: Global Cross Linked Polyethylene Industry Revenue Million Forecast, by Country 2019 & 2032
- Table 130: Global Cross Linked Polyethylene Industry Volume K Tons Forecast, by Country 2019 & 2032
- Table 131: South Africa Cross Linked Polyethylene Industry Revenue (Million) Forecast, by Application 2019 & 2032
- Table 132: South Africa Cross Linked Polyethylene Industry Volume (K Tons) Forecast, by Application 2019 & 2032
- Table 133: United Arab Emirates Cross Linked Polyethylene Industry Revenue (Million) Forecast, by Application 2019 & 2032
- Table 134: United Arab Emirates Cross Linked Polyethylene Industry Volume (K Tons) Forecast, by Application 2019 & 2032
- Table 135: Rest of Middle East Cross Linked Polyethylene Industry Revenue (Million) Forecast, by Application 2019 & 2032
- Table 136: Rest of Middle East Cross Linked Polyethylene Industry Volume (K Tons) Forecast, by Application 2019 & 2032
Frequently Asked Questions
1. What is the projected Compound Annual Growth Rate (CAGR) of the Cross Linked Polyethylene Industry?
The projected CAGR is approximately 6.50%.
2. Which companies are prominent players in the Cross Linked Polyethylene Industry?
Key companies in the market include Arkema, Nouryon, Exxon Mobil Corporation, Avient Corporation, Armacell, Dow, Hanwha Chemical, Lyondelbasell Industries NV, Borealis AG, Solvay SA.
3. What are the main segments of the Cross Linked Polyethylene Industry?
The market segments include Type, End-user Industry.
4. Can you provide details about the market size?
The market size is estimated to be USD XX Million as of 2022.
5. What are some drivers contributing to market growth?
Low-cost. Flexibility. and Easy Installation Of XLPE; Surge in Demand from Pipe and Tubing Applications; Other Drivers.
6. What are the notable trends driving market growth?
Building and construction to Dominate the Market.
7. Are there any restraints impacting market growth?
Fluctuation in Raw Material Prices; Low Heat Transfer Resistance and Adhesion.
8. Can you provide examples of recent developments in the market?
January 2023: Borealis AG announced the recycling of crosslinked polyethylene such as PE-X and XLPE into recycled polyethylene using its Borcycle C chemical recycling process. It enables maintaining industry standards and high application quality, and help customer to capitalize on circular solutions.
9. What pricing options are available for accessing the report?
Pricing options include single-user, multi-user, and enterprise licenses priced at USD 4750, USD 5250, and USD 8750 respectively.
10. Is the market size provided in terms of value or volume?
The market size is provided in terms of value, measured in Million and volume, measured in K Tons.
11. Are there any specific market keywords associated with the report?
Yes, the market keyword associated with the report is "Cross Linked Polyethylene Industry," which aids in identifying and referencing the specific market segment covered.
12. How do I determine which pricing option suits my needs best?
The pricing options vary based on user requirements and access needs. Individual users may opt for single-user licenses, while businesses requiring broader access may choose multi-user or enterprise licenses for cost-effective access to the report.
13. Are there any additional resources or data provided in the Cross Linked Polyethylene Industry report?
While the report offers comprehensive insights, it's advisable to review the specific contents or supplementary materials provided to ascertain if additional resources or data are available.
14. How can I stay updated on further developments or reports in the Cross Linked Polyethylene Industry?
To stay informed about further developments, trends, and reports in the Cross Linked Polyethylene Industry, consider subscribing to industry newsletters, following relevant companies and organizations, or regularly checking reputable industry news sources and publications.
Methodology
Step 1 - Identification of Relevant Samples Size from Population Database


Step 2 - Approaches for Defining Global Market Size (Value, Volume* & Price*)

Note*: In applicable scenarios
Step 3 - Data Sources
Primary Research
- Web Analytics
- Survey Reports
- Research Institute
- Latest Research Reports
- Opinion Leaders
Secondary Research
- Annual Reports
- White Paper
- Latest Press Release
- Industry Association
- Paid Database
- Investor Presentations

Step 4 - Data Triangulation
Involves using different sources of information in order to increase the validity of a study
These sources are likely to be stakeholders in a program - participants, other researchers, program staff, other community members, and so on.
Then we put all data in single framework & apply various statistical tools to find out the dynamic on the market.
During the analysis stage, feedback from the stakeholder groups would be compared to determine areas of agreement as well as areas of divergence


