
Key Insights
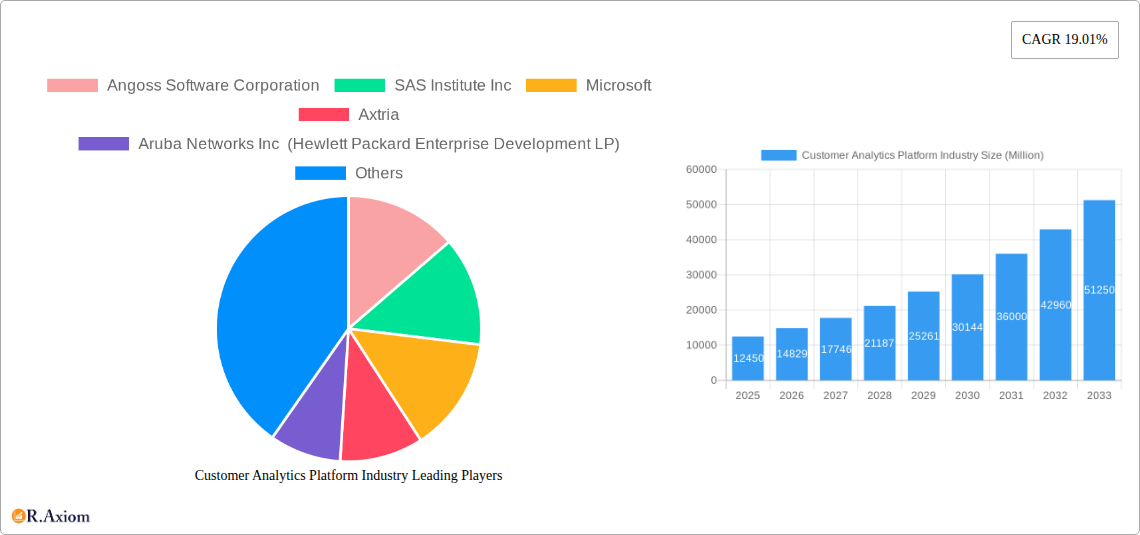
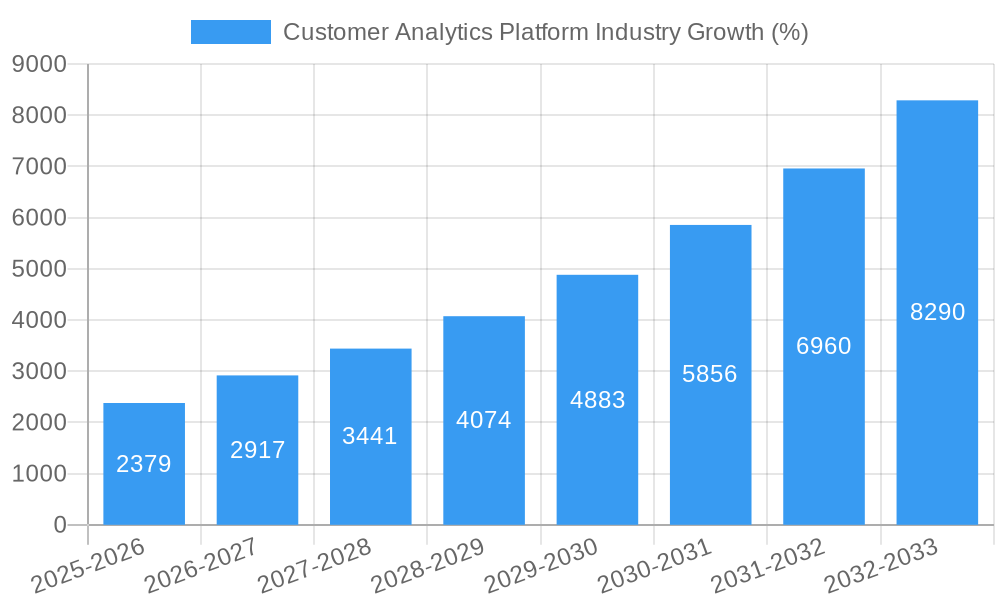
The Customer Analytics Platform (CAP) market is experiencing robust growth, projected to reach $12.45 billion in 2025 and exhibiting a Compound Annual Growth Rate (CAGR) of 19.01% from 2025 to 2033. This expansion is fueled by several key drivers. The increasing adoption of cloud-based solutions offers scalability and cost-effectiveness, attracting both small and medium enterprises (SMEs) and large enterprises. Furthermore, the burgeoning need for data-driven decision-making across diverse sectors like telecommunications, BFSI (Banking, Financial Services, and Insurance), and retail is significantly boosting market demand. Advanced analytical tools, including social media analytics, web analytics, and voice of customer (VOC) analysis, are becoming indispensable for understanding customer behavior and preferences, leading to improved customer experience and enhanced business outcomes. The rise of big data and the availability of sophisticated analytical modules further contribute to this growth trajectory.
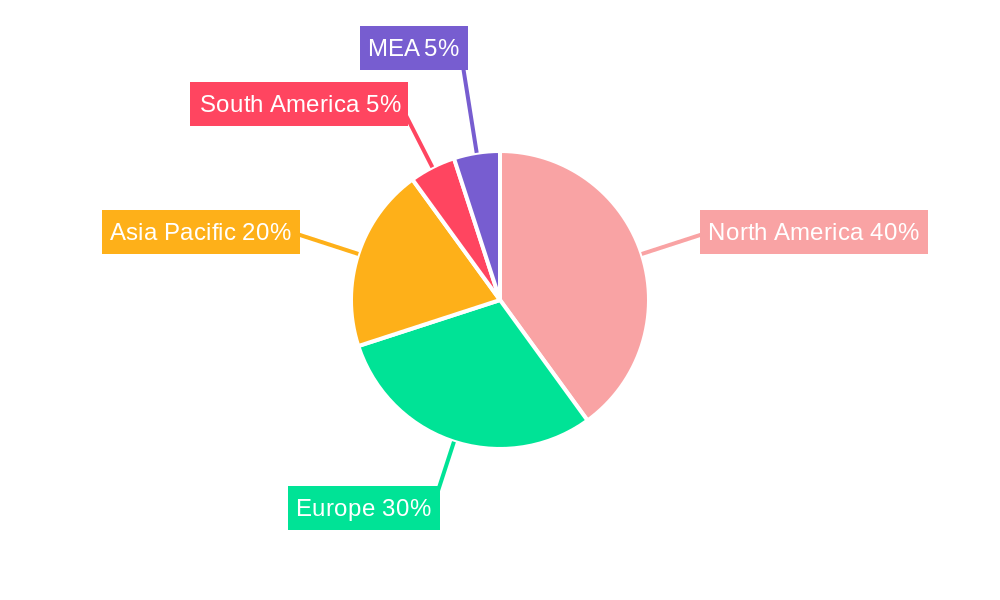
While the market presents significant opportunities, certain restraints exist. Data security concerns and the complexity of implementing and integrating CAP solutions can hinder wider adoption. The need for skilled professionals to manage and interpret the vast amounts of data generated also poses a challenge. Nevertheless, the overall market outlook remains positive, driven by ongoing technological advancements, the growing importance of data analytics, and the increasing competition among companies to gain a competitive edge through improved customer understanding. The diverse range of solutions offered, including on-premise and cloud-based deployments, caters to various organizational needs and preferences, further fueling market expansion. Geographical expansion, particularly in rapidly developing economies in Asia-Pacific and South America, is anticipated to contribute significantly to future growth.
This comprehensive report provides a detailed analysis of the Customer Analytics Platform industry, offering invaluable insights for businesses, investors, and stakeholders. With a study period spanning 2019-2033, a base year of 2025, and an estimated and forecast period of 2025-2033, this report covers historical data (2019-2024) and future projections, enabling informed strategic decision-making. The market is segmented by end-user industry, deployment type, solution, organization size, and service, providing a granular understanding of market dynamics. The total market size is predicted to reach xx Million by 2033.
Customer Analytics Platform Industry Market Concentration & Innovation
The Customer Analytics Platform market is characterized by a moderate level of concentration, with several key players holding significant market share. While a few large vendors like SAS Institute Inc, Microsoft, and Salesforce Inc dominate, a competitive landscape exists with numerous smaller players offering specialized solutions. The market share of the top 5 players is estimated to be around 40% in 2025. Innovation is a key driver, fueled by advancements in artificial intelligence (AI), machine learning (ML), big data analytics, and cloud computing. Regulatory frameworks, such as GDPR and CCPA, influence data privacy and security, creating both challenges and opportunities. Product substitutes, such as basic reporting tools, pose a threat to the market, but the increasing complexity of data and the need for advanced analytics mitigate this.
- Mergers & Acquisitions (M&A) Activity: The industry has witnessed significant M&A activity in recent years, with deal values exceeding xx Million in the past five years. These acquisitions often involve smaller companies with specialized technologies being acquired by larger players to expand their product portfolios and capabilities. Examples include Accenture's acquisition of Bridgei2i Analytics and Hewlett Packard Enterprise's acquisition of Aruba Networks Inc. This consolidation is expected to continue, driving further market concentration.
- End-User Trends: The increasing adoption of cloud-based solutions, the growing need for real-time customer insights, and the demand for personalized customer experiences are shaping end-user trends.
- Market Share: While precise market share figures for individual players are proprietary and vary according to source, the report offers detailed analysis of the competitive landscape and estimates of market share for key players.
Customer Analytics Platform Industry Industry Trends & Insights
The Customer Analytics Platform market is experiencing robust growth, driven by several factors. The increasing availability of data, coupled with the advancements in analytical tools, allows businesses to extract actionable insights for improved customer engagement and operational efficiency. The market is expected to exhibit a Compound Annual Growth Rate (CAGR) of xx% during the forecast period (2025-2033), propelled by the rising adoption of cloud-based solutions and the increasing demand for AI-powered analytics. Market penetration is steadily growing across various industries, with significant adoption in sectors like BFSI, Retail, and Telecommunications.
Technological disruptions, such as the rise of edge computing and serverless architectures, are influencing the development of new analytical tools and platforms. Consumer preferences for personalized experiences and data privacy are shaping the industry's focus on ethical data usage and robust data security measures. Competitive dynamics are intense, with companies constantly innovating to offer more advanced features, better scalability, and improved user experience. The strategic partnerships and acquisitions previously mentioned further fuel competition and innovation.
Dominant Markets & Segments in Customer Analytics Platform Industry
The Customer Analytics Platform market is broadly segmented based on End-user Industry, Deployment Type, Solution, Organization Size, and Service. The analysis reveals significant market dominance in certain segments.
By End-user Industry: The BFSI (Banking, Financial Services, and Insurance) sector exhibits the highest demand for Customer Analytics Platforms, driven by regulatory compliance needs, fraud detection, and risk management. The Retail and Telecommunications sectors also represent significant market segments.
By Deployment Type: Cloud-based deployments dominate the market, fueled by scalability, cost-effectiveness, and ease of access. However, on-premise deployments still hold a significant share, especially among large enterprises with stringent security requirements.
By Solution: Web Analytical Tools and Dashboard and Reporting Tools currently hold the largest market share due to their wide-spread applicability. However, increasing demand for AI-driven insights is driving growth in solutions like Voice of Customer (VOC) and Analytical Modules/Tools.
By Organization Size: Large enterprises dominate the market due to their higher budgets and complex data needs. However, the increasing affordability of cloud-based solutions is expanding the market to Small and Medium Enterprises (SMEs).
By Service: The Managed Service segment is expected to exhibit higher growth compared to Professional Service, driven by the need for ongoing support and maintenance.
Key drivers for dominance in these segments vary: economic policies that support digital transformation, advanced infrastructure supporting big data processing, and government regulations promoting data-driven decision making.
Customer Analytics Platform Industry Product Developments
Recent product developments in the Customer Analytics Platform market focus on integrating AI and ML capabilities to deliver advanced analytics and predictive insights. Cloud-native architectures and serverless functions are improving scalability and efficiency. Platforms are incorporating enhanced data visualization and reporting features for better user experience and actionable insights. This trend reflects the market's move towards more intelligent, automated, and user-friendly customer analytics solutions. These developments enhance market fit by providing businesses with more effective and efficient ways to analyze customer data and improve decision-making.
Report Scope & Segmentation Analysis
This report provides a comprehensive analysis of the Customer Analytics Platform market, segmented by:
End-user Industry: Telecommunications and IT, Travel and Hospitality, Retail, BFSI, Media and Entertainment, Healthcare, Transportation and Logistics, Manufacturing, Other End-user Industries. Each segment showcases unique growth trajectories and competitive dynamics. For instance, BFSI shows higher growth due to stringent regulatory demands, while Retail focuses on personalization and customer experience.
Deployment Type: On-premise and Cloud-based. Cloud-based deployments are projected to have a higher CAGR than on-premise.
Solution: Social Media Analytical Tools, Web Analytical Tools, Dashboard and Reporting Tools, Voice of Customer (VOC), ETL (Extract, Transform, and Load), Analytical Modules/Tools. Each solution category showcases varying growth rates and market sizes based on the adoption rate.
Organization Size: Small and Medium Enterprises (SMEs) and Large Enterprises. Large Enterprises currently dominate due to higher spending capacity, but SME growth is fueled by cloud-based solution accessibility.
Service: Managed Service and Professional Service. The Managed Service sector is expected to grow at a faster rate than Professional Service due to a higher demand for ongoing support and maintenance.
Key Drivers of Customer Analytics Platform Industry Growth
The Customer Analytics Platform market is experiencing strong growth driven by several key factors. Advancements in AI and ML technologies are enabling more sophisticated analytical capabilities. The increasing availability of large datasets from various sources fuels the demand for robust analytical tools. Government regulations mandating data-driven decision making in specific sectors (e.g., BFSI compliance) are driving market adoption. Furthermore, the growing preference for personalized customer experiences is pushing businesses to invest in platforms providing actionable customer insights.
Challenges in the Customer Analytics Platform Industry Sector
Despite the significant growth opportunities, the Customer Analytics Platform industry faces certain challenges. Data security and privacy concerns, especially in the face of stricter regulations like GDPR and CCPA, pose significant hurdles. The complexity of integrating data from various sources and maintaining data quality can be costly and time-consuming. Intense competition among established players and emerging startups adds pressure on margins and innovation. Finally, the skills gap in data science and analytics can hinder the implementation and effective utilization of customer analytics platforms.
Emerging Opportunities in Customer Analytics Platform Industry
The Customer Analytics Platform market presents several exciting opportunities. The increasing adoption of IoT devices and the growth of real-time data streams provide new avenues for advanced analytics. The expansion of cloud-based platforms creates opportunities for SMEs to adopt customer analytics solutions more easily. New applications of customer analytics in emerging markets and industries, like the application of sentiment analysis to public opinion, provide additional growth potential. Finally, the development of more user-friendly and intuitive interfaces will enhance market accessibility.
Leading Players in the Customer Analytics Platform Industry Market
- Angoss Software Corporation
- SAS Institute Inc
- Microsoft
- Axtria
- Aruba Networks Inc (Hewlett Packard Enterprise Development LP)
- NGDATA NV
- Teoco Corporation
- Salesforce Inc
- Bridgei2i Analytics Solution (Accenture)
- Manthan Software Services Pvt Ltd
- Pitney Bowes Inc
- Adobe
- Alteryx
- Oracle
- IBM
Key Developments in Customer Analytics Platform Industry Industry
January 2022: SAS launched SAS Customer Intelligence 360, a new AI-powered tool enhancing customer insights and decision-making. This launch significantly impacts market dynamics by introducing advanced analytical automation.
June 2022: Acquia partnered with Workato to enhance its Customer Data Platform (CDP) accessibility. This partnership broadened the reach of Acquia CDP, significantly impacting the market by offering better integration capabilities.
Strategic Outlook for Customer Analytics Platform Industry Market
The Customer Analytics Platform market exhibits substantial growth potential, fueled by technological advancements, increasing data availability, and the growing need for personalized customer experiences. The continued adoption of cloud-based solutions, coupled with the rising demand for AI-powered analytics, will drive market expansion. Strategic partnerships, acquisitions, and continuous innovation will shape the competitive landscape, offering opportunities for both established players and emerging companies. The focus on data privacy and security will also shape future developments.
Customer Analytics Platform Industry Segmentation
-
1. Deployment Type
- 1.1. On-premise
- 1.2. Cloud-based
-
2. Solution
- 2.1. Social Media Analytical Tools
- 2.2. Web Analytical Tools
- 2.3. Dashboard and Reporting Tools
- 2.4. Voice of Customer (VOC)
- 2.5. ETL (Extract, Transform, and Load)
- 2.6. Analytical Modules/Tools
-
3. Organization Size
- 3.1. Small and Medium Enterprises
- 3.2. Large Enterprises
-
4. Service
- 4.1. Managed Service
- 4.2. Professional Service
-
5. End-user Industry
- 5.1. Telecommunications and IT
- 5.2. Travel and Hospitality
- 5.3. Retail
- 5.4. BFSI
- 5.5. Media and Entertainment
- 5.6. Healthcare
- 5.7. Transportation and Logistics
- 5.8. Manufacturing
- 5.9. Other End-user Industries
Customer Analytics Platform Industry Segmentation By Geography
- 1. North America
- 2. Europe
- 3. Asia
- 4. Australia and New Zealand
- 5. Latin America
- 6. Middle East and Africa
Customer Analytics Platform Industry REPORT HIGHLIGHTS
| Aspects | Details |
|---|---|
| Study Period | 2019-2033 |
| Base Year | 2024 |
| Estimated Year | 2025 |
| Forecast Period | 2025-2033 |
| Historical Period | 2019-2024 |
| Growth Rate | CAGR of 19.01% from 2019-2033 |
| Segmentation |
|
Table of Contents
- 1. Introduction
- 1.1. Research Scope
- 1.2. Market Segmentation
- 1.3. Research Methodology
- 1.4. Definitions and Assumptions
- 2. Executive Summary
- 2.1. Introduction
- 3. Market Dynamics
- 3.1. Introduction
- 3.2. Market Drivers
- 3.2.1. Rising Demand for Improved Customer Satisfaction; Increase in Social Media Concern to Address Customer Behavior
- 3.3. Market Restrains
- 3.3.1. Data Security and Privacy Concerns
- 3.4. Market Trends
- 3.4.1. Growing Retail Sector to Drive Market Growth
- 4. Market Factor Analysis
- 4.1. Porters Five Forces
- 4.2. Supply/Value Chain
- 4.3. PESTEL analysis
- 4.4. Market Entropy
- 4.5. Patent/Trademark Analysis
- 5. Global Customer Analytics Platform Industry Analysis, Insights and Forecast, 2019-2031
- 5.1. Market Analysis, Insights and Forecast - by Deployment Type
- 5.1.1. On-premise
- 5.1.2. Cloud-based
- 5.2. Market Analysis, Insights and Forecast - by Solution
- 5.2.1. Social Media Analytical Tools
- 5.2.2. Web Analytical Tools
- 5.2.3. Dashboard and Reporting Tools
- 5.2.4. Voice of Customer (VOC)
- 5.2.5. ETL (Extract, Transform, and Load)
- 5.2.6. Analytical Modules/Tools
- 5.3. Market Analysis, Insights and Forecast - by Organization Size
- 5.3.1. Small and Medium Enterprises
- 5.3.2. Large Enterprises
- 5.4. Market Analysis, Insights and Forecast - by Service
- 5.4.1. Managed Service
- 5.4.2. Professional Service
- 5.5. Market Analysis, Insights and Forecast - by End-user Industry
- 5.5.1. Telecommunications and IT
- 5.5.2. Travel and Hospitality
- 5.5.3. Retail
- 5.5.4. BFSI
- 5.5.5. Media and Entertainment
- 5.5.6. Healthcare
- 5.5.7. Transportation and Logistics
- 5.5.8. Manufacturing
- 5.5.9. Other End-user Industries
- 5.6. Market Analysis, Insights and Forecast - by Region
- 5.6.1. North America
- 5.6.2. Europe
- 5.6.3. Asia
- 5.6.4. Australia and New Zealand
- 5.6.5. Latin America
- 5.6.6. Middle East and Africa
- 5.1. Market Analysis, Insights and Forecast - by Deployment Type
- 6. North America Customer Analytics Platform Industry Analysis, Insights and Forecast, 2019-2031
- 6.1. Market Analysis, Insights and Forecast - by Deployment Type
- 6.1.1. On-premise
- 6.1.2. Cloud-based
- 6.2. Market Analysis, Insights and Forecast - by Solution
- 6.2.1. Social Media Analytical Tools
- 6.2.2. Web Analytical Tools
- 6.2.3. Dashboard and Reporting Tools
- 6.2.4. Voice of Customer (VOC)
- 6.2.5. ETL (Extract, Transform, and Load)
- 6.2.6. Analytical Modules/Tools
- 6.3. Market Analysis, Insights and Forecast - by Organization Size
- 6.3.1. Small and Medium Enterprises
- 6.3.2. Large Enterprises
- 6.4. Market Analysis, Insights and Forecast - by Service
- 6.4.1. Managed Service
- 6.4.2. Professional Service
- 6.5. Market Analysis, Insights and Forecast - by End-user Industry
- 6.5.1. Telecommunications and IT
- 6.5.2. Travel and Hospitality
- 6.5.3. Retail
- 6.5.4. BFSI
- 6.5.5. Media and Entertainment
- 6.5.6. Healthcare
- 6.5.7. Transportation and Logistics
- 6.5.8. Manufacturing
- 6.5.9. Other End-user Industries
- 6.1. Market Analysis, Insights and Forecast - by Deployment Type
- 7. Europe Customer Analytics Platform Industry Analysis, Insights and Forecast, 2019-2031
- 7.1. Market Analysis, Insights and Forecast - by Deployment Type
- 7.1.1. On-premise
- 7.1.2. Cloud-based
- 7.2. Market Analysis, Insights and Forecast - by Solution
- 7.2.1. Social Media Analytical Tools
- 7.2.2. Web Analytical Tools
- 7.2.3. Dashboard and Reporting Tools
- 7.2.4. Voice of Customer (VOC)
- 7.2.5. ETL (Extract, Transform, and Load)
- 7.2.6. Analytical Modules/Tools
- 7.3. Market Analysis, Insights and Forecast - by Organization Size
- 7.3.1. Small and Medium Enterprises
- 7.3.2. Large Enterprises
- 7.4. Market Analysis, Insights and Forecast - by Service
- 7.4.1. Managed Service
- 7.4.2. Professional Service
- 7.5. Market Analysis, Insights and Forecast - by End-user Industry
- 7.5.1. Telecommunications and IT
- 7.5.2. Travel and Hospitality
- 7.5.3. Retail
- 7.5.4. BFSI
- 7.5.5. Media and Entertainment
- 7.5.6. Healthcare
- 7.5.7. Transportation and Logistics
- 7.5.8. Manufacturing
- 7.5.9. Other End-user Industries
- 7.1. Market Analysis, Insights and Forecast - by Deployment Type
- 8. Asia Customer Analytics Platform Industry Analysis, Insights and Forecast, 2019-2031
- 8.1. Market Analysis, Insights and Forecast - by Deployment Type
- 8.1.1. On-premise
- 8.1.2. Cloud-based
- 8.2. Market Analysis, Insights and Forecast - by Solution
- 8.2.1. Social Media Analytical Tools
- 8.2.2. Web Analytical Tools
- 8.2.3. Dashboard and Reporting Tools
- 8.2.4. Voice of Customer (VOC)
- 8.2.5. ETL (Extract, Transform, and Load)
- 8.2.6. Analytical Modules/Tools
- 8.3. Market Analysis, Insights and Forecast - by Organization Size
- 8.3.1. Small and Medium Enterprises
- 8.3.2. Large Enterprises
- 8.4. Market Analysis, Insights and Forecast - by Service
- 8.4.1. Managed Service
- 8.4.2. Professional Service
- 8.5. Market Analysis, Insights and Forecast - by End-user Industry
- 8.5.1. Telecommunications and IT
- 8.5.2. Travel and Hospitality
- 8.5.3. Retail
- 8.5.4. BFSI
- 8.5.5. Media and Entertainment
- 8.5.6. Healthcare
- 8.5.7. Transportation and Logistics
- 8.5.8. Manufacturing
- 8.5.9. Other End-user Industries
- 8.1. Market Analysis, Insights and Forecast - by Deployment Type
- 9. Australia and New Zealand Customer Analytics Platform Industry Analysis, Insights and Forecast, 2019-2031
- 9.1. Market Analysis, Insights and Forecast - by Deployment Type
- 9.1.1. On-premise
- 9.1.2. Cloud-based
- 9.2. Market Analysis, Insights and Forecast - by Solution
- 9.2.1. Social Media Analytical Tools
- 9.2.2. Web Analytical Tools
- 9.2.3. Dashboard and Reporting Tools
- 9.2.4. Voice of Customer (VOC)
- 9.2.5. ETL (Extract, Transform, and Load)
- 9.2.6. Analytical Modules/Tools
- 9.3. Market Analysis, Insights and Forecast - by Organization Size
- 9.3.1. Small and Medium Enterprises
- 9.3.2. Large Enterprises
- 9.4. Market Analysis, Insights and Forecast - by Service
- 9.4.1. Managed Service
- 9.4.2. Professional Service
- 9.5. Market Analysis, Insights and Forecast - by End-user Industry
- 9.5.1. Telecommunications and IT
- 9.5.2. Travel and Hospitality
- 9.5.3. Retail
- 9.5.4. BFSI
- 9.5.5. Media and Entertainment
- 9.5.6. Healthcare
- 9.5.7. Transportation and Logistics
- 9.5.8. Manufacturing
- 9.5.9. Other End-user Industries
- 9.1. Market Analysis, Insights and Forecast - by Deployment Type
- 10. Latin America Customer Analytics Platform Industry Analysis, Insights and Forecast, 2019-2031
- 10.1. Market Analysis, Insights and Forecast - by Deployment Type
- 10.1.1. On-premise
- 10.1.2. Cloud-based
- 10.2. Market Analysis, Insights and Forecast - by Solution
- 10.2.1. Social Media Analytical Tools
- 10.2.2. Web Analytical Tools
- 10.2.3. Dashboard and Reporting Tools
- 10.2.4. Voice of Customer (VOC)
- 10.2.5. ETL (Extract, Transform, and Load)
- 10.2.6. Analytical Modules/Tools
- 10.3. Market Analysis, Insights and Forecast - by Organization Size
- 10.3.1. Small and Medium Enterprises
- 10.3.2. Large Enterprises
- 10.4. Market Analysis, Insights and Forecast - by Service
- 10.4.1. Managed Service
- 10.4.2. Professional Service
- 10.5. Market Analysis, Insights and Forecast - by End-user Industry
- 10.5.1. Telecommunications and IT
- 10.5.2. Travel and Hospitality
- 10.5.3. Retail
- 10.5.4. BFSI
- 10.5.5. Media and Entertainment
- 10.5.6. Healthcare
- 10.5.7. Transportation and Logistics
- 10.5.8. Manufacturing
- 10.5.9. Other End-user Industries
- 10.1. Market Analysis, Insights and Forecast - by Deployment Type
- 11. Middle East and Africa Customer Analytics Platform Industry Analysis, Insights and Forecast, 2019-2031
- 11.1. Market Analysis, Insights and Forecast - by Deployment Type
- 11.1.1. On-premise
- 11.1.2. Cloud-based
- 11.2. Market Analysis, Insights and Forecast - by Solution
- 11.2.1. Social Media Analytical Tools
- 11.2.2. Web Analytical Tools
- 11.2.3. Dashboard and Reporting Tools
- 11.2.4. Voice of Customer (VOC)
- 11.2.5. ETL (Extract, Transform, and Load)
- 11.2.6. Analytical Modules/Tools
- 11.3. Market Analysis, Insights and Forecast - by Organization Size
- 11.3.1. Small and Medium Enterprises
- 11.3.2. Large Enterprises
- 11.4. Market Analysis, Insights and Forecast - by Service
- 11.4.1. Managed Service
- 11.4.2. Professional Service
- 11.5. Market Analysis, Insights and Forecast - by End-user Industry
- 11.5.1. Telecommunications and IT
- 11.5.2. Travel and Hospitality
- 11.5.3. Retail
- 11.5.4. BFSI
- 11.5.5. Media and Entertainment
- 11.5.6. Healthcare
- 11.5.7. Transportation and Logistics
- 11.5.8. Manufacturing
- 11.5.9. Other End-user Industries
- 11.1. Market Analysis, Insights and Forecast - by Deployment Type
- 12. North America Customer Analytics Platform Industry Analysis, Insights and Forecast, 2019-2031
- 12.1. Market Analysis, Insights and Forecast - By Country/Sub-region
- 12.1.1 United States
- 12.1.2 Canada
- 12.1.3 Mexico
- 13. Europe Customer Analytics Platform Industry Analysis, Insights and Forecast, 2019-2031
- 13.1. Market Analysis, Insights and Forecast - By Country/Sub-region
- 13.1.1 Germany
- 13.1.2 United Kingdom
- 13.1.3 France
- 13.1.4 Spain
- 13.1.5 Italy
- 13.1.6 Spain
- 13.1.7 Belgium
- 13.1.8 Netherland
- 13.1.9 Nordics
- 13.1.10 Rest of Europe
- 14. Asia Pacific Customer Analytics Platform Industry Analysis, Insights and Forecast, 2019-2031
- 14.1. Market Analysis, Insights and Forecast - By Country/Sub-region
- 14.1.1 China
- 14.1.2 Japan
- 14.1.3 India
- 14.1.4 South Korea
- 14.1.5 Southeast Asia
- 14.1.6 Australia
- 14.1.7 Indonesia
- 14.1.8 Phillipes
- 14.1.9 Singapore
- 14.1.10 Thailandc
- 14.1.11 Rest of Asia Pacific
- 15. South America Customer Analytics Platform Industry Analysis, Insights and Forecast, 2019-2031
- 15.1. Market Analysis, Insights and Forecast - By Country/Sub-region
- 15.1.1 Brazil
- 15.1.2 Argentina
- 15.1.3 Peru
- 15.1.4 Chile
- 15.1.5 Colombia
- 15.1.6 Ecuador
- 15.1.7 Venezuela
- 15.1.8 Rest of South America
- 16. North America Customer Analytics Platform Industry Analysis, Insights and Forecast, 2019-2031
- 16.1. Market Analysis, Insights and Forecast - By Country/Sub-region
- 16.1.1 United States
- 16.1.2 Canada
- 16.1.3 Mexico
- 17. MEA Customer Analytics Platform Industry Analysis, Insights and Forecast, 2019-2031
- 17.1. Market Analysis, Insights and Forecast - By Country/Sub-region
- 17.1.1 United Arab Emirates
- 17.1.2 Saudi Arabia
- 17.1.3 South Africa
- 17.1.4 Rest of Middle East and Africa
- 18. Competitive Analysis
- 18.1. Global Market Share Analysis 2024
- 18.2. Company Profiles
- 18.2.1 Angoss Software Corporation
- 18.2.1.1. Overview
- 18.2.1.2. Products
- 18.2.1.3. SWOT Analysis
- 18.2.1.4. Recent Developments
- 18.2.1.5. Financials (Based on Availability)
- 18.2.2 SAS Institute Inc
- 18.2.2.1. Overview
- 18.2.2.2. Products
- 18.2.2.3. SWOT Analysis
- 18.2.2.4. Recent Developments
- 18.2.2.5. Financials (Based on Availability)
- 18.2.3 Microsoft
- 18.2.3.1. Overview
- 18.2.3.2. Products
- 18.2.3.3. SWOT Analysis
- 18.2.3.4. Recent Developments
- 18.2.3.5. Financials (Based on Availability)
- 18.2.4 Axtria
- 18.2.4.1. Overview
- 18.2.4.2. Products
- 18.2.4.3. SWOT Analysis
- 18.2.4.4. Recent Developments
- 18.2.4.5. Financials (Based on Availability)
- 18.2.5 Aruba Networks Inc (Hewlett Packard Enterprise Development LP)
- 18.2.5.1. Overview
- 18.2.5.2. Products
- 18.2.5.3. SWOT Analysis
- 18.2.5.4. Recent Developments
- 18.2.5.5. Financials (Based on Availability)
- 18.2.6 NGDATA NV
- 18.2.6.1. Overview
- 18.2.6.2. Products
- 18.2.6.3. SWOT Analysis
- 18.2.6.4. Recent Developments
- 18.2.6.5. Financials (Based on Availability)
- 18.2.7 Teoco Corporation
- 18.2.7.1. Overview
- 18.2.7.2. Products
- 18.2.7.3. SWOT Analysis
- 18.2.7.4. Recent Developments
- 18.2.7.5. Financials (Based on Availability)
- 18.2.8 Salesforce Inc
- 18.2.8.1. Overview
- 18.2.8.2. Products
- 18.2.8.3. SWOT Analysis
- 18.2.8.4. Recent Developments
- 18.2.8.5. Financials (Based on Availability)
- 18.2.9 Bridgei2i Analytics Solution (Accenture)
- 18.2.9.1. Overview
- 18.2.9.2. Products
- 18.2.9.3. SWOT Analysis
- 18.2.9.4. Recent Developments
- 18.2.9.5. Financials (Based on Availability)
- 18.2.10 Manthan Software Services Pvt Ltd
- 18.2.10.1. Overview
- 18.2.10.2. Products
- 18.2.10.3. SWOT Analysis
- 18.2.10.4. Recent Developments
- 18.2.10.5. Financials (Based on Availability)
- 18.2.11 Pitney Bowes Inc
- 18.2.11.1. Overview
- 18.2.11.2. Products
- 18.2.11.3. SWOT Analysis
- 18.2.11.4. Recent Developments
- 18.2.11.5. Financials (Based on Availability)
- 18.2.12 Adobe
- 18.2.12.1. Overview
- 18.2.12.2. Products
- 18.2.12.3. SWOT Analysis
- 18.2.12.4. Recent Developments
- 18.2.12.5. Financials (Based on Availability)
- 18.2.13 Alteryx
- 18.2.13.1. Overview
- 18.2.13.2. Products
- 18.2.13.3. SWOT Analysis
- 18.2.13.4. Recent Developments
- 18.2.13.5. Financials (Based on Availability)
- 18.2.14 Oracle
- 18.2.14.1. Overview
- 18.2.14.2. Products
- 18.2.14.3. SWOT Analysis
- 18.2.14.4. Recent Developments
- 18.2.14.5. Financials (Based on Availability)
- 18.2.15 IBM
- 18.2.15.1. Overview
- 18.2.15.2. Products
- 18.2.15.3. SWOT Analysis
- 18.2.15.4. Recent Developments
- 18.2.15.5. Financials (Based on Availability)
- 18.2.1 Angoss Software Corporation
List of Figures
- Figure 1: Global Customer Analytics Platform Industry Revenue Breakdown (Million, %) by Region 2024 & 2032
- Figure 2: Global Customer Analytics Platform Industry Volume Breakdown (K Unit, %) by Region 2024 & 2032
- Figure 3: North America Customer Analytics Platform Industry Revenue (Million), by Country 2024 & 2032
- Figure 4: North America Customer Analytics Platform Industry Volume (K Unit), by Country 2024 & 2032
- Figure 5: North America Customer Analytics Platform Industry Revenue Share (%), by Country 2024 & 2032
- Figure 6: North America Customer Analytics Platform Industry Volume Share (%), by Country 2024 & 2032
- Figure 7: Europe Customer Analytics Platform Industry Revenue (Million), by Country 2024 & 2032
- Figure 8: Europe Customer Analytics Platform Industry Volume (K Unit), by Country 2024 & 2032
- Figure 9: Europe Customer Analytics Platform Industry Revenue Share (%), by Country 2024 & 2032
- Figure 10: Europe Customer Analytics Platform Industry Volume Share (%), by Country 2024 & 2032
- Figure 11: Asia Pacific Customer Analytics Platform Industry Revenue (Million), by Country 2024 & 2032
- Figure 12: Asia Pacific Customer Analytics Platform Industry Volume (K Unit), by Country 2024 & 2032
- Figure 13: Asia Pacific Customer Analytics Platform Industry Revenue Share (%), by Country 2024 & 2032
- Figure 14: Asia Pacific Customer Analytics Platform Industry Volume Share (%), by Country 2024 & 2032
- Figure 15: South America Customer Analytics Platform Industry Revenue (Million), by Country 2024 & 2032
- Figure 16: South America Customer Analytics Platform Industry Volume (K Unit), by Country 2024 & 2032
- Figure 17: South America Customer Analytics Platform Industry Revenue Share (%), by Country 2024 & 2032
- Figure 18: South America Customer Analytics Platform Industry Volume Share (%), by Country 2024 & 2032
- Figure 19: North America Customer Analytics Platform Industry Revenue (Million), by Country 2024 & 2032
- Figure 20: North America Customer Analytics Platform Industry Volume (K Unit), by Country 2024 & 2032
- Figure 21: North America Customer Analytics Platform Industry Revenue Share (%), by Country 2024 & 2032
- Figure 22: North America Customer Analytics Platform Industry Volume Share (%), by Country 2024 & 2032
- Figure 23: MEA Customer Analytics Platform Industry Revenue (Million), by Country 2024 & 2032
- Figure 24: MEA Customer Analytics Platform Industry Volume (K Unit), by Country 2024 & 2032
- Figure 25: MEA Customer Analytics Platform Industry Revenue Share (%), by Country 2024 & 2032
- Figure 26: MEA Customer Analytics Platform Industry Volume Share (%), by Country 2024 & 2032
- Figure 27: North America Customer Analytics Platform Industry Revenue (Million), by Deployment Type 2024 & 2032
- Figure 28: North America Customer Analytics Platform Industry Volume (K Unit), by Deployment Type 2024 & 2032
- Figure 29: North America Customer Analytics Platform Industry Revenue Share (%), by Deployment Type 2024 & 2032
- Figure 30: North America Customer Analytics Platform Industry Volume Share (%), by Deployment Type 2024 & 2032
- Figure 31: North America Customer Analytics Platform Industry Revenue (Million), by Solution 2024 & 2032
- Figure 32: North America Customer Analytics Platform Industry Volume (K Unit), by Solution 2024 & 2032
- Figure 33: North America Customer Analytics Platform Industry Revenue Share (%), by Solution 2024 & 2032
- Figure 34: North America Customer Analytics Platform Industry Volume Share (%), by Solution 2024 & 2032
- Figure 35: North America Customer Analytics Platform Industry Revenue (Million), by Organization Size 2024 & 2032
- Figure 36: North America Customer Analytics Platform Industry Volume (K Unit), by Organization Size 2024 & 2032
- Figure 37: North America Customer Analytics Platform Industry Revenue Share (%), by Organization Size 2024 & 2032
- Figure 38: North America Customer Analytics Platform Industry Volume Share (%), by Organization Size 2024 & 2032
- Figure 39: North America Customer Analytics Platform Industry Revenue (Million), by Service 2024 & 2032
- Figure 40: North America Customer Analytics Platform Industry Volume (K Unit), by Service 2024 & 2032
- Figure 41: North America Customer Analytics Platform Industry Revenue Share (%), by Service 2024 & 2032
- Figure 42: North America Customer Analytics Platform Industry Volume Share (%), by Service 2024 & 2032
- Figure 43: North America Customer Analytics Platform Industry Revenue (Million), by End-user Industry 2024 & 2032
- Figure 44: North America Customer Analytics Platform Industry Volume (K Unit), by End-user Industry 2024 & 2032
- Figure 45: North America Customer Analytics Platform Industry Revenue Share (%), by End-user Industry 2024 & 2032
- Figure 46: North America Customer Analytics Platform Industry Volume Share (%), by End-user Industry 2024 & 2032
- Figure 47: North America Customer Analytics Platform Industry Revenue (Million), by Country 2024 & 2032
- Figure 48: North America Customer Analytics Platform Industry Volume (K Unit), by Country 2024 & 2032
- Figure 49: North America Customer Analytics Platform Industry Revenue Share (%), by Country 2024 & 2032
- Figure 50: North America Customer Analytics Platform Industry Volume Share (%), by Country 2024 & 2032
- Figure 51: Europe Customer Analytics Platform Industry Revenue (Million), by Deployment Type 2024 & 2032
- Figure 52: Europe Customer Analytics Platform Industry Volume (K Unit), by Deployment Type 2024 & 2032
- Figure 53: Europe Customer Analytics Platform Industry Revenue Share (%), by Deployment Type 2024 & 2032
- Figure 54: Europe Customer Analytics Platform Industry Volume Share (%), by Deployment Type 2024 & 2032
- Figure 55: Europe Customer Analytics Platform Industry Revenue (Million), by Solution 2024 & 2032
- Figure 56: Europe Customer Analytics Platform Industry Volume (K Unit), by Solution 2024 & 2032
- Figure 57: Europe Customer Analytics Platform Industry Revenue Share (%), by Solution 2024 & 2032
- Figure 58: Europe Customer Analytics Platform Industry Volume Share (%), by Solution 2024 & 2032
- Figure 59: Europe Customer Analytics Platform Industry Revenue (Million), by Organization Size 2024 & 2032
- Figure 60: Europe Customer Analytics Platform Industry Volume (K Unit), by Organization Size 2024 & 2032
- Figure 61: Europe Customer Analytics Platform Industry Revenue Share (%), by Organization Size 2024 & 2032
- Figure 62: Europe Customer Analytics Platform Industry Volume Share (%), by Organization Size 2024 & 2032
- Figure 63: Europe Customer Analytics Platform Industry Revenue (Million), by Service 2024 & 2032
- Figure 64: Europe Customer Analytics Platform Industry Volume (K Unit), by Service 2024 & 2032
- Figure 65: Europe Customer Analytics Platform Industry Revenue Share (%), by Service 2024 & 2032
- Figure 66: Europe Customer Analytics Platform Industry Volume Share (%), by Service 2024 & 2032
- Figure 67: Europe Customer Analytics Platform Industry Revenue (Million), by End-user Industry 2024 & 2032
- Figure 68: Europe Customer Analytics Platform Industry Volume (K Unit), by End-user Industry 2024 & 2032
- Figure 69: Europe Customer Analytics Platform Industry Revenue Share (%), by End-user Industry 2024 & 2032
- Figure 70: Europe Customer Analytics Platform Industry Volume Share (%), by End-user Industry 2024 & 2032
- Figure 71: Europe Customer Analytics Platform Industry Revenue (Million), by Country 2024 & 2032
- Figure 72: Europe Customer Analytics Platform Industry Volume (K Unit), by Country 2024 & 2032
- Figure 73: Europe Customer Analytics Platform Industry Revenue Share (%), by Country 2024 & 2032
- Figure 74: Europe Customer Analytics Platform Industry Volume Share (%), by Country 2024 & 2032
- Figure 75: Asia Customer Analytics Platform Industry Revenue (Million), by Deployment Type 2024 & 2032
- Figure 76: Asia Customer Analytics Platform Industry Volume (K Unit), by Deployment Type 2024 & 2032
- Figure 77: Asia Customer Analytics Platform Industry Revenue Share (%), by Deployment Type 2024 & 2032
- Figure 78: Asia Customer Analytics Platform Industry Volume Share (%), by Deployment Type 2024 & 2032
- Figure 79: Asia Customer Analytics Platform Industry Revenue (Million), by Solution 2024 & 2032
- Figure 80: Asia Customer Analytics Platform Industry Volume (K Unit), by Solution 2024 & 2032
- Figure 81: Asia Customer Analytics Platform Industry Revenue Share (%), by Solution 2024 & 2032
- Figure 82: Asia Customer Analytics Platform Industry Volume Share (%), by Solution 2024 & 2032
- Figure 83: Asia Customer Analytics Platform Industry Revenue (Million), by Organization Size 2024 & 2032
- Figure 84: Asia Customer Analytics Platform Industry Volume (K Unit), by Organization Size 2024 & 2032
- Figure 85: Asia Customer Analytics Platform Industry Revenue Share (%), by Organization Size 2024 & 2032
- Figure 86: Asia Customer Analytics Platform Industry Volume Share (%), by Organization Size 2024 & 2032
- Figure 87: Asia Customer Analytics Platform Industry Revenue (Million), by Service 2024 & 2032
- Figure 88: Asia Customer Analytics Platform Industry Volume (K Unit), by Service 2024 & 2032
- Figure 89: Asia Customer Analytics Platform Industry Revenue Share (%), by Service 2024 & 2032
- Figure 90: Asia Customer Analytics Platform Industry Volume Share (%), by Service 2024 & 2032
- Figure 91: Asia Customer Analytics Platform Industry Revenue (Million), by End-user Industry 2024 & 2032
- Figure 92: Asia Customer Analytics Platform Industry Volume (K Unit), by End-user Industry 2024 & 2032
- Figure 93: Asia Customer Analytics Platform Industry Revenue Share (%), by End-user Industry 2024 & 2032
- Figure 94: Asia Customer Analytics Platform Industry Volume Share (%), by End-user Industry 2024 & 2032
- Figure 95: Asia Customer Analytics Platform Industry Revenue (Million), by Country 2024 & 2032
- Figure 96: Asia Customer Analytics Platform Industry Volume (K Unit), by Country 2024 & 2032
- Figure 97: Asia Customer Analytics Platform Industry Revenue Share (%), by Country 2024 & 2032
- Figure 98: Asia Customer Analytics Platform Industry Volume Share (%), by Country 2024 & 2032
- Figure 99: Australia and New Zealand Customer Analytics Platform Industry Revenue (Million), by Deployment Type 2024 & 2032
- Figure 100: Australia and New Zealand Customer Analytics Platform Industry Volume (K Unit), by Deployment Type 2024 & 2032
- Figure 101: Australia and New Zealand Customer Analytics Platform Industry Revenue Share (%), by Deployment Type 2024 & 2032
- Figure 102: Australia and New Zealand Customer Analytics Platform Industry Volume Share (%), by Deployment Type 2024 & 2032
- Figure 103: Australia and New Zealand Customer Analytics Platform Industry Revenue (Million), by Solution 2024 & 2032
- Figure 104: Australia and New Zealand Customer Analytics Platform Industry Volume (K Unit), by Solution 2024 & 2032
- Figure 105: Australia and New Zealand Customer Analytics Platform Industry Revenue Share (%), by Solution 2024 & 2032
- Figure 106: Australia and New Zealand Customer Analytics Platform Industry Volume Share (%), by Solution 2024 & 2032
- Figure 107: Australia and New Zealand Customer Analytics Platform Industry Revenue (Million), by Organization Size 2024 & 2032
- Figure 108: Australia and New Zealand Customer Analytics Platform Industry Volume (K Unit), by Organization Size 2024 & 2032
- Figure 109: Australia and New Zealand Customer Analytics Platform Industry Revenue Share (%), by Organization Size 2024 & 2032
- Figure 110: Australia and New Zealand Customer Analytics Platform Industry Volume Share (%), by Organization Size 2024 & 2032
- Figure 111: Australia and New Zealand Customer Analytics Platform Industry Revenue (Million), by Service 2024 & 2032
- Figure 112: Australia and New Zealand Customer Analytics Platform Industry Volume (K Unit), by Service 2024 & 2032
- Figure 113: Australia and New Zealand Customer Analytics Platform Industry Revenue Share (%), by Service 2024 & 2032
- Figure 114: Australia and New Zealand Customer Analytics Platform Industry Volume Share (%), by Service 2024 & 2032
- Figure 115: Australia and New Zealand Customer Analytics Platform Industry Revenue (Million), by End-user Industry 2024 & 2032
- Figure 116: Australia and New Zealand Customer Analytics Platform Industry Volume (K Unit), by End-user Industry 2024 & 2032
- Figure 117: Australia and New Zealand Customer Analytics Platform Industry Revenue Share (%), by End-user Industry 2024 & 2032
- Figure 118: Australia and New Zealand Customer Analytics Platform Industry Volume Share (%), by End-user Industry 2024 & 2032
- Figure 119: Australia and New Zealand Customer Analytics Platform Industry Revenue (Million), by Country 2024 & 2032
- Figure 120: Australia and New Zealand Customer Analytics Platform Industry Volume (K Unit), by Country 2024 & 2032
- Figure 121: Australia and New Zealand Customer Analytics Platform Industry Revenue Share (%), by Country 2024 & 2032
- Figure 122: Australia and New Zealand Customer Analytics Platform Industry Volume Share (%), by Country 2024 & 2032
- Figure 123: Latin America Customer Analytics Platform Industry Revenue (Million), by Deployment Type 2024 & 2032
- Figure 124: Latin America Customer Analytics Platform Industry Volume (K Unit), by Deployment Type 2024 & 2032
- Figure 125: Latin America Customer Analytics Platform Industry Revenue Share (%), by Deployment Type 2024 & 2032
- Figure 126: Latin America Customer Analytics Platform Industry Volume Share (%), by Deployment Type 2024 & 2032
- Figure 127: Latin America Customer Analytics Platform Industry Revenue (Million), by Solution 2024 & 2032
- Figure 128: Latin America Customer Analytics Platform Industry Volume (K Unit), by Solution 2024 & 2032
- Figure 129: Latin America Customer Analytics Platform Industry Revenue Share (%), by Solution 2024 & 2032
- Figure 130: Latin America Customer Analytics Platform Industry Volume Share (%), by Solution 2024 & 2032
- Figure 131: Latin America Customer Analytics Platform Industry Revenue (Million), by Organization Size 2024 & 2032
- Figure 132: Latin America Customer Analytics Platform Industry Volume (K Unit), by Organization Size 2024 & 2032
- Figure 133: Latin America Customer Analytics Platform Industry Revenue Share (%), by Organization Size 2024 & 2032
- Figure 134: Latin America Customer Analytics Platform Industry Volume Share (%), by Organization Size 2024 & 2032
- Figure 135: Latin America Customer Analytics Platform Industry Revenue (Million), by Service 2024 & 2032
- Figure 136: Latin America Customer Analytics Platform Industry Volume (K Unit), by Service 2024 & 2032
- Figure 137: Latin America Customer Analytics Platform Industry Revenue Share (%), by Service 2024 & 2032
- Figure 138: Latin America Customer Analytics Platform Industry Volume Share (%), by Service 2024 & 2032
- Figure 139: Latin America Customer Analytics Platform Industry Revenue (Million), by End-user Industry 2024 & 2032
- Figure 140: Latin America Customer Analytics Platform Industry Volume (K Unit), by End-user Industry 2024 & 2032
- Figure 141: Latin America Customer Analytics Platform Industry Revenue Share (%), by End-user Industry 2024 & 2032
- Figure 142: Latin America Customer Analytics Platform Industry Volume Share (%), by End-user Industry 2024 & 2032
- Figure 143: Latin America Customer Analytics Platform Industry Revenue (Million), by Country 2024 & 2032
- Figure 144: Latin America Customer Analytics Platform Industry Volume (K Unit), by Country 2024 & 2032
- Figure 145: Latin America Customer Analytics Platform Industry Revenue Share (%), by Country 2024 & 2032
- Figure 146: Latin America Customer Analytics Platform Industry Volume Share (%), by Country 2024 & 2032
- Figure 147: Middle East and Africa Customer Analytics Platform Industry Revenue (Million), by Deployment Type 2024 & 2032
- Figure 148: Middle East and Africa Customer Analytics Platform Industry Volume (K Unit), by Deployment Type 2024 & 2032
- Figure 149: Middle East and Africa Customer Analytics Platform Industry Revenue Share (%), by Deployment Type 2024 & 2032
- Figure 150: Middle East and Africa Customer Analytics Platform Industry Volume Share (%), by Deployment Type 2024 & 2032
- Figure 151: Middle East and Africa Customer Analytics Platform Industry Revenue (Million), by Solution 2024 & 2032
- Figure 152: Middle East and Africa Customer Analytics Platform Industry Volume (K Unit), by Solution 2024 & 2032
- Figure 153: Middle East and Africa Customer Analytics Platform Industry Revenue Share (%), by Solution 2024 & 2032
- Figure 154: Middle East and Africa Customer Analytics Platform Industry Volume Share (%), by Solution 2024 & 2032
- Figure 155: Middle East and Africa Customer Analytics Platform Industry Revenue (Million), by Organization Size 2024 & 2032
- Figure 156: Middle East and Africa Customer Analytics Platform Industry Volume (K Unit), by Organization Size 2024 & 2032
- Figure 157: Middle East and Africa Customer Analytics Platform Industry Revenue Share (%), by Organization Size 2024 & 2032
- Figure 158: Middle East and Africa Customer Analytics Platform Industry Volume Share (%), by Organization Size 2024 & 2032
- Figure 159: Middle East and Africa Customer Analytics Platform Industry Revenue (Million), by Service 2024 & 2032
- Figure 160: Middle East and Africa Customer Analytics Platform Industry Volume (K Unit), by Service 2024 & 2032
- Figure 161: Middle East and Africa Customer Analytics Platform Industry Revenue Share (%), by Service 2024 & 2032
- Figure 162: Middle East and Africa Customer Analytics Platform Industry Volume Share (%), by Service 2024 & 2032
- Figure 163: Middle East and Africa Customer Analytics Platform Industry Revenue (Million), by End-user Industry 2024 & 2032
- Figure 164: Middle East and Africa Customer Analytics Platform Industry Volume (K Unit), by End-user Industry 2024 & 2032
- Figure 165: Middle East and Africa Customer Analytics Platform Industry Revenue Share (%), by End-user Industry 2024 & 2032
- Figure 166: Middle East and Africa Customer Analytics Platform Industry Volume Share (%), by End-user Industry 2024 & 2032
- Figure 167: Middle East and Africa Customer Analytics Platform Industry Revenue (Million), by Country 2024 & 2032
- Figure 168: Middle East and Africa Customer Analytics Platform Industry Volume (K Unit), by Country 2024 & 2032
- Figure 169: Middle East and Africa Customer Analytics Platform Industry Revenue Share (%), by Country 2024 & 2032
- Figure 170: Middle East and Africa Customer Analytics Platform Industry Volume Share (%), by Country 2024 & 2032
List of Tables
- Table 1: Global Customer Analytics Platform Industry Revenue Million Forecast, by Region 2019 & 2032
- Table 2: Global Customer Analytics Platform Industry Volume K Unit Forecast, by Region 2019 & 2032
- Table 3: Global Customer Analytics Platform Industry Revenue Million Forecast, by Deployment Type 2019 & 2032
- Table 4: Global Customer Analytics Platform Industry Volume K Unit Forecast, by Deployment Type 2019 & 2032
- Table 5: Global Customer Analytics Platform Industry Revenue Million Forecast, by Solution 2019 & 2032
- Table 6: Global Customer Analytics Platform Industry Volume K Unit Forecast, by Solution 2019 & 2032
- Table 7: Global Customer Analytics Platform Industry Revenue Million Forecast, by Organization Size 2019 & 2032
- Table 8: Global Customer Analytics Platform Industry Volume K Unit Forecast, by Organization Size 2019 & 2032
- Table 9: Global Customer Analytics Platform Industry Revenue Million Forecast, by Service 2019 & 2032
- Table 10: Global Customer Analytics Platform Industry Volume K Unit Forecast, by Service 2019 & 2032
- Table 11: Global Customer Analytics Platform Industry Revenue Million Forecast, by End-user Industry 2019 & 2032
- Table 12: Global Customer Analytics Platform Industry Volume K Unit Forecast, by End-user Industry 2019 & 2032
- Table 13: Global Customer Analytics Platform Industry Revenue Million Forecast, by Region 2019 & 2032
- Table 14: Global Customer Analytics Platform Industry Volume K Unit Forecast, by Region 2019 & 2032
- Table 15: Global Customer Analytics Platform Industry Revenue Million Forecast, by Country 2019 & 2032
- Table 16: Global Customer Analytics Platform Industry Volume K Unit Forecast, by Country 2019 & 2032
- Table 17: United States Customer Analytics Platform Industry Revenue (Million) Forecast, by Application 2019 & 2032
- Table 18: United States Customer Analytics Platform Industry Volume (K Unit) Forecast, by Application 2019 & 2032
- Table 19: Canada Customer Analytics Platform Industry Revenue (Million) Forecast, by Application 2019 & 2032
- Table 20: Canada Customer Analytics Platform Industry Volume (K Unit) Forecast, by Application 2019 & 2032
- Table 21: Mexico Customer Analytics Platform Industry Revenue (Million) Forecast, by Application 2019 & 2032
- Table 22: Mexico Customer Analytics Platform Industry Volume (K Unit) Forecast, by Application 2019 & 2032
- Table 23: Global Customer Analytics Platform Industry Revenue Million Forecast, by Country 2019 & 2032
- Table 24: Global Customer Analytics Platform Industry Volume K Unit Forecast, by Country 2019 & 2032
- Table 25: Germany Customer Analytics Platform Industry Revenue (Million) Forecast, by Application 2019 & 2032
- Table 26: Germany Customer Analytics Platform Industry Volume (K Unit) Forecast, by Application 2019 & 2032
- Table 27: United Kingdom Customer Analytics Platform Industry Revenue (Million) Forecast, by Application 2019 & 2032
- Table 28: United Kingdom Customer Analytics Platform Industry Volume (K Unit) Forecast, by Application 2019 & 2032
- Table 29: France Customer Analytics Platform Industry Revenue (Million) Forecast, by Application 2019 & 2032
- Table 30: France Customer Analytics Platform Industry Volume (K Unit) Forecast, by Application 2019 & 2032
- Table 31: Spain Customer Analytics Platform Industry Revenue (Million) Forecast, by Application 2019 & 2032
- Table 32: Spain Customer Analytics Platform Industry Volume (K Unit) Forecast, by Application 2019 & 2032
- Table 33: Italy Customer Analytics Platform Industry Revenue (Million) Forecast, by Application 2019 & 2032
- Table 34: Italy Customer Analytics Platform Industry Volume (K Unit) Forecast, by Application 2019 & 2032
- Table 35: Spain Customer Analytics Platform Industry Revenue (Million) Forecast, by Application 2019 & 2032
- Table 36: Spain Customer Analytics Platform Industry Volume (K Unit) Forecast, by Application 2019 & 2032
- Table 37: Belgium Customer Analytics Platform Industry Revenue (Million) Forecast, by Application 2019 & 2032
- Table 38: Belgium Customer Analytics Platform Industry Volume (K Unit) Forecast, by Application 2019 & 2032
- Table 39: Netherland Customer Analytics Platform Industry Revenue (Million) Forecast, by Application 2019 & 2032
- Table 40: Netherland Customer Analytics Platform Industry Volume (K Unit) Forecast, by Application 2019 & 2032
- Table 41: Nordics Customer Analytics Platform Industry Revenue (Million) Forecast, by Application 2019 & 2032
- Table 42: Nordics Customer Analytics Platform Industry Volume (K Unit) Forecast, by Application 2019 & 2032
- Table 43: Rest of Europe Customer Analytics Platform Industry Revenue (Million) Forecast, by Application 2019 & 2032
- Table 44: Rest of Europe Customer Analytics Platform Industry Volume (K Unit) Forecast, by Application 2019 & 2032
- Table 45: Global Customer Analytics Platform Industry Revenue Million Forecast, by Country 2019 & 2032
- Table 46: Global Customer Analytics Platform Industry Volume K Unit Forecast, by Country 2019 & 2032
- Table 47: China Customer Analytics Platform Industry Revenue (Million) Forecast, by Application 2019 & 2032
- Table 48: China Customer Analytics Platform Industry Volume (K Unit) Forecast, by Application 2019 & 2032
- Table 49: Japan Customer Analytics Platform Industry Revenue (Million) Forecast, by Application 2019 & 2032
- Table 50: Japan Customer Analytics Platform Industry Volume (K Unit) Forecast, by Application 2019 & 2032
- Table 51: India Customer Analytics Platform Industry Revenue (Million) Forecast, by Application 2019 & 2032
- Table 52: India Customer Analytics Platform Industry Volume (K Unit) Forecast, by Application 2019 & 2032
- Table 53: South Korea Customer Analytics Platform Industry Revenue (Million) Forecast, by Application 2019 & 2032
- Table 54: South Korea Customer Analytics Platform Industry Volume (K Unit) Forecast, by Application 2019 & 2032
- Table 55: Southeast Asia Customer Analytics Platform Industry Revenue (Million) Forecast, by Application 2019 & 2032
- Table 56: Southeast Asia Customer Analytics Platform Industry Volume (K Unit) Forecast, by Application 2019 & 2032
- Table 57: Australia Customer Analytics Platform Industry Revenue (Million) Forecast, by Application 2019 & 2032
- Table 58: Australia Customer Analytics Platform Industry Volume (K Unit) Forecast, by Application 2019 & 2032
- Table 59: Indonesia Customer Analytics Platform Industry Revenue (Million) Forecast, by Application 2019 & 2032
- Table 60: Indonesia Customer Analytics Platform Industry Volume (K Unit) Forecast, by Application 2019 & 2032
- Table 61: Phillipes Customer Analytics Platform Industry Revenue (Million) Forecast, by Application 2019 & 2032
- Table 62: Phillipes Customer Analytics Platform Industry Volume (K Unit) Forecast, by Application 2019 & 2032
- Table 63: Singapore Customer Analytics Platform Industry Revenue (Million) Forecast, by Application 2019 & 2032
- Table 64: Singapore Customer Analytics Platform Industry Volume (K Unit) Forecast, by Application 2019 & 2032
- Table 65: Thailandc Customer Analytics Platform Industry Revenue (Million) Forecast, by Application 2019 & 2032
- Table 66: Thailandc Customer Analytics Platform Industry Volume (K Unit) Forecast, by Application 2019 & 2032
- Table 67: Rest of Asia Pacific Customer Analytics Platform Industry Revenue (Million) Forecast, by Application 2019 & 2032
- Table 68: Rest of Asia Pacific Customer Analytics Platform Industry Volume (K Unit) Forecast, by Application 2019 & 2032
- Table 69: Global Customer Analytics Platform Industry Revenue Million Forecast, by Country 2019 & 2032
- Table 70: Global Customer Analytics Platform Industry Volume K Unit Forecast, by Country 2019 & 2032
- Table 71: Brazil Customer Analytics Platform Industry Revenue (Million) Forecast, by Application 2019 & 2032
- Table 72: Brazil Customer Analytics Platform Industry Volume (K Unit) Forecast, by Application 2019 & 2032
- Table 73: Argentina Customer Analytics Platform Industry Revenue (Million) Forecast, by Application 2019 & 2032
- Table 74: Argentina Customer Analytics Platform Industry Volume (K Unit) Forecast, by Application 2019 & 2032
- Table 75: Peru Customer Analytics Platform Industry Revenue (Million) Forecast, by Application 2019 & 2032
- Table 76: Peru Customer Analytics Platform Industry Volume (K Unit) Forecast, by Application 2019 & 2032
- Table 77: Chile Customer Analytics Platform Industry Revenue (Million) Forecast, by Application 2019 & 2032
- Table 78: Chile Customer Analytics Platform Industry Volume (K Unit) Forecast, by Application 2019 & 2032
- Table 79: Colombia Customer Analytics Platform Industry Revenue (Million) Forecast, by Application 2019 & 2032
- Table 80: Colombia Customer Analytics Platform Industry Volume (K Unit) Forecast, by Application 2019 & 2032
- Table 81: Ecuador Customer Analytics Platform Industry Revenue (Million) Forecast, by Application 2019 & 2032
- Table 82: Ecuador Customer Analytics Platform Industry Volume (K Unit) Forecast, by Application 2019 & 2032
- Table 83: Venezuela Customer Analytics Platform Industry Revenue (Million) Forecast, by Application 2019 & 2032
- Table 84: Venezuela Customer Analytics Platform Industry Volume (K Unit) Forecast, by Application 2019 & 2032
- Table 85: Rest of South America Customer Analytics Platform Industry Revenue (Million) Forecast, by Application 2019 & 2032
- Table 86: Rest of South America Customer Analytics Platform Industry Volume (K Unit) Forecast, by Application 2019 & 2032
- Table 87: Global Customer Analytics Platform Industry Revenue Million Forecast, by Country 2019 & 2032
- Table 88: Global Customer Analytics Platform Industry Volume K Unit Forecast, by Country 2019 & 2032
- Table 89: United States Customer Analytics Platform Industry Revenue (Million) Forecast, by Application 2019 & 2032
- Table 90: United States Customer Analytics Platform Industry Volume (K Unit) Forecast, by Application 2019 & 2032
- Table 91: Canada Customer Analytics Platform Industry Revenue (Million) Forecast, by Application 2019 & 2032
- Table 92: Canada Customer Analytics Platform Industry Volume (K Unit) Forecast, by Application 2019 & 2032
- Table 93: Mexico Customer Analytics Platform Industry Revenue (Million) Forecast, by Application 2019 & 2032
- Table 94: Mexico Customer Analytics Platform Industry Volume (K Unit) Forecast, by Application 2019 & 2032
- Table 95: Global Customer Analytics Platform Industry Revenue Million Forecast, by Country 2019 & 2032
- Table 96: Global Customer Analytics Platform Industry Volume K Unit Forecast, by Country 2019 & 2032
- Table 97: United Arab Emirates Customer Analytics Platform Industry Revenue (Million) Forecast, by Application 2019 & 2032
- Table 98: United Arab Emirates Customer Analytics Platform Industry Volume (K Unit) Forecast, by Application 2019 & 2032
- Table 99: Saudi Arabia Customer Analytics Platform Industry Revenue (Million) Forecast, by Application 2019 & 2032
- Table 100: Saudi Arabia Customer Analytics Platform Industry Volume (K Unit) Forecast, by Application 2019 & 2032
- Table 101: South Africa Customer Analytics Platform Industry Revenue (Million) Forecast, by Application 2019 & 2032
- Table 102: South Africa Customer Analytics Platform Industry Volume (K Unit) Forecast, by Application 2019 & 2032
- Table 103: Rest of Middle East and Africa Customer Analytics Platform Industry Revenue (Million) Forecast, by Application 2019 & 2032
- Table 104: Rest of Middle East and Africa Customer Analytics Platform Industry Volume (K Unit) Forecast, by Application 2019 & 2032
- Table 105: Global Customer Analytics Platform Industry Revenue Million Forecast, by Deployment Type 2019 & 2032
- Table 106: Global Customer Analytics Platform Industry Volume K Unit Forecast, by Deployment Type 2019 & 2032
- Table 107: Global Customer Analytics Platform Industry Revenue Million Forecast, by Solution 2019 & 2032
- Table 108: Global Customer Analytics Platform Industry Volume K Unit Forecast, by Solution 2019 & 2032
- Table 109: Global Customer Analytics Platform Industry Revenue Million Forecast, by Organization Size 2019 & 2032
- Table 110: Global Customer Analytics Platform Industry Volume K Unit Forecast, by Organization Size 2019 & 2032
- Table 111: Global Customer Analytics Platform Industry Revenue Million Forecast, by Service 2019 & 2032
- Table 112: Global Customer Analytics Platform Industry Volume K Unit Forecast, by Service 2019 & 2032
- Table 113: Global Customer Analytics Platform Industry Revenue Million Forecast, by End-user Industry 2019 & 2032
- Table 114: Global Customer Analytics Platform Industry Volume K Unit Forecast, by End-user Industry 2019 & 2032
- Table 115: Global Customer Analytics Platform Industry Revenue Million Forecast, by Country 2019 & 2032
- Table 116: Global Customer Analytics Platform Industry Volume K Unit Forecast, by Country 2019 & 2032
- Table 117: Global Customer Analytics Platform Industry Revenue Million Forecast, by Deployment Type 2019 & 2032
- Table 118: Global Customer Analytics Platform Industry Volume K Unit Forecast, by Deployment Type 2019 & 2032
- Table 119: Global Customer Analytics Platform Industry Revenue Million Forecast, by Solution 2019 & 2032
- Table 120: Global Customer Analytics Platform Industry Volume K Unit Forecast, by Solution 2019 & 2032
- Table 121: Global Customer Analytics Platform Industry Revenue Million Forecast, by Organization Size 2019 & 2032
- Table 122: Global Customer Analytics Platform Industry Volume K Unit Forecast, by Organization Size 2019 & 2032
- Table 123: Global Customer Analytics Platform Industry Revenue Million Forecast, by Service 2019 & 2032
- Table 124: Global Customer Analytics Platform Industry Volume K Unit Forecast, by Service 2019 & 2032
- Table 125: Global Customer Analytics Platform Industry Revenue Million Forecast, by End-user Industry 2019 & 2032
- Table 126: Global Customer Analytics Platform Industry Volume K Unit Forecast, by End-user Industry 2019 & 2032
- Table 127: Global Customer Analytics Platform Industry Revenue Million Forecast, by Country 2019 & 2032
- Table 128: Global Customer Analytics Platform Industry Volume K Unit Forecast, by Country 2019 & 2032
- Table 129: Global Customer Analytics Platform Industry Revenue Million Forecast, by Deployment Type 2019 & 2032
- Table 130: Global Customer Analytics Platform Industry Volume K Unit Forecast, by Deployment Type 2019 & 2032
- Table 131: Global Customer Analytics Platform Industry Revenue Million Forecast, by Solution 2019 & 2032
- Table 132: Global Customer Analytics Platform Industry Volume K Unit Forecast, by Solution 2019 & 2032
- Table 133: Global Customer Analytics Platform Industry Revenue Million Forecast, by Organization Size 2019 & 2032
- Table 134: Global Customer Analytics Platform Industry Volume K Unit Forecast, by Organization Size 2019 & 2032
- Table 135: Global Customer Analytics Platform Industry Revenue Million Forecast, by Service 2019 & 2032
- Table 136: Global Customer Analytics Platform Industry Volume K Unit Forecast, by Service 2019 & 2032
- Table 137: Global Customer Analytics Platform Industry Revenue Million Forecast, by End-user Industry 2019 & 2032
- Table 138: Global Customer Analytics Platform Industry Volume K Unit Forecast, by End-user Industry 2019 & 2032
- Table 139: Global Customer Analytics Platform Industry Revenue Million Forecast, by Country 2019 & 2032
- Table 140: Global Customer Analytics Platform Industry Volume K Unit Forecast, by Country 2019 & 2032
- Table 141: Global Customer Analytics Platform Industry Revenue Million Forecast, by Deployment Type 2019 & 2032
- Table 142: Global Customer Analytics Platform Industry Volume K Unit Forecast, by Deployment Type 2019 & 2032
- Table 143: Global Customer Analytics Platform Industry Revenue Million Forecast, by Solution 2019 & 2032
- Table 144: Global Customer Analytics Platform Industry Volume K Unit Forecast, by Solution 2019 & 2032
- Table 145: Global Customer Analytics Platform Industry Revenue Million Forecast, by Organization Size 2019 & 2032
- Table 146: Global Customer Analytics Platform Industry Volume K Unit Forecast, by Organization Size 2019 & 2032
- Table 147: Global Customer Analytics Platform Industry Revenue Million Forecast, by Service 2019 & 2032
- Table 148: Global Customer Analytics Platform Industry Volume K Unit Forecast, by Service 2019 & 2032
- Table 149: Global Customer Analytics Platform Industry Revenue Million Forecast, by End-user Industry 2019 & 2032
- Table 150: Global Customer Analytics Platform Industry Volume K Unit Forecast, by End-user Industry 2019 & 2032
- Table 151: Global Customer Analytics Platform Industry Revenue Million Forecast, by Country 2019 & 2032
- Table 152: Global Customer Analytics Platform Industry Volume K Unit Forecast, by Country 2019 & 2032
- Table 153: Global Customer Analytics Platform Industry Revenue Million Forecast, by Deployment Type 2019 & 2032
- Table 154: Global Customer Analytics Platform Industry Volume K Unit Forecast, by Deployment Type 2019 & 2032
- Table 155: Global Customer Analytics Platform Industry Revenue Million Forecast, by Solution 2019 & 2032
- Table 156: Global Customer Analytics Platform Industry Volume K Unit Forecast, by Solution 2019 & 2032
- Table 157: Global Customer Analytics Platform Industry Revenue Million Forecast, by Organization Size 2019 & 2032
- Table 158: Global Customer Analytics Platform Industry Volume K Unit Forecast, by Organization Size 2019 & 2032
- Table 159: Global Customer Analytics Platform Industry Revenue Million Forecast, by Service 2019 & 2032
- Table 160: Global Customer Analytics Platform Industry Volume K Unit Forecast, by Service 2019 & 2032
- Table 161: Global Customer Analytics Platform Industry Revenue Million Forecast, by End-user Industry 2019 & 2032
- Table 162: Global Customer Analytics Platform Industry Volume K Unit Forecast, by End-user Industry 2019 & 2032
- Table 163: Global Customer Analytics Platform Industry Revenue Million Forecast, by Country 2019 & 2032
- Table 164: Global Customer Analytics Platform Industry Volume K Unit Forecast, by Country 2019 & 2032
- Table 165: Global Customer Analytics Platform Industry Revenue Million Forecast, by Deployment Type 2019 & 2032
- Table 166: Global Customer Analytics Platform Industry Volume K Unit Forecast, by Deployment Type 2019 & 2032
- Table 167: Global Customer Analytics Platform Industry Revenue Million Forecast, by Solution 2019 & 2032
- Table 168: Global Customer Analytics Platform Industry Volume K Unit Forecast, by Solution 2019 & 2032
- Table 169: Global Customer Analytics Platform Industry Revenue Million Forecast, by Organization Size 2019 & 2032
- Table 170: Global Customer Analytics Platform Industry Volume K Unit Forecast, by Organization Size 2019 & 2032
- Table 171: Global Customer Analytics Platform Industry Revenue Million Forecast, by Service 2019 & 2032
- Table 172: Global Customer Analytics Platform Industry Volume K Unit Forecast, by Service 2019 & 2032
- Table 173: Global Customer Analytics Platform Industry Revenue Million Forecast, by End-user Industry 2019 & 2032
- Table 174: Global Customer Analytics Platform Industry Volume K Unit Forecast, by End-user Industry 2019 & 2032
- Table 175: Global Customer Analytics Platform Industry Revenue Million Forecast, by Country 2019 & 2032
- Table 176: Global Customer Analytics Platform Industry Volume K Unit Forecast, by Country 2019 & 2032
Frequently Asked Questions
1. What is the projected Compound Annual Growth Rate (CAGR) of the Customer Analytics Platform Industry?
The projected CAGR is approximately 19.01%.
2. Which companies are prominent players in the Customer Analytics Platform Industry?
Key companies in the market include Angoss Software Corporation, SAS Institute Inc, Microsoft, Axtria, Aruba Networks Inc (Hewlett Packard Enterprise Development LP), NGDATA NV, Teoco Corporation, Salesforce Inc, Bridgei2i Analytics Solution (Accenture), Manthan Software Services Pvt Ltd, Pitney Bowes Inc, Adobe, Alteryx, Oracle, IBM.
3. What are the main segments of the Customer Analytics Platform Industry?
The market segments include Deployment Type, Solution, Organization Size, Service, End-user Industry.
4. Can you provide details about the market size?
The market size is estimated to be USD 12.45 Million as of 2022.
5. What are some drivers contributing to market growth?
Rising Demand for Improved Customer Satisfaction; Increase in Social Media Concern to Address Customer Behavior.
6. What are the notable trends driving market growth?
Growing Retail Sector to Drive Market Growth.
7. Are there any restraints impacting market growth?
Data Security and Privacy Concerns.
8. Can you provide examples of recent developments in the market?
January 2022 - SAS launched SAS Customer Intelligence 360, a new tool that automatically identifies better solutions for searching for common qualities in customer data. Using AI and machine learning, this integrated customer analytics enhances customer insights. It also offers out-of-the-box analytical automation support to help clients make better decisions, respond faster, and create income more quickly.
9. What pricing options are available for accessing the report?
Pricing options include single-user, multi-user, and enterprise licenses priced at USD 4750, USD 5250, and USD 8750 respectively.
10. Is the market size provided in terms of value or volume?
The market size is provided in terms of value, measured in Million and volume, measured in K Unit.
11. Are there any specific market keywords associated with the report?
Yes, the market keyword associated with the report is "Customer Analytics Platform Industry," which aids in identifying and referencing the specific market segment covered.
12. How do I determine which pricing option suits my needs best?
The pricing options vary based on user requirements and access needs. Individual users may opt for single-user licenses, while businesses requiring broader access may choose multi-user or enterprise licenses for cost-effective access to the report.
13. Are there any additional resources or data provided in the Customer Analytics Platform Industry report?
While the report offers comprehensive insights, it's advisable to review the specific contents or supplementary materials provided to ascertain if additional resources or data are available.
14. How can I stay updated on further developments or reports in the Customer Analytics Platform Industry?
To stay informed about further developments, trends, and reports in the Customer Analytics Platform Industry, consider subscribing to industry newsletters, following relevant companies and organizations, or regularly checking reputable industry news sources and publications.
Methodology
Step 1 - Identification of Relevant Samples Size from Population Database


Step 2 - Approaches for Defining Global Market Size (Value, Volume* & Price*)

Note*: In applicable scenarios
Step 3 - Data Sources
Primary Research
- Web Analytics
- Survey Reports
- Research Institute
- Latest Research Reports
- Opinion Leaders
Secondary Research
- Annual Reports
- White Paper
- Latest Press Release
- Industry Association
- Paid Database
- Investor Presentations

Step 4 - Data Triangulation
Involves using different sources of information in order to increase the validity of a study
These sources are likely to be stakeholders in a program - participants, other researchers, program staff, other community members, and so on.
Then we put all data in single framework & apply various statistical tools to find out the dynamic on the market.
During the analysis stage, feedback from the stakeholder groups would be compared to determine areas of agreement as well as areas of divergence


