
Key Insights
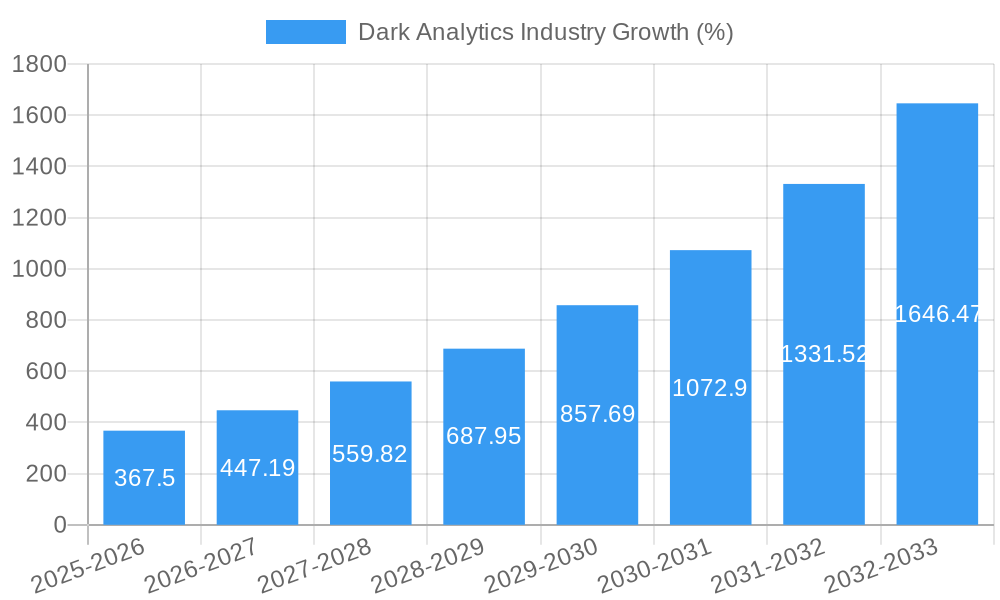
The Dark Analytics market, characterized by its use of anonymized and aggregated data for insightful analysis while preserving individual privacy, is experiencing robust growth. With a Compound Annual Growth Rate (CAGR) of 24.90% from 2019 to 2024, and a projected continuation of this high growth trajectory, the market presents significant opportunities for businesses across various sectors. The market's expansion is driven by increasing regulatory scrutiny around data privacy (like GDPR and CCPA), a rising need for compliant yet insightful data analysis, and the increasing availability of advanced analytical tools capable of handling anonymized datasets effectively. Key segments driving this growth include the BFSI (Banking, Financial Services, and Insurance), Healthcare, and Government sectors, which are actively adopting dark analytics to improve decision-making, enhance risk management, and comply with privacy regulations. The predictive and prescriptive analytics types within dark analytics are also experiencing particularly rapid adoption due to their potential for proactive risk mitigation and strategic planning.
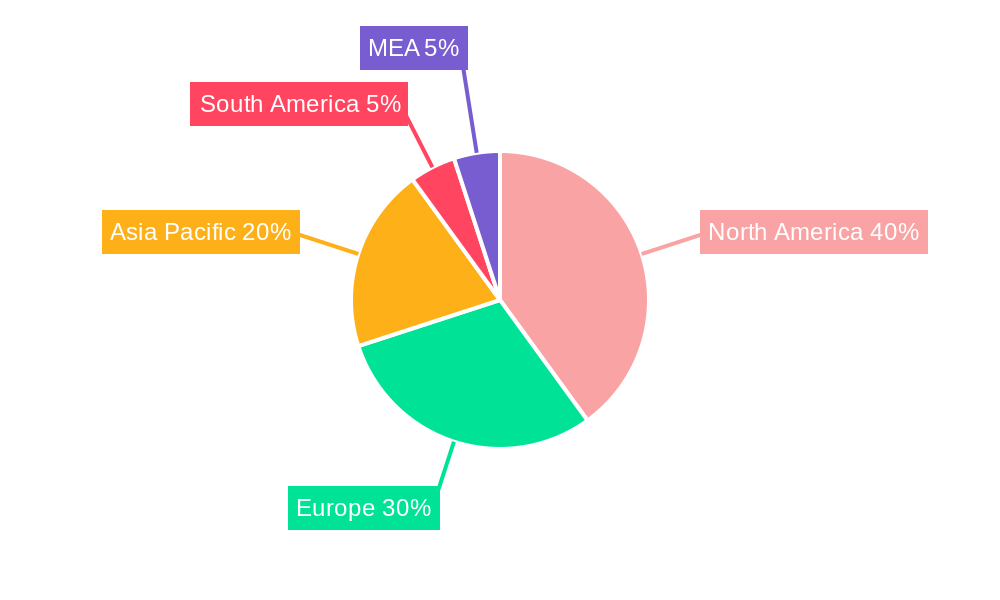
The competitive landscape is dynamic, with major players like IBM, Microsoft, and SAS Institute already establishing strong footholds. However, the market also offers opportunities for smaller, specialized firms focusing on niche applications or specific industry verticals. Geographic growth is expected to be widespread, with North America currently leading due to early adoption and well-established data infrastructure. However, rapid growth is anticipated in the Asia-Pacific region, driven by increasing digitalization and government initiatives promoting data-driven decision-making. While challenges remain—such as the need for robust data anonymization techniques and the potential for biases in aggregated data—the overall outlook for the Dark Analytics market is extremely positive, promising sustained high growth throughout the forecast period (2025-2033). This growth is further fueled by the increasing sophistication of data anonymization techniques and the development of specialized tools designed for dark analytics.
Dark Analytics Industry: A Comprehensive Market Report (2019-2033)
This detailed report provides a comprehensive analysis of the Dark Analytics industry, offering invaluable insights for stakeholders, investors, and industry professionals. With a focus on market size, growth projections, key players, and emerging trends, this report covers the period from 2019 to 2033, with a base year of 2025 and a forecast period spanning 2025-2033. The report utilizes rigorous data analysis and incorporates recent industry developments to provide actionable strategic insights. The total market size in 2025 is estimated at $XX Million, with a projected CAGR of XX% from 2025 to 2033, reaching $XX Million by 2033.
Dark Analytics Industry Market Concentration & Innovation
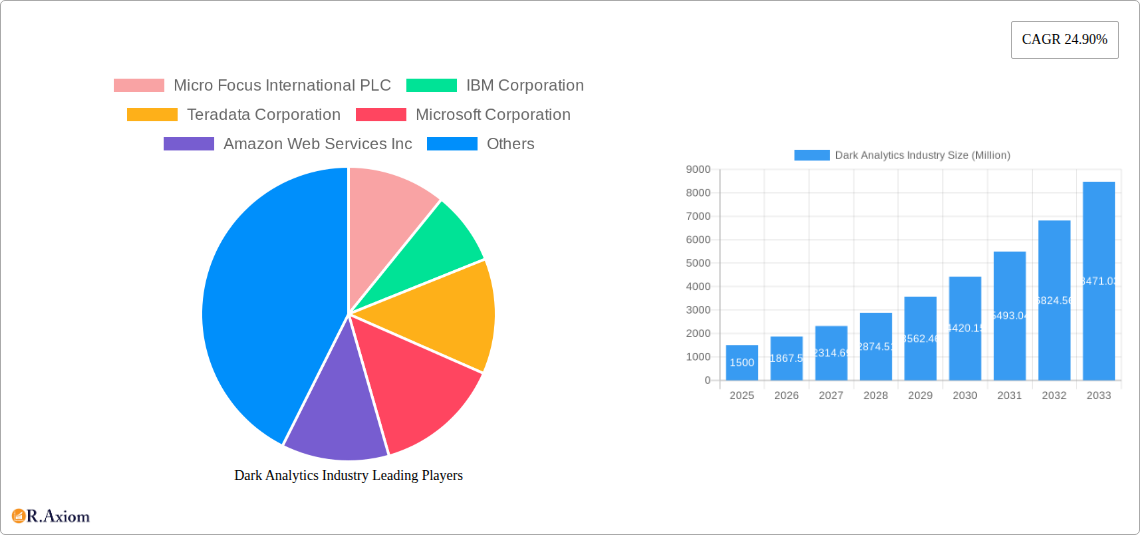
The Dark Analytics market is characterized by a moderately concentrated landscape, with several major players holding significant market share. While precise market share data for each company requires further investigation, companies like Micro Focus International PLC, IBM Corporation, Teradata Corporation, Microsoft Corporation, Amazon Web Services Inc, SAS Institute, Hewlett-Packard Enterprise Company, Oracle Corporation, and SAP SE hold substantial influence. Innovation is driven by the need for enhanced data security, advanced analytical capabilities, and the increasing adoption of cloud-based solutions.
Regulatory frameworks, while still evolving, are increasingly focusing on data privacy and security, impacting product development and market access. The emergence of alternative analytical techniques and the development of more sophisticated AI-driven solutions pose challenges and create opportunities for market disruption. The market has witnessed significant M&A activity, with deal values exceeding $XX Million in recent years. Key drivers for these transactions include expanding market share, acquiring specialized technologies, and accessing new customer segments.
- Market Concentration: Moderately concentrated, with a few dominant players.
- Innovation Drivers: Enhanced data security, advanced analytics, cloud adoption.
- Regulatory Landscape: Evolving, focused on data privacy and security.
- Product Substitutes: Emerging alternative analytical techniques and AI-driven solutions.
- End-User Trends: Increasing demand for advanced analytics across various sectors.
- M&A Activity: Significant activity with deal values exceeding $XX Million.
Dark Analytics Industry Industry Trends & Insights
The Dark Analytics market is experiencing robust growth, fueled by several key trends. The rising volume and complexity of data generated across various industries demand advanced analytical capabilities. The increasing adoption of cloud computing, big data technologies, and artificial intelligence (AI) further fuels market growth. Consumer preferences are shifting towards more personalized and targeted services, driving demand for advanced analytics to improve customer experience and enhance decision-making. Furthermore, growing concerns about data security and privacy are impacting market dynamics and are driving investment in Dark Analytics solutions.
Competitive dynamics are intense, with established players and emerging companies vying for market share. The market is expected to witness further consolidation through mergers and acquisitions. The CAGR for the Dark Analytics market during the forecast period (2025-2033) is projected at XX%, indicating significant growth potential. Market penetration is also expected to increase significantly, particularly in sectors like BFSI, Healthcare, and Government, as organizations increasingly recognize the strategic value of Dark Analytics for improved operational efficiency and competitive advantage. The high cost of implementation of Dark Analytics solutions poses challenges and hence requires substantial investment.
Dominant Markets & Segments in Dark Analytics Industry
The BFSI (Banking, Financial Services, and Insurance) sector currently represents the largest segment in the Dark Analytics market, followed by the Healthcare sector, largely due to the substantial volume of sensitive data involved. The Government sector is also a rapidly growing segment. Geographically, North America is currently dominating the market with significant adoption among large players.
By End-user Vertical:
- BFSI: High adoption due to vast data volumes and security concerns. Key drivers include stringent regulatory compliance and the need for fraud detection.
- Healthcare: High growth driven by need to improve patient care and compliance.
- Government: Strong growth from initiatives to improve public services and national security.
- Telecommunications: Moderate growth driven by the need to improve customer experience.
- Retail & E-commerce: Growth driven by personalized marketing and supply chain optimization.
- Other End-user Verticals: Includes energy, manufacturing, and logistics, with moderate growth potential.
By Type of Analytics:
- Predictive: Strong demand for forecasting and risk assessment.
- Prescriptive: Growing interest in optimization and decision support systems.
- Descriptive: High adoption for basic data analysis and reporting.
Dark Analytics Industry Product Developments
Recent product developments focus on enhancing data security, improving analytical capabilities, and integrating with cloud platforms. The industry is witnessing a shift towards AI-powered solutions, providing improved automation, prediction accuracy, and decision-making support. New products emphasize ease of use and scalability to cater to a wider range of businesses. These advancements aim to enhance market fit and provide competitive advantages.
Report Scope & Segmentation Analysis
This report segments the Dark Analytics market by end-user vertical (BFSI, Healthcare, Government, Telecommunications, Retail & E-commerce, Other End-user Verticals) and by type of analytics (Predictive, Prescriptive, Descriptive). Each segment is analyzed based on market size, growth projections, and competitive dynamics. The report provides detailed insights into the growth trajectory of each segment and offers a competitive landscape analysis, highlighting key players and their strategies.
Key Drivers of Dark Analytics Industry Growth
The growth of the Dark Analytics industry is primarily driven by the increasing volume and complexity of data, the growing adoption of cloud computing and big data technologies, and the rising need for enhanced data security and privacy. Government regulations mandating data privacy and security compliance also contribute significantly to market growth. Furthermore, increasing business demand for better decision-making capabilities through advanced analytical insights and predictive modeling creates a growing market demand for Dark Analytics solutions.
Challenges in the Dark Analytics Industry Sector
Key challenges include the high cost of implementation and maintenance of Dark Analytics solutions, the complexity of integrating different data sources, and the lack of skilled professionals. Strict data privacy regulations and concerns about data breaches also pose significant challenges. Moreover, intense competition among established and emerging players and the rapid pace of technological advancements present additional hurdles. The lack of a standardized framework for Dark Analytics deployment across industries also affects the market.
Emerging Opportunities in Dark Analytics Industry
Emerging opportunities include the growing adoption of AI and machine learning, the increasing use of blockchain technology for enhanced data security, and the expanding application of Dark Analytics in new sectors such as logistics and manufacturing. Furthermore, the rising adoption of cloud-based services and edge computing present significant growth potential. The development of innovative solutions to address the challenges related to data integration, cost efficiency, and skills gap represent significant opportunities.
Leading Players in the Dark Analytics Industry Market
- Micro Focus International PLC
- IBM Corporation
- Teradata Corporation
- Microsoft Corporation
- Amazon Web Services Inc
- SAS Institute
- Hewlett-Packard Enterprise Company
- Oracle Corporation
- SAP SE
Key Developments in Dark Analytics Industry
- November 2022: Cloudera launched the Cloudera Partner Network, incentivizing partners and promoting the adoption of its hybrid data platform and associated solutions like Marketing Automation Platform and Asset Library.
- February 2023: N-iX received Amazon Redshift and Amazon EMR Service Delivery Designation, demonstrating its expertise in big data analytics on the AWS platform. A successful project migrating a client's data solution to a cloud-based platform showcases its capabilities.
Strategic Outlook for Dark Analytics Industry Market
The Dark Analytics market is poised for continued growth, driven by technological advancements, increasing data volumes, and growing demand for enhanced data security. The focus on AI-powered solutions, cloud integration, and addressing data privacy concerns will shape the market's future. Expanding into new sectors and addressing the skills gap will unlock further market potential. Companies focusing on innovation, strategic partnerships, and efficient solutions will be best positioned for success.
Dark Analytics Industry Segmentation
-
1. Type of Analytics
- 1.1. Predictive
- 1.2. Prescriptive
- 1.3. Descriptive
-
2. End-user Vertical
- 2.1. BFSI
- 2.2. Healthcare
- 2.3. Government
- 2.4. Telecommunications
- 2.5. Retail & E-commerce
- 2.6. Other End-user Verticals
Dark Analytics Industry Segmentation By Geography
-
1. North America
- 1.1. United States
- 1.2. Canada
-
2. Europe
- 2.1. United Kingdom
- 2.2. Germany
- 2.3. Rest of Europe
-
3. Asia Pacific
- 3.1. China
- 3.2. Japan
- 3.3. Australia
- 3.4. Rest of Asia Pacific
-
4. Rest of the World
- 4.1. Latin America
- 4.2. Middl East
Dark Analytics Industry REPORT HIGHLIGHTS
| Aspects | Details |
|---|---|
| Study Period | 2019-2033 |
| Base Year | 2024 |
| Estimated Year | 2025 |
| Forecast Period | 2025-2033 |
| Historical Period | 2019-2024 |
| Growth Rate | CAGR of 24.90% from 2019-2033 |
| Segmentation |
|
Table of Contents
- 1. Introduction
- 1.1. Research Scope
- 1.2. Market Segmentation
- 1.3. Research Methodology
- 1.4. Definitions and Assumptions
- 2. Executive Summary
- 2.1. Introduction
- 3. Market Dynamics
- 3.1. Introduction
- 3.2. Market Drivers
- 3.2.1. Increasing Adoption Rates of Machine Learning and Artificial Intelligence; Rapid Growth in Generated Data Volume and Variety Owing to Adoption of IoT
- 3.3. Market Restrains
- 3.3.1. Security Concerns
- 3.4. Market Trends
- 3.4.1. Retail and E-commerce to Hold Significant Growth
- 4. Market Factor Analysis
- 4.1. Porters Five Forces
- 4.2. Supply/Value Chain
- 4.3. PESTEL analysis
- 4.4. Market Entropy
- 4.5. Patent/Trademark Analysis
- 5. Global Dark Analytics Industry Analysis, Insights and Forecast, 2019-2031
- 5.1. Market Analysis, Insights and Forecast - by Type of Analytics
- 5.1.1. Predictive
- 5.1.2. Prescriptive
- 5.1.3. Descriptive
- 5.2. Market Analysis, Insights and Forecast - by End-user Vertical
- 5.2.1. BFSI
- 5.2.2. Healthcare
- 5.2.3. Government
- 5.2.4. Telecommunications
- 5.2.5. Retail & E-commerce
- 5.2.6. Other End-user Verticals
- 5.3. Market Analysis, Insights and Forecast - by Region
- 5.3.1. North America
- 5.3.2. Europe
- 5.3.3. Asia Pacific
- 5.3.4. Rest of the World
- 5.1. Market Analysis, Insights and Forecast - by Type of Analytics
- 6. North America Dark Analytics Industry Analysis, Insights and Forecast, 2019-2031
- 6.1. Market Analysis, Insights and Forecast - by Type of Analytics
- 6.1.1. Predictive
- 6.1.2. Prescriptive
- 6.1.3. Descriptive
- 6.2. Market Analysis, Insights and Forecast - by End-user Vertical
- 6.2.1. BFSI
- 6.2.2. Healthcare
- 6.2.3. Government
- 6.2.4. Telecommunications
- 6.2.5. Retail & E-commerce
- 6.2.6. Other End-user Verticals
- 6.1. Market Analysis, Insights and Forecast - by Type of Analytics
- 7. Europe Dark Analytics Industry Analysis, Insights and Forecast, 2019-2031
- 7.1. Market Analysis, Insights and Forecast - by Type of Analytics
- 7.1.1. Predictive
- 7.1.2. Prescriptive
- 7.1.3. Descriptive
- 7.2. Market Analysis, Insights and Forecast - by End-user Vertical
- 7.2.1. BFSI
- 7.2.2. Healthcare
- 7.2.3. Government
- 7.2.4. Telecommunications
- 7.2.5. Retail & E-commerce
- 7.2.6. Other End-user Verticals
- 7.1. Market Analysis, Insights and Forecast - by Type of Analytics
- 8. Asia Pacific Dark Analytics Industry Analysis, Insights and Forecast, 2019-2031
- 8.1. Market Analysis, Insights and Forecast - by Type of Analytics
- 8.1.1. Predictive
- 8.1.2. Prescriptive
- 8.1.3. Descriptive
- 8.2. Market Analysis, Insights and Forecast - by End-user Vertical
- 8.2.1. BFSI
- 8.2.2. Healthcare
- 8.2.3. Government
- 8.2.4. Telecommunications
- 8.2.5. Retail & E-commerce
- 8.2.6. Other End-user Verticals
- 8.1. Market Analysis, Insights and Forecast - by Type of Analytics
- 9. Rest of the World Dark Analytics Industry Analysis, Insights and Forecast, 2019-2031
- 9.1. Market Analysis, Insights and Forecast - by Type of Analytics
- 9.1.1. Predictive
- 9.1.2. Prescriptive
- 9.1.3. Descriptive
- 9.2. Market Analysis, Insights and Forecast - by End-user Vertical
- 9.2.1. BFSI
- 9.2.2. Healthcare
- 9.2.3. Government
- 9.2.4. Telecommunications
- 9.2.5. Retail & E-commerce
- 9.2.6. Other End-user Verticals
- 9.1. Market Analysis, Insights and Forecast - by Type of Analytics
- 10. North America Dark Analytics Industry Analysis, Insights and Forecast, 2019-2031
- 10.1. Market Analysis, Insights and Forecast - By Country/Sub-region
- 10.1.1 United States
- 10.1.2 Canada
- 10.1.3 Mexico
- 11. Europe Dark Analytics Industry Analysis, Insights and Forecast, 2019-2031
- 11.1. Market Analysis, Insights and Forecast - By Country/Sub-region
- 11.1.1 Germany
- 11.1.2 United Kingdom
- 11.1.3 France
- 11.1.4 Spain
- 11.1.5 Italy
- 11.1.6 Spain
- 11.1.7 Belgium
- 11.1.8 Netherland
- 11.1.9 Nordics
- 11.1.10 Rest of Europe
- 12. Asia Pacific Dark Analytics Industry Analysis, Insights and Forecast, 2019-2031
- 12.1. Market Analysis, Insights and Forecast - By Country/Sub-region
- 12.1.1 China
- 12.1.2 Japan
- 12.1.3 India
- 12.1.4 South Korea
- 12.1.5 Southeast Asia
- 12.1.6 Australia
- 12.1.7 Indonesia
- 12.1.8 Phillipes
- 12.1.9 Singapore
- 12.1.10 Thailandc
- 12.1.11 Rest of Asia Pacific
- 13. South America Dark Analytics Industry Analysis, Insights and Forecast, 2019-2031
- 13.1. Market Analysis, Insights and Forecast - By Country/Sub-region
- 13.1.1 Brazil
- 13.1.2 Argentina
- 13.1.3 Peru
- 13.1.4 Chile
- 13.1.5 Colombia
- 13.1.6 Ecuador
- 13.1.7 Venezuela
- 13.1.8 Rest of South America
- 14. North America Dark Analytics Industry Analysis, Insights and Forecast, 2019-2031
- 14.1. Market Analysis, Insights and Forecast - By Country/Sub-region
- 14.1.1 United States
- 14.1.2 Canada
- 14.1.3 Mexico
- 15. MEA Dark Analytics Industry Analysis, Insights and Forecast, 2019-2031
- 15.1. Market Analysis, Insights and Forecast - By Country/Sub-region
- 15.1.1 United Arab Emirates
- 15.1.2 Saudi Arabia
- 15.1.3 South Africa
- 15.1.4 Rest of Middle East and Africa
- 16. Competitive Analysis
- 16.1. Global Market Share Analysis 2024
- 16.2. Company Profiles
- 16.2.1 Micro Focus International PLC
- 16.2.1.1. Overview
- 16.2.1.2. Products
- 16.2.1.3. SWOT Analysis
- 16.2.1.4. Recent Developments
- 16.2.1.5. Financials (Based on Availability)
- 16.2.2 IBM Corporation
- 16.2.2.1. Overview
- 16.2.2.2. Products
- 16.2.2.3. SWOT Analysis
- 16.2.2.4. Recent Developments
- 16.2.2.5. Financials (Based on Availability)
- 16.2.3 Teradata Corporation
- 16.2.3.1. Overview
- 16.2.3.2. Products
- 16.2.3.3. SWOT Analysis
- 16.2.3.4. Recent Developments
- 16.2.3.5. Financials (Based on Availability)
- 16.2.4 Microsoft Corporation
- 16.2.4.1. Overview
- 16.2.4.2. Products
- 16.2.4.3. SWOT Analysis
- 16.2.4.4. Recent Developments
- 16.2.4.5. Financials (Based on Availability)
- 16.2.5 Amazon Web Services Inc
- 16.2.5.1. Overview
- 16.2.5.2. Products
- 16.2.5.3. SWOT Analysis
- 16.2.5.4. Recent Developments
- 16.2.5.5. Financials (Based on Availability)
- 16.2.6 SAS Institute
- 16.2.6.1. Overview
- 16.2.6.2. Products
- 16.2.6.3. SWOT Analysis
- 16.2.6.4. Recent Developments
- 16.2.6.5. Financials (Based on Availability)
- 16.2.7 Hewlett-Packard Enterprise Company
- 16.2.7.1. Overview
- 16.2.7.2. Products
- 16.2.7.3. SWOT Analysis
- 16.2.7.4. Recent Developments
- 16.2.7.5. Financials (Based on Availability)
- 16.2.8 Oracle Corporation*List Not Exhaustive
- 16.2.8.1. Overview
- 16.2.8.2. Products
- 16.2.8.3. SWOT Analysis
- 16.2.8.4. Recent Developments
- 16.2.8.5. Financials (Based on Availability)
- 16.2.9 SAP SE
- 16.2.9.1. Overview
- 16.2.9.2. Products
- 16.2.9.3. SWOT Analysis
- 16.2.9.4. Recent Developments
- 16.2.9.5. Financials (Based on Availability)
- 16.2.1 Micro Focus International PLC
List of Figures
- Figure 1: Global Dark Analytics Industry Revenue Breakdown (Million, %) by Region 2024 & 2032
- Figure 2: North America Dark Analytics Industry Revenue (Million), by Country 2024 & 2032
- Figure 3: North America Dark Analytics Industry Revenue Share (%), by Country 2024 & 2032
- Figure 4: Europe Dark Analytics Industry Revenue (Million), by Country 2024 & 2032
- Figure 5: Europe Dark Analytics Industry Revenue Share (%), by Country 2024 & 2032
- Figure 6: Asia Pacific Dark Analytics Industry Revenue (Million), by Country 2024 & 2032
- Figure 7: Asia Pacific Dark Analytics Industry Revenue Share (%), by Country 2024 & 2032
- Figure 8: South America Dark Analytics Industry Revenue (Million), by Country 2024 & 2032
- Figure 9: South America Dark Analytics Industry Revenue Share (%), by Country 2024 & 2032
- Figure 10: North America Dark Analytics Industry Revenue (Million), by Country 2024 & 2032
- Figure 11: North America Dark Analytics Industry Revenue Share (%), by Country 2024 & 2032
- Figure 12: MEA Dark Analytics Industry Revenue (Million), by Country 2024 & 2032
- Figure 13: MEA Dark Analytics Industry Revenue Share (%), by Country 2024 & 2032
- Figure 14: North America Dark Analytics Industry Revenue (Million), by Type of Analytics 2024 & 2032
- Figure 15: North America Dark Analytics Industry Revenue Share (%), by Type of Analytics 2024 & 2032
- Figure 16: North America Dark Analytics Industry Revenue (Million), by End-user Vertical 2024 & 2032
- Figure 17: North America Dark Analytics Industry Revenue Share (%), by End-user Vertical 2024 & 2032
- Figure 18: North America Dark Analytics Industry Revenue (Million), by Country 2024 & 2032
- Figure 19: North America Dark Analytics Industry Revenue Share (%), by Country 2024 & 2032
- Figure 20: Europe Dark Analytics Industry Revenue (Million), by Type of Analytics 2024 & 2032
- Figure 21: Europe Dark Analytics Industry Revenue Share (%), by Type of Analytics 2024 & 2032
- Figure 22: Europe Dark Analytics Industry Revenue (Million), by End-user Vertical 2024 & 2032
- Figure 23: Europe Dark Analytics Industry Revenue Share (%), by End-user Vertical 2024 & 2032
- Figure 24: Europe Dark Analytics Industry Revenue (Million), by Country 2024 & 2032
- Figure 25: Europe Dark Analytics Industry Revenue Share (%), by Country 2024 & 2032
- Figure 26: Asia Pacific Dark Analytics Industry Revenue (Million), by Type of Analytics 2024 & 2032
- Figure 27: Asia Pacific Dark Analytics Industry Revenue Share (%), by Type of Analytics 2024 & 2032
- Figure 28: Asia Pacific Dark Analytics Industry Revenue (Million), by End-user Vertical 2024 & 2032
- Figure 29: Asia Pacific Dark Analytics Industry Revenue Share (%), by End-user Vertical 2024 & 2032
- Figure 30: Asia Pacific Dark Analytics Industry Revenue (Million), by Country 2024 & 2032
- Figure 31: Asia Pacific Dark Analytics Industry Revenue Share (%), by Country 2024 & 2032
- Figure 32: Rest of the World Dark Analytics Industry Revenue (Million), by Type of Analytics 2024 & 2032
- Figure 33: Rest of the World Dark Analytics Industry Revenue Share (%), by Type of Analytics 2024 & 2032
- Figure 34: Rest of the World Dark Analytics Industry Revenue (Million), by End-user Vertical 2024 & 2032
- Figure 35: Rest of the World Dark Analytics Industry Revenue Share (%), by End-user Vertical 2024 & 2032
- Figure 36: Rest of the World Dark Analytics Industry Revenue (Million), by Country 2024 & 2032
- Figure 37: Rest of the World Dark Analytics Industry Revenue Share (%), by Country 2024 & 2032
List of Tables
- Table 1: Global Dark Analytics Industry Revenue Million Forecast, by Region 2019 & 2032
- Table 2: Global Dark Analytics Industry Revenue Million Forecast, by Type of Analytics 2019 & 2032
- Table 3: Global Dark Analytics Industry Revenue Million Forecast, by End-user Vertical 2019 & 2032
- Table 4: Global Dark Analytics Industry Revenue Million Forecast, by Region 2019 & 2032
- Table 5: Global Dark Analytics Industry Revenue Million Forecast, by Country 2019 & 2032
- Table 6: United States Dark Analytics Industry Revenue (Million) Forecast, by Application 2019 & 2032
- Table 7: Canada Dark Analytics Industry Revenue (Million) Forecast, by Application 2019 & 2032
- Table 8: Mexico Dark Analytics Industry Revenue (Million) Forecast, by Application 2019 & 2032
- Table 9: Global Dark Analytics Industry Revenue Million Forecast, by Country 2019 & 2032
- Table 10: Germany Dark Analytics Industry Revenue (Million) Forecast, by Application 2019 & 2032
- Table 11: United Kingdom Dark Analytics Industry Revenue (Million) Forecast, by Application 2019 & 2032
- Table 12: France Dark Analytics Industry Revenue (Million) Forecast, by Application 2019 & 2032
- Table 13: Spain Dark Analytics Industry Revenue (Million) Forecast, by Application 2019 & 2032
- Table 14: Italy Dark Analytics Industry Revenue (Million) Forecast, by Application 2019 & 2032
- Table 15: Spain Dark Analytics Industry Revenue (Million) Forecast, by Application 2019 & 2032
- Table 16: Belgium Dark Analytics Industry Revenue (Million) Forecast, by Application 2019 & 2032
- Table 17: Netherland Dark Analytics Industry Revenue (Million) Forecast, by Application 2019 & 2032
- Table 18: Nordics Dark Analytics Industry Revenue (Million) Forecast, by Application 2019 & 2032
- Table 19: Rest of Europe Dark Analytics Industry Revenue (Million) Forecast, by Application 2019 & 2032
- Table 20: Global Dark Analytics Industry Revenue Million Forecast, by Country 2019 & 2032
- Table 21: China Dark Analytics Industry Revenue (Million) Forecast, by Application 2019 & 2032
- Table 22: Japan Dark Analytics Industry Revenue (Million) Forecast, by Application 2019 & 2032
- Table 23: India Dark Analytics Industry Revenue (Million) Forecast, by Application 2019 & 2032
- Table 24: South Korea Dark Analytics Industry Revenue (Million) Forecast, by Application 2019 & 2032
- Table 25: Southeast Asia Dark Analytics Industry Revenue (Million) Forecast, by Application 2019 & 2032
- Table 26: Australia Dark Analytics Industry Revenue (Million) Forecast, by Application 2019 & 2032
- Table 27: Indonesia Dark Analytics Industry Revenue (Million) Forecast, by Application 2019 & 2032
- Table 28: Phillipes Dark Analytics Industry Revenue (Million) Forecast, by Application 2019 & 2032
- Table 29: Singapore Dark Analytics Industry Revenue (Million) Forecast, by Application 2019 & 2032
- Table 30: Thailandc Dark Analytics Industry Revenue (Million) Forecast, by Application 2019 & 2032
- Table 31: Rest of Asia Pacific Dark Analytics Industry Revenue (Million) Forecast, by Application 2019 & 2032
- Table 32: Global Dark Analytics Industry Revenue Million Forecast, by Country 2019 & 2032
- Table 33: Brazil Dark Analytics Industry Revenue (Million) Forecast, by Application 2019 & 2032
- Table 34: Argentina Dark Analytics Industry Revenue (Million) Forecast, by Application 2019 & 2032
- Table 35: Peru Dark Analytics Industry Revenue (Million) Forecast, by Application 2019 & 2032
- Table 36: Chile Dark Analytics Industry Revenue (Million) Forecast, by Application 2019 & 2032
- Table 37: Colombia Dark Analytics Industry Revenue (Million) Forecast, by Application 2019 & 2032
- Table 38: Ecuador Dark Analytics Industry Revenue (Million) Forecast, by Application 2019 & 2032
- Table 39: Venezuela Dark Analytics Industry Revenue (Million) Forecast, by Application 2019 & 2032
- Table 40: Rest of South America Dark Analytics Industry Revenue (Million) Forecast, by Application 2019 & 2032
- Table 41: Global Dark Analytics Industry Revenue Million Forecast, by Country 2019 & 2032
- Table 42: United States Dark Analytics Industry Revenue (Million) Forecast, by Application 2019 & 2032
- Table 43: Canada Dark Analytics Industry Revenue (Million) Forecast, by Application 2019 & 2032
- Table 44: Mexico Dark Analytics Industry Revenue (Million) Forecast, by Application 2019 & 2032
- Table 45: Global Dark Analytics Industry Revenue Million Forecast, by Country 2019 & 2032
- Table 46: United Arab Emirates Dark Analytics Industry Revenue (Million) Forecast, by Application 2019 & 2032
- Table 47: Saudi Arabia Dark Analytics Industry Revenue (Million) Forecast, by Application 2019 & 2032
- Table 48: South Africa Dark Analytics Industry Revenue (Million) Forecast, by Application 2019 & 2032
- Table 49: Rest of Middle East and Africa Dark Analytics Industry Revenue (Million) Forecast, by Application 2019 & 2032
- Table 50: Global Dark Analytics Industry Revenue Million Forecast, by Type of Analytics 2019 & 2032
- Table 51: Global Dark Analytics Industry Revenue Million Forecast, by End-user Vertical 2019 & 2032
- Table 52: Global Dark Analytics Industry Revenue Million Forecast, by Country 2019 & 2032
- Table 53: United States Dark Analytics Industry Revenue (Million) Forecast, by Application 2019 & 2032
- Table 54: Canada Dark Analytics Industry Revenue (Million) Forecast, by Application 2019 & 2032
- Table 55: Global Dark Analytics Industry Revenue Million Forecast, by Type of Analytics 2019 & 2032
- Table 56: Global Dark Analytics Industry Revenue Million Forecast, by End-user Vertical 2019 & 2032
- Table 57: Global Dark Analytics Industry Revenue Million Forecast, by Country 2019 & 2032
- Table 58: United Kingdom Dark Analytics Industry Revenue (Million) Forecast, by Application 2019 & 2032
- Table 59: Germany Dark Analytics Industry Revenue (Million) Forecast, by Application 2019 & 2032
- Table 60: Rest of Europe Dark Analytics Industry Revenue (Million) Forecast, by Application 2019 & 2032
- Table 61: Global Dark Analytics Industry Revenue Million Forecast, by Type of Analytics 2019 & 2032
- Table 62: Global Dark Analytics Industry Revenue Million Forecast, by End-user Vertical 2019 & 2032
- Table 63: Global Dark Analytics Industry Revenue Million Forecast, by Country 2019 & 2032
- Table 64: China Dark Analytics Industry Revenue (Million) Forecast, by Application 2019 & 2032
- Table 65: Japan Dark Analytics Industry Revenue (Million) Forecast, by Application 2019 & 2032
- Table 66: Australia Dark Analytics Industry Revenue (Million) Forecast, by Application 2019 & 2032
- Table 67: Rest of Asia Pacific Dark Analytics Industry Revenue (Million) Forecast, by Application 2019 & 2032
- Table 68: Global Dark Analytics Industry Revenue Million Forecast, by Type of Analytics 2019 & 2032
- Table 69: Global Dark Analytics Industry Revenue Million Forecast, by End-user Vertical 2019 & 2032
- Table 70: Global Dark Analytics Industry Revenue Million Forecast, by Country 2019 & 2032
- Table 71: Latin America Dark Analytics Industry Revenue (Million) Forecast, by Application 2019 & 2032
- Table 72: Middl East Dark Analytics Industry Revenue (Million) Forecast, by Application 2019 & 2032
Frequently Asked Questions
1. What is the projected Compound Annual Growth Rate (CAGR) of the Dark Analytics Industry?
The projected CAGR is approximately 24.90%.
2. Which companies are prominent players in the Dark Analytics Industry?
Key companies in the market include Micro Focus International PLC, IBM Corporation, Teradata Corporation, Microsoft Corporation, Amazon Web Services Inc, SAS Institute, Hewlett-Packard Enterprise Company, Oracle Corporation*List Not Exhaustive, SAP SE.
3. What are the main segments of the Dark Analytics Industry?
The market segments include Type of Analytics, End-user Vertical.
4. Can you provide details about the market size?
The market size is estimated to be USD XX Million as of 2022.
5. What are some drivers contributing to market growth?
Increasing Adoption Rates of Machine Learning and Artificial Intelligence; Rapid Growth in Generated Data Volume and Variety Owing to Adoption of IoT.
6. What are the notable trends driving market growth?
Retail and E-commerce to Hold Significant Growth.
7. Are there any restraints impacting market growth?
Security Concerns.
8. Can you provide examples of recent developments in the market?
November 2022: The hybrid data company, Cloudera, has introduced a program called the Cloudera Partner Network that pays and honors partners for their role in the firm's go-to-market performance. Customers participating in this program will become familiar with contemporary data techniques built on the Cloudera hybrid data platform. The participants will use cutting-edge solutions, including the easy-to-use Marketing Automation Platform and Asset Library.
9. What pricing options are available for accessing the report?
Pricing options include single-user, multi-user, and enterprise licenses priced at USD 4750, USD 5250, and USD 8750 respectively.
10. Is the market size provided in terms of value or volume?
The market size is provided in terms of value, measured in Million.
11. Are there any specific market keywords associated with the report?
Yes, the market keyword associated with the report is "Dark Analytics Industry," which aids in identifying and referencing the specific market segment covered.
12. How do I determine which pricing option suits my needs best?
The pricing options vary based on user requirements and access needs. Individual users may opt for single-user licenses, while businesses requiring broader access may choose multi-user or enterprise licenses for cost-effective access to the report.
13. Are there any additional resources or data provided in the Dark Analytics Industry report?
While the report offers comprehensive insights, it's advisable to review the specific contents or supplementary materials provided to ascertain if additional resources or data are available.
14. How can I stay updated on further developments or reports in the Dark Analytics Industry?
To stay informed about further developments, trends, and reports in the Dark Analytics Industry, consider subscribing to industry newsletters, following relevant companies and organizations, or regularly checking reputable industry news sources and publications.
Methodology
Step 1 - Identification of Relevant Samples Size from Population Database


Step 2 - Approaches for Defining Global Market Size (Value, Volume* & Price*)

Note*: In applicable scenarios
Step 3 - Data Sources
Primary Research
- Web Analytics
- Survey Reports
- Research Institute
- Latest Research Reports
- Opinion Leaders
Secondary Research
- Annual Reports
- White Paper
- Latest Press Release
- Industry Association
- Paid Database
- Investor Presentations

Step 4 - Data Triangulation
Involves using different sources of information in order to increase the validity of a study
These sources are likely to be stakeholders in a program - participants, other researchers, program staff, other community members, and so on.
Then we put all data in single framework & apply various statistical tools to find out the dynamic on the market.
During the analysis stage, feedback from the stakeholder groups would be compared to determine areas of agreement as well as areas of divergence


