
Key Insights
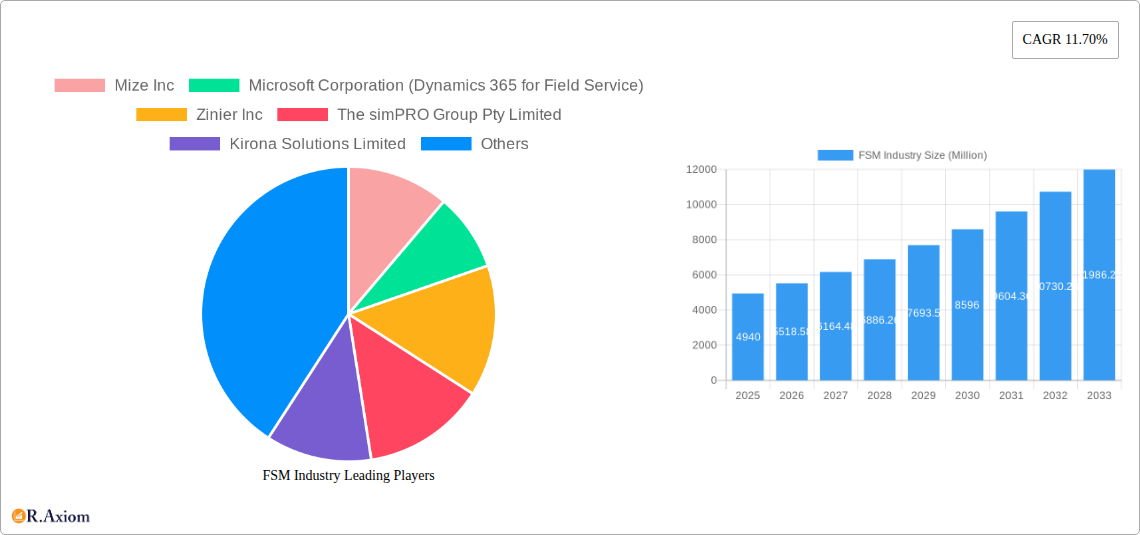
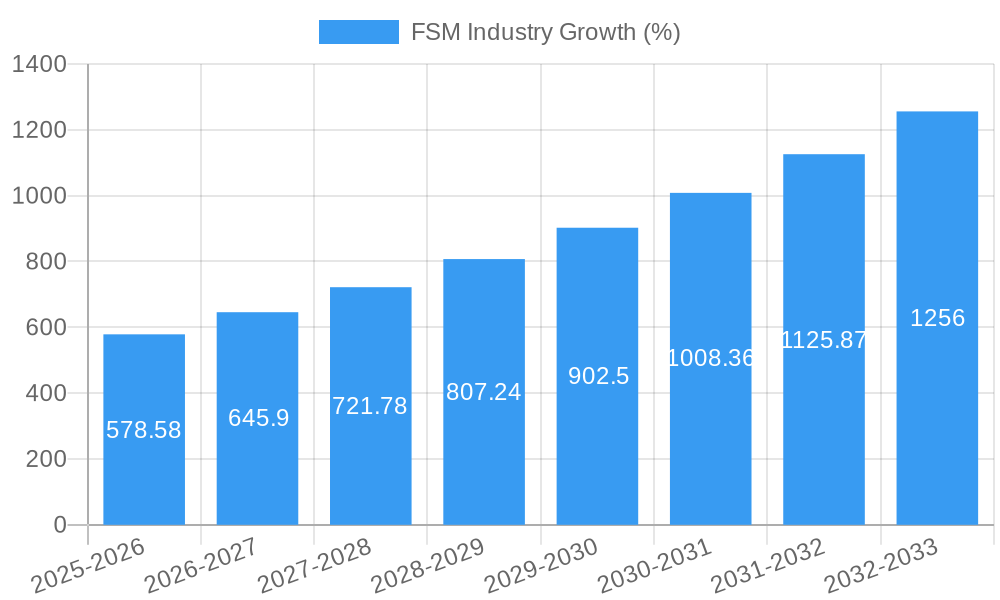
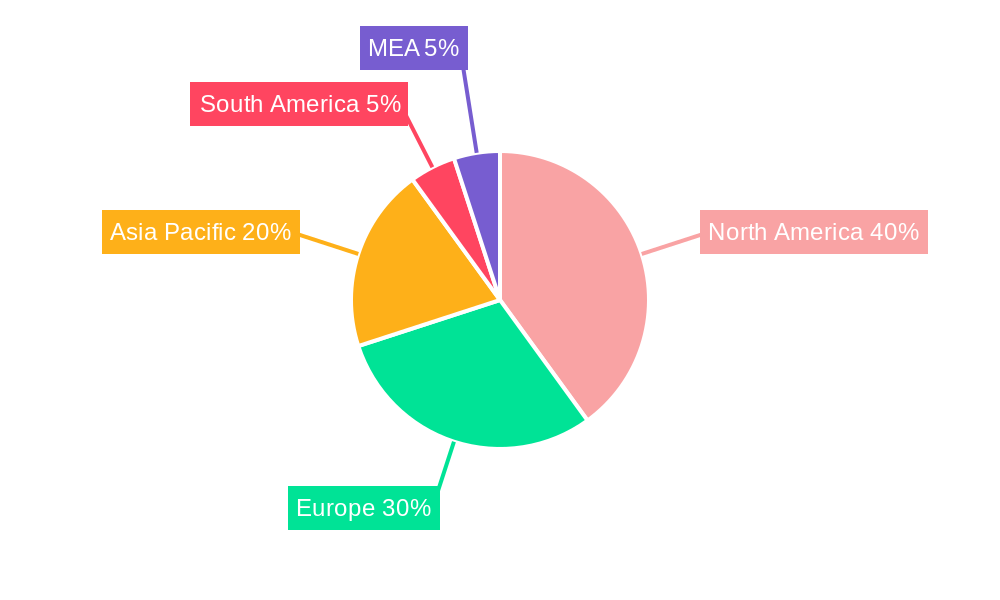
The Field Service Management (FSM) software market is experiencing robust growth, projected to reach $4.94 billion in 2025 and maintain a Compound Annual Growth Rate (CAGR) of 11.70% from 2025 to 2033. This expansion is fueled by several key drivers. The increasing demand for improved operational efficiency and customer satisfaction across various industries, particularly in sectors like Allied FM (both hard and soft services), IT and Telecom, and Healthcare, is a major catalyst. Businesses are adopting FSM solutions to optimize scheduling, dispatching, and routing, leading to reduced operational costs and faster response times. Furthermore, the integration of advanced technologies like IoT and AI within FSM platforms enhances predictive maintenance, improves resource allocation, and enables proactive customer service. The growing adoption of cloud-based deployments, offering scalability and accessibility, further accelerates market growth. While initial investment costs and the complexity of integrating FSM systems with existing infrastructure may present some restraints, the long-term benefits in terms of increased productivity and revenue generation significantly outweigh these challenges. The market is segmented by deployment type (on-premises and cloud), organization size (SMEs and large enterprises), software and service type (scheduling, dispatch, etc.), and end-user industry. The North American market currently holds a significant share, but rapid growth is expected in Asia-Pacific and other emerging economies driven by increasing digital adoption and infrastructure development.
The competitive landscape is characterized by a mix of established players like Microsoft, Salesforce, and Oracle, alongside specialized FSM solution providers like Mize, Zinier, and ServiceMax. These companies are constantly innovating to offer more comprehensive and integrated solutions, incorporating features such as AI-powered predictive analytics, real-time tracking, and mobile-first interfaces. The continued focus on enhancing user experience, improving data analytics capabilities, and expanding functionalities to meet evolving industry-specific needs will be crucial for success in this dynamic market. Strategic partnerships and mergers and acquisitions will likely play an important role in shaping the competitive dynamics in the coming years. Given the strong growth trajectory and the increasing importance of efficient field service operations, the FSM market is poised for sustained expansion, providing significant opportunities for both established and emerging players.
FSM Industry Market Report: 2019-2033
This comprehensive report provides a detailed analysis of the Field Service Management (FSM) industry, covering market size, growth drivers, competitive landscape, and future outlook. The study period spans from 2019 to 2033, with 2025 serving as the base and estimated year. The report encompasses a thorough segmentation analysis, incorporating deployment type, organization size, software and service type, and end-user verticals, providing actionable insights for industry stakeholders. The market is valued at xx Million in 2025 and is projected to reach xx Million by 2033, exhibiting a CAGR of xx%.
FSM Industry Market Concentration & Innovation
The FSM industry is characterized by a moderately concentrated market, with several major players holding significant market share. Companies like Microsoft (Dynamics 365 for Field Service), Salesforce (Field Service Cloud), and ServiceMax Inc. command a substantial portion of the market, while a host of smaller, specialized vendors cater to niche segments. The market share of these top players is estimated at approximately xx%, leaving xx% to be distributed among other competitors.
Innovation is a key driver in the FSM sector, fueled by advancements in technologies like AI, IoT, and cloud computing. These innovations enable features like predictive maintenance, optimized routing, and real-time data analysis, ultimately improving service efficiency and customer satisfaction. Regulatory frameworks, particularly those concerning data privacy and security, influence industry practices. Product substitutes, including legacy on-premise systems, are gradually being replaced by cloud-based solutions due to their scalability and cost-effectiveness.
End-user trends indicate a growing preference for integrated, end-to-end FSM solutions that streamline operations across various departments. The rise of the gig economy and the need for efficient workforce management further drives demand for robust FSM software. Mergers and acquisitions (M&A) are prominent, with recent examples like Visma's acquisition of OutSmart in October 2022, highlighting the consolidation trend within the industry. These deals are typically valued in the range of xx Million to xx Million, contributing to market expansion and increased competition.
FSM Industry Industry Trends & Insights
The FSM market is experiencing robust growth, primarily driven by the increasing adoption of cloud-based solutions and the growing need for enhanced service efficiency across diverse industries. The market's expansion is fueled by factors such as the rising adoption of mobile technologies, improved connectivity, and the increasing demand for real-time data analytics. The shift towards proactive and predictive maintenance strategies further enhances the market’s growth trajectory. Furthermore, the global expansion of businesses and the need for better service delivery in geographically dispersed areas are significant catalysts for growth.
Technological disruptions, especially the integration of AI and machine learning, are reshaping the industry landscape. These advancements are enabling predictive maintenance, optimized routing, and automated workflows, leading to substantial cost savings and improved service quality. Consumer preferences are shifting towards user-friendly, mobile-accessible platforms that provide real-time visibility into service operations. Competitive dynamics are intensifying, with established players expanding their product offerings and new entrants focusing on specialized niches. The market penetration of cloud-based solutions is increasing steadily, with projections indicating a significant market share by 2033. The overall market exhibits a robust CAGR of xx%, signifying the rapid pace of adoption and technological innovation.
Dominant Markets & Segments in FSM Industry
The North American region currently dominates the global FSM market, driven by the high adoption rate of advanced technologies and the presence of several major players. However, the Asia-Pacific region is expected to witness significant growth in the coming years due to rising technological advancements and increasing infrastructural investments.
Key Drivers for Regional Dominance:
- North America: High technological adoption, robust infrastructure, established players, and strong consumer demand.
- Europe: Growing adoption of cloud-based solutions, stringent regulatory frameworks driving digital transformation, and high demand for efficient service delivery.
- Asia-Pacific: Rapid technological advancement, increasing infrastructure investments, rising consumer spending, and a growing base of SMEs.
Dominant Segments:
- Deployment Type: Cloud deployment is the fastest-growing segment, driven by its scalability, flexibility, and cost-effectiveness.
- Organization Size: Large enterprises are the major consumers of FSM solutions due to their complex operational needs and large service teams.
- FSM Software and Service Type: Scheduling, dispatch & route optimization are high-demand features; however, other services (e.g., billing, inventory management) are becoming increasingly critical.
- End-User: The IT & Telecom sector demonstrates high adoption, followed by Healthcare and Lifesciences, due to their critical need for efficient and timely service delivery.
FSM Industry Product Developments
Recent product developments emphasize the integration of AI, machine learning, and IoT capabilities into FSM platforms. This trend enables predictive maintenance, optimized resource allocation, and improved customer communication. ServiceMax's launch of DataGuide showcases the focus on enhancing data collection and reporting, improving operational efficiency and decision-making. New applications are emerging in sectors like renewable energy and smart cities, leveraging FSM solutions for managing assets and service operations. The competitive advantage lies in delivering integrated, scalable, and user-friendly solutions that cater to the specific needs of diverse industries.
Report Scope & Segmentation Analysis
This report covers the global FSM market, segmented by deployment type (on-premises, cloud), organization size (SMEs, large enterprises), FSM software and service type (scheduling, dispatch & route optimization, service contract management, work order management, customer management, inventory management, other software, services), and end-user (allied FM, IT & Telecom, healthcare & life sciences, energy & utilities, oil & gas, manufacturing, other end-users). Each segment is analyzed for market size, growth projections, and competitive dynamics, providing a granular understanding of the market landscape. The projected growth rates vary across segments, with the cloud deployment type and large enterprises showing higher growth potential compared to on-premises and SMEs, respectively. The IT and Telecom sector shows strong growth potential among end-users due to its reliance on efficient and timely service delivery.
Key Drivers of FSM Industry Growth
The FSM industry's growth is propelled by technological advancements (e.g., AI, IoT, cloud computing), increasing demand for improved service efficiency and customer satisfaction across industries, and the growing adoption of mobile technologies and digital transformation initiatives. Stringent regulatory compliance and increasing competition also drive innovation and efficiency improvements. The expansion of the gig economy and increasing need for workforce optimization is another significant factor.
Challenges in the FSM Industry Sector
Significant challenges include integrating legacy systems with modern FSM solutions, ensuring data security and privacy compliance, managing the complexity of diverse industry-specific needs, and maintaining a competitive edge in a rapidly evolving market. Supply chain disruptions can impact the timely delivery of services, and the increasing cost of skilled labor poses challenges to service providers. Furthermore, regulatory hurdles related to data privacy and security can add complexities to business operations.
Emerging Opportunities in FSM Industry
Emerging opportunities lie in expanding into new and underserved markets, leveraging advanced analytics for predictive maintenance and proactive service delivery, integrating with emerging technologies like AR/VR for enhanced technician support, and developing specialized solutions for niche industries like renewable energy and smart cities. The expanding Internet of Things (IoT) presents significant opportunities for remote monitoring and predictive maintenance, and the rising importance of sustainability creates opportunities for eco-friendly FSM solutions.
Leading Players in the FSM Industry Market
- Mize Inc
- Microsoft Corporation (Dynamics 365 for Field Service)
- Zinier Inc
- The simPRO Group Pty Limited
- Kirona Solutions Limited
- IFS AB
- ServiceMax Inc
- Field Aware US Inc
- Salesforce com Inc (Field Service Cloud)
- Trimble Inc
- Oracle Corporation (OFSC)
- Accruent LLC (Fortive Corp)
- Coresystems (SAP SE)
- ServicePower Inc
Key Developments in FSM Industry Industry
- June 2022: ServiceMax launched DataGuide, enhancing form and report generation capabilities, boosting service productivity.
- October 2022: Visma acquired OutSmart, a provider of FSM software for SMEs, expanding its European market presence and product portfolio.
Strategic Outlook for FSM Industry Market
The FSM market is poised for continued growth, driven by technological advancements, increasing demand for efficient service delivery, and the expansion of cloud-based solutions. The integration of AI, IoT, and advanced analytics will further enhance operational efficiency and customer satisfaction, creating new opportunities for innovation and market expansion. The focus on data-driven decision-making and proactive service strategies will shape future market dynamics, creating a positive outlook for the industry's long-term growth.
FSM Industry Segmentation
-
1. Deployment Type
- 1.1. On-premises
- 1.2. Cloud
-
2. Organisation Size
- 2.1. Small and Medium Enterprises
- 2.2. Large Enterprises
-
3. FSM Software and Service Type
- 3.1. Scheduling, Dispatch & Route Optimization
- 3.2. Service Contract Management
- 3.3. Work Order Management
- 3.4. Customer Management
- 3.5. Inventory Management
- 3.6. Services
-
4. End-User
- 4.1. Allied F
- 4.2. IT and Telecom
- 4.3. Healthcare and Lifesciences
- 4.4. Energy and Utilities
- 4.5. Oil and Gas
- 4.6. Manufacturing
- 4.7. Other
FSM Industry Segmentation By Geography
- 1. North America
- 2. Europe
- 3. Asia
- 4. Australia and New Zealand
- 5. Middle East and Africa
- 6. Latin America
FSM Industry REPORT HIGHLIGHTS
| Aspects | Details |
|---|---|
| Study Period | 2019-2033 |
| Base Year | 2024 |
| Estimated Year | 2025 |
| Forecast Period | 2025-2033 |
| Historical Period | 2019-2024 |
| Growth Rate | CAGR of 11.70% from 2019-2033 |
| Segmentation |
|
Table of Contents
- 1. Introduction
- 1.1. Research Scope
- 1.2. Market Segmentation
- 1.3. Research Methodology
- 1.4. Definitions and Assumptions
- 2. Executive Summary
- 2.1. Introduction
- 3. Market Dynamics
- 3.1. Introduction
- 3.2. Market Drivers
- 3.2.1. Growing emphasis on maximizing work efficiency; Technological trends such as mobility and adoption of cloud-based solutions; Creation of new sales opportunities
- 3.3. Market Restrains
- 3.3.1. Increasing Risk of Counterfeits
- 3.4. Market Trends
- 3.4.1. Service Contract Management to Hold Significant Market Share
- 4. Market Factor Analysis
- 4.1. Porters Five Forces
- 4.2. Supply/Value Chain
- 4.3. PESTEL analysis
- 4.4. Market Entropy
- 4.5. Patent/Trademark Analysis
- 5. Global FSM Industry Analysis, Insights and Forecast, 2019-2031
- 5.1. Market Analysis, Insights and Forecast - by Deployment Type
- 5.1.1. On-premises
- 5.1.2. Cloud
- 5.2. Market Analysis, Insights and Forecast - by Organisation Size
- 5.2.1. Small and Medium Enterprises
- 5.2.2. Large Enterprises
- 5.3. Market Analysis, Insights and Forecast - by FSM Software and Service Type
- 5.3.1. Scheduling, Dispatch & Route Optimization
- 5.3.2. Service Contract Management
- 5.3.3. Work Order Management
- 5.3.4. Customer Management
- 5.3.5. Inventory Management
- 5.3.6. Services
- 5.4. Market Analysis, Insights and Forecast - by End-User
- 5.4.1. Allied F
- 5.4.2. IT and Telecom
- 5.4.3. Healthcare and Lifesciences
- 5.4.4. Energy and Utilities
- 5.4.5. Oil and Gas
- 5.4.6. Manufacturing
- 5.4.7. Other
- 5.5. Market Analysis, Insights and Forecast - by Region
- 5.5.1. North America
- 5.5.2. Europe
- 5.5.3. Asia
- 5.5.4. Australia and New Zealand
- 5.5.5. Middle East and Africa
- 5.5.6. Latin America
- 5.1. Market Analysis, Insights and Forecast - by Deployment Type
- 6. North America FSM Industry Analysis, Insights and Forecast, 2019-2031
- 6.1. Market Analysis, Insights and Forecast - by Deployment Type
- 6.1.1. On-premises
- 6.1.2. Cloud
- 6.2. Market Analysis, Insights and Forecast - by Organisation Size
- 6.2.1. Small and Medium Enterprises
- 6.2.2. Large Enterprises
- 6.3. Market Analysis, Insights and Forecast - by FSM Software and Service Type
- 6.3.1. Scheduling, Dispatch & Route Optimization
- 6.3.2. Service Contract Management
- 6.3.3. Work Order Management
- 6.3.4. Customer Management
- 6.3.5. Inventory Management
- 6.3.6. Services
- 6.4. Market Analysis, Insights and Forecast - by End-User
- 6.4.1. Allied F
- 6.4.2. IT and Telecom
- 6.4.3. Healthcare and Lifesciences
- 6.4.4. Energy and Utilities
- 6.4.5. Oil and Gas
- 6.4.6. Manufacturing
- 6.4.7. Other
- 6.1. Market Analysis, Insights and Forecast - by Deployment Type
- 7. Europe FSM Industry Analysis, Insights and Forecast, 2019-2031
- 7.1. Market Analysis, Insights and Forecast - by Deployment Type
- 7.1.1. On-premises
- 7.1.2. Cloud
- 7.2. Market Analysis, Insights and Forecast - by Organisation Size
- 7.2.1. Small and Medium Enterprises
- 7.2.2. Large Enterprises
- 7.3. Market Analysis, Insights and Forecast - by FSM Software and Service Type
- 7.3.1. Scheduling, Dispatch & Route Optimization
- 7.3.2. Service Contract Management
- 7.3.3. Work Order Management
- 7.3.4. Customer Management
- 7.3.5. Inventory Management
- 7.3.6. Services
- 7.4. Market Analysis, Insights and Forecast - by End-User
- 7.4.1. Allied F
- 7.4.2. IT and Telecom
- 7.4.3. Healthcare and Lifesciences
- 7.4.4. Energy and Utilities
- 7.4.5. Oil and Gas
- 7.4.6. Manufacturing
- 7.4.7. Other
- 7.1. Market Analysis, Insights and Forecast - by Deployment Type
- 8. Asia FSM Industry Analysis, Insights and Forecast, 2019-2031
- 8.1. Market Analysis, Insights and Forecast - by Deployment Type
- 8.1.1. On-premises
- 8.1.2. Cloud
- 8.2. Market Analysis, Insights and Forecast - by Organisation Size
- 8.2.1. Small and Medium Enterprises
- 8.2.2. Large Enterprises
- 8.3. Market Analysis, Insights and Forecast - by FSM Software and Service Type
- 8.3.1. Scheduling, Dispatch & Route Optimization
- 8.3.2. Service Contract Management
- 8.3.3. Work Order Management
- 8.3.4. Customer Management
- 8.3.5. Inventory Management
- 8.3.6. Services
- 8.4. Market Analysis, Insights and Forecast - by End-User
- 8.4.1. Allied F
- 8.4.2. IT and Telecom
- 8.4.3. Healthcare and Lifesciences
- 8.4.4. Energy and Utilities
- 8.4.5. Oil and Gas
- 8.4.6. Manufacturing
- 8.4.7. Other
- 8.1. Market Analysis, Insights and Forecast - by Deployment Type
- 9. Australia and New Zealand FSM Industry Analysis, Insights and Forecast, 2019-2031
- 9.1. Market Analysis, Insights and Forecast - by Deployment Type
- 9.1.1. On-premises
- 9.1.2. Cloud
- 9.2. Market Analysis, Insights and Forecast - by Organisation Size
- 9.2.1. Small and Medium Enterprises
- 9.2.2. Large Enterprises
- 9.3. Market Analysis, Insights and Forecast - by FSM Software and Service Type
- 9.3.1. Scheduling, Dispatch & Route Optimization
- 9.3.2. Service Contract Management
- 9.3.3. Work Order Management
- 9.3.4. Customer Management
- 9.3.5. Inventory Management
- 9.3.6. Services
- 9.4. Market Analysis, Insights and Forecast - by End-User
- 9.4.1. Allied F
- 9.4.2. IT and Telecom
- 9.4.3. Healthcare and Lifesciences
- 9.4.4. Energy and Utilities
- 9.4.5. Oil and Gas
- 9.4.6. Manufacturing
- 9.4.7. Other
- 9.1. Market Analysis, Insights and Forecast - by Deployment Type
- 10. Middle East and Africa FSM Industry Analysis, Insights and Forecast, 2019-2031
- 10.1. Market Analysis, Insights and Forecast - by Deployment Type
- 10.1.1. On-premises
- 10.1.2. Cloud
- 10.2. Market Analysis, Insights and Forecast - by Organisation Size
- 10.2.1. Small and Medium Enterprises
- 10.2.2. Large Enterprises
- 10.3. Market Analysis, Insights and Forecast - by FSM Software and Service Type
- 10.3.1. Scheduling, Dispatch & Route Optimization
- 10.3.2. Service Contract Management
- 10.3.3. Work Order Management
- 10.3.4. Customer Management
- 10.3.5. Inventory Management
- 10.3.6. Services
- 10.4. Market Analysis, Insights and Forecast - by End-User
- 10.4.1. Allied F
- 10.4.2. IT and Telecom
- 10.4.3. Healthcare and Lifesciences
- 10.4.4. Energy and Utilities
- 10.4.5. Oil and Gas
- 10.4.6. Manufacturing
- 10.4.7. Other
- 10.1. Market Analysis, Insights and Forecast - by Deployment Type
- 11. Latin America FSM Industry Analysis, Insights and Forecast, 2019-2031
- 11.1. Market Analysis, Insights and Forecast - by Deployment Type
- 11.1.1. On-premises
- 11.1.2. Cloud
- 11.2. Market Analysis, Insights and Forecast - by Organisation Size
- 11.2.1. Small and Medium Enterprises
- 11.2.2. Large Enterprises
- 11.3. Market Analysis, Insights and Forecast - by FSM Software and Service Type
- 11.3.1. Scheduling, Dispatch & Route Optimization
- 11.3.2. Service Contract Management
- 11.3.3. Work Order Management
- 11.3.4. Customer Management
- 11.3.5. Inventory Management
- 11.3.6. Services
- 11.4. Market Analysis, Insights and Forecast - by End-User
- 11.4.1. Allied F
- 11.4.2. IT and Telecom
- 11.4.3. Healthcare and Lifesciences
- 11.4.4. Energy and Utilities
- 11.4.5. Oil and Gas
- 11.4.6. Manufacturing
- 11.4.7. Other
- 11.1. Market Analysis, Insights and Forecast - by Deployment Type
- 12. North America FSM Industry Analysis, Insights and Forecast, 2019-2031
- 12.1. Market Analysis, Insights and Forecast - By Country/Sub-region
- 12.1.1 United States
- 12.1.2 Canada
- 12.1.3 Mexico
- 13. Europe FSM Industry Analysis, Insights and Forecast, 2019-2031
- 13.1. Market Analysis, Insights and Forecast - By Country/Sub-region
- 13.1.1 Germany
- 13.1.2 United Kingdom
- 13.1.3 France
- 13.1.4 Spain
- 13.1.5 Italy
- 13.1.6 Spain
- 13.1.7 Belgium
- 13.1.8 Netherland
- 13.1.9 Nordics
- 13.1.10 Rest of Europe
- 14. Asia Pacific FSM Industry Analysis, Insights and Forecast, 2019-2031
- 14.1. Market Analysis, Insights and Forecast - By Country/Sub-region
- 14.1.1 China
- 14.1.2 Japan
- 14.1.3 India
- 14.1.4 South Korea
- 14.1.5 Southeast Asia
- 14.1.6 Australia
- 14.1.7 Indonesia
- 14.1.8 Phillipes
- 14.1.9 Singapore
- 14.1.10 Thailandc
- 14.1.11 Rest of Asia Pacific
- 15. South America FSM Industry Analysis, Insights and Forecast, 2019-2031
- 15.1. Market Analysis, Insights and Forecast - By Country/Sub-region
- 15.1.1 Brazil
- 15.1.2 Argentina
- 15.1.3 Peru
- 15.1.4 Chile
- 15.1.5 Colombia
- 15.1.6 Ecuador
- 15.1.7 Venezuela
- 15.1.8 Rest of South America
- 16. North America FSM Industry Analysis, Insights and Forecast, 2019-2031
- 16.1. Market Analysis, Insights and Forecast - By Country/Sub-region
- 16.1.1 United States
- 16.1.2 Canada
- 16.1.3 Mexico
- 17. MEA FSM Industry Analysis, Insights and Forecast, 2019-2031
- 17.1. Market Analysis, Insights and Forecast - By Country/Sub-region
- 17.1.1 United Arab Emirates
- 17.1.2 Saudi Arabia
- 17.1.3 South Africa
- 17.1.4 Rest of Middle East and Africa
- 18. Competitive Analysis
- 18.1. Global Market Share Analysis 2024
- 18.2. Company Profiles
- 18.2.1 Mize Inc
- 18.2.1.1. Overview
- 18.2.1.2. Products
- 18.2.1.3. SWOT Analysis
- 18.2.1.4. Recent Developments
- 18.2.1.5. Financials (Based on Availability)
- 18.2.2 Microsoft Corporation (Dynamics 365 for Field Service)
- 18.2.2.1. Overview
- 18.2.2.2. Products
- 18.2.2.3. SWOT Analysis
- 18.2.2.4. Recent Developments
- 18.2.2.5. Financials (Based on Availability)
- 18.2.3 Zinier Inc
- 18.2.3.1. Overview
- 18.2.3.2. Products
- 18.2.3.3. SWOT Analysis
- 18.2.3.4. Recent Developments
- 18.2.3.5. Financials (Based on Availability)
- 18.2.4 The simPRO Group Pty Limited
- 18.2.4.1. Overview
- 18.2.4.2. Products
- 18.2.4.3. SWOT Analysis
- 18.2.4.4. Recent Developments
- 18.2.4.5. Financials (Based on Availability)
- 18.2.5 Kirona Solutions Limited
- 18.2.5.1. Overview
- 18.2.5.2. Products
- 18.2.5.3. SWOT Analysis
- 18.2.5.4. Recent Developments
- 18.2.5.5. Financials (Based on Availability)
- 18.2.6 IFS AB
- 18.2.6.1. Overview
- 18.2.6.2. Products
- 18.2.6.3. SWOT Analysis
- 18.2.6.4. Recent Developments
- 18.2.6.5. Financials (Based on Availability)
- 18.2.7 ServiceMax Inc
- 18.2.7.1. Overview
- 18.2.7.2. Products
- 18.2.7.3. SWOT Analysis
- 18.2.7.4. Recent Developments
- 18.2.7.5. Financials (Based on Availability)
- 18.2.8 Field Aware US Inc
- 18.2.8.1. Overview
- 18.2.8.2. Products
- 18.2.8.3. SWOT Analysis
- 18.2.8.4. Recent Developments
- 18.2.8.5. Financials (Based on Availability)
- 18.2.9 Salesforce com Inc (Field Service Cloud)
- 18.2.9.1. Overview
- 18.2.9.2. Products
- 18.2.9.3. SWOT Analysis
- 18.2.9.4. Recent Developments
- 18.2.9.5. Financials (Based on Availability)
- 18.2.10 Trimble Inc
- 18.2.10.1. Overview
- 18.2.10.2. Products
- 18.2.10.3. SWOT Analysis
- 18.2.10.4. Recent Developments
- 18.2.10.5. Financials (Based on Availability)
- 18.2.11 Oracle Corporation (OFSC)
- 18.2.11.1. Overview
- 18.2.11.2. Products
- 18.2.11.3. SWOT Analysis
- 18.2.11.4. Recent Developments
- 18.2.11.5. Financials (Based on Availability)
- 18.2.12 Accruent LLC (Fortive Corp)
- 18.2.12.1. Overview
- 18.2.12.2. Products
- 18.2.12.3. SWOT Analysis
- 18.2.12.4. Recent Developments
- 18.2.12.5. Financials (Based on Availability)
- 18.2.13 Coresystems (SAP SE)
- 18.2.13.1. Overview
- 18.2.13.2. Products
- 18.2.13.3. SWOT Analysis
- 18.2.13.4. Recent Developments
- 18.2.13.5. Financials (Based on Availability)
- 18.2.14 ServicePower Inc
- 18.2.14.1. Overview
- 18.2.14.2. Products
- 18.2.14.3. SWOT Analysis
- 18.2.14.4. Recent Developments
- 18.2.14.5. Financials (Based on Availability)
- 18.2.1 Mize Inc
List of Figures
- Figure 1: Global FSM Industry Revenue Breakdown (Million, %) by Region 2024 & 2032
- Figure 2: North America FSM Industry Revenue (Million), by Country 2024 & 2032
- Figure 3: North America FSM Industry Revenue Share (%), by Country 2024 & 2032
- Figure 4: Europe FSM Industry Revenue (Million), by Country 2024 & 2032
- Figure 5: Europe FSM Industry Revenue Share (%), by Country 2024 & 2032
- Figure 6: Asia Pacific FSM Industry Revenue (Million), by Country 2024 & 2032
- Figure 7: Asia Pacific FSM Industry Revenue Share (%), by Country 2024 & 2032
- Figure 8: South America FSM Industry Revenue (Million), by Country 2024 & 2032
- Figure 9: South America FSM Industry Revenue Share (%), by Country 2024 & 2032
- Figure 10: North America FSM Industry Revenue (Million), by Country 2024 & 2032
- Figure 11: North America FSM Industry Revenue Share (%), by Country 2024 & 2032
- Figure 12: MEA FSM Industry Revenue (Million), by Country 2024 & 2032
- Figure 13: MEA FSM Industry Revenue Share (%), by Country 2024 & 2032
- Figure 14: North America FSM Industry Revenue (Million), by Deployment Type 2024 & 2032
- Figure 15: North America FSM Industry Revenue Share (%), by Deployment Type 2024 & 2032
- Figure 16: North America FSM Industry Revenue (Million), by Organisation Size 2024 & 2032
- Figure 17: North America FSM Industry Revenue Share (%), by Organisation Size 2024 & 2032
- Figure 18: North America FSM Industry Revenue (Million), by FSM Software and Service Type 2024 & 2032
- Figure 19: North America FSM Industry Revenue Share (%), by FSM Software and Service Type 2024 & 2032
- Figure 20: North America FSM Industry Revenue (Million), by End-User 2024 & 2032
- Figure 21: North America FSM Industry Revenue Share (%), by End-User 2024 & 2032
- Figure 22: North America FSM Industry Revenue (Million), by Country 2024 & 2032
- Figure 23: North America FSM Industry Revenue Share (%), by Country 2024 & 2032
- Figure 24: Europe FSM Industry Revenue (Million), by Deployment Type 2024 & 2032
- Figure 25: Europe FSM Industry Revenue Share (%), by Deployment Type 2024 & 2032
- Figure 26: Europe FSM Industry Revenue (Million), by Organisation Size 2024 & 2032
- Figure 27: Europe FSM Industry Revenue Share (%), by Organisation Size 2024 & 2032
- Figure 28: Europe FSM Industry Revenue (Million), by FSM Software and Service Type 2024 & 2032
- Figure 29: Europe FSM Industry Revenue Share (%), by FSM Software and Service Type 2024 & 2032
- Figure 30: Europe FSM Industry Revenue (Million), by End-User 2024 & 2032
- Figure 31: Europe FSM Industry Revenue Share (%), by End-User 2024 & 2032
- Figure 32: Europe FSM Industry Revenue (Million), by Country 2024 & 2032
- Figure 33: Europe FSM Industry Revenue Share (%), by Country 2024 & 2032
- Figure 34: Asia FSM Industry Revenue (Million), by Deployment Type 2024 & 2032
- Figure 35: Asia FSM Industry Revenue Share (%), by Deployment Type 2024 & 2032
- Figure 36: Asia FSM Industry Revenue (Million), by Organisation Size 2024 & 2032
- Figure 37: Asia FSM Industry Revenue Share (%), by Organisation Size 2024 & 2032
- Figure 38: Asia FSM Industry Revenue (Million), by FSM Software and Service Type 2024 & 2032
- Figure 39: Asia FSM Industry Revenue Share (%), by FSM Software and Service Type 2024 & 2032
- Figure 40: Asia FSM Industry Revenue (Million), by End-User 2024 & 2032
- Figure 41: Asia FSM Industry Revenue Share (%), by End-User 2024 & 2032
- Figure 42: Asia FSM Industry Revenue (Million), by Country 2024 & 2032
- Figure 43: Asia FSM Industry Revenue Share (%), by Country 2024 & 2032
- Figure 44: Australia and New Zealand FSM Industry Revenue (Million), by Deployment Type 2024 & 2032
- Figure 45: Australia and New Zealand FSM Industry Revenue Share (%), by Deployment Type 2024 & 2032
- Figure 46: Australia and New Zealand FSM Industry Revenue (Million), by Organisation Size 2024 & 2032
- Figure 47: Australia and New Zealand FSM Industry Revenue Share (%), by Organisation Size 2024 & 2032
- Figure 48: Australia and New Zealand FSM Industry Revenue (Million), by FSM Software and Service Type 2024 & 2032
- Figure 49: Australia and New Zealand FSM Industry Revenue Share (%), by FSM Software and Service Type 2024 & 2032
- Figure 50: Australia and New Zealand FSM Industry Revenue (Million), by End-User 2024 & 2032
- Figure 51: Australia and New Zealand FSM Industry Revenue Share (%), by End-User 2024 & 2032
- Figure 52: Australia and New Zealand FSM Industry Revenue (Million), by Country 2024 & 2032
- Figure 53: Australia and New Zealand FSM Industry Revenue Share (%), by Country 2024 & 2032
- Figure 54: Middle East and Africa FSM Industry Revenue (Million), by Deployment Type 2024 & 2032
- Figure 55: Middle East and Africa FSM Industry Revenue Share (%), by Deployment Type 2024 & 2032
- Figure 56: Middle East and Africa FSM Industry Revenue (Million), by Organisation Size 2024 & 2032
- Figure 57: Middle East and Africa FSM Industry Revenue Share (%), by Organisation Size 2024 & 2032
- Figure 58: Middle East and Africa FSM Industry Revenue (Million), by FSM Software and Service Type 2024 & 2032
- Figure 59: Middle East and Africa FSM Industry Revenue Share (%), by FSM Software and Service Type 2024 & 2032
- Figure 60: Middle East and Africa FSM Industry Revenue (Million), by End-User 2024 & 2032
- Figure 61: Middle East and Africa FSM Industry Revenue Share (%), by End-User 2024 & 2032
- Figure 62: Middle East and Africa FSM Industry Revenue (Million), by Country 2024 & 2032
- Figure 63: Middle East and Africa FSM Industry Revenue Share (%), by Country 2024 & 2032
- Figure 64: Latin America FSM Industry Revenue (Million), by Deployment Type 2024 & 2032
- Figure 65: Latin America FSM Industry Revenue Share (%), by Deployment Type 2024 & 2032
- Figure 66: Latin America FSM Industry Revenue (Million), by Organisation Size 2024 & 2032
- Figure 67: Latin America FSM Industry Revenue Share (%), by Organisation Size 2024 & 2032
- Figure 68: Latin America FSM Industry Revenue (Million), by FSM Software and Service Type 2024 & 2032
- Figure 69: Latin America FSM Industry Revenue Share (%), by FSM Software and Service Type 2024 & 2032
- Figure 70: Latin America FSM Industry Revenue (Million), by End-User 2024 & 2032
- Figure 71: Latin America FSM Industry Revenue Share (%), by End-User 2024 & 2032
- Figure 72: Latin America FSM Industry Revenue (Million), by Country 2024 & 2032
- Figure 73: Latin America FSM Industry Revenue Share (%), by Country 2024 & 2032
List of Tables
- Table 1: Global FSM Industry Revenue Million Forecast, by Region 2019 & 2032
- Table 2: Global FSM Industry Revenue Million Forecast, by Deployment Type 2019 & 2032
- Table 3: Global FSM Industry Revenue Million Forecast, by Organisation Size 2019 & 2032
- Table 4: Global FSM Industry Revenue Million Forecast, by FSM Software and Service Type 2019 & 2032
- Table 5: Global FSM Industry Revenue Million Forecast, by End-User 2019 & 2032
- Table 6: Global FSM Industry Revenue Million Forecast, by Region 2019 & 2032
- Table 7: Global FSM Industry Revenue Million Forecast, by Country 2019 & 2032
- Table 8: United States FSM Industry Revenue (Million) Forecast, by Application 2019 & 2032
- Table 9: Canada FSM Industry Revenue (Million) Forecast, by Application 2019 & 2032
- Table 10: Mexico FSM Industry Revenue (Million) Forecast, by Application 2019 & 2032
- Table 11: Global FSM Industry Revenue Million Forecast, by Country 2019 & 2032
- Table 12: Germany FSM Industry Revenue (Million) Forecast, by Application 2019 & 2032
- Table 13: United Kingdom FSM Industry Revenue (Million) Forecast, by Application 2019 & 2032
- Table 14: France FSM Industry Revenue (Million) Forecast, by Application 2019 & 2032
- Table 15: Spain FSM Industry Revenue (Million) Forecast, by Application 2019 & 2032
- Table 16: Italy FSM Industry Revenue (Million) Forecast, by Application 2019 & 2032
- Table 17: Spain FSM Industry Revenue (Million) Forecast, by Application 2019 & 2032
- Table 18: Belgium FSM Industry Revenue (Million) Forecast, by Application 2019 & 2032
- Table 19: Netherland FSM Industry Revenue (Million) Forecast, by Application 2019 & 2032
- Table 20: Nordics FSM Industry Revenue (Million) Forecast, by Application 2019 & 2032
- Table 21: Rest of Europe FSM Industry Revenue (Million) Forecast, by Application 2019 & 2032
- Table 22: Global FSM Industry Revenue Million Forecast, by Country 2019 & 2032
- Table 23: China FSM Industry Revenue (Million) Forecast, by Application 2019 & 2032
- Table 24: Japan FSM Industry Revenue (Million) Forecast, by Application 2019 & 2032
- Table 25: India FSM Industry Revenue (Million) Forecast, by Application 2019 & 2032
- Table 26: South Korea FSM Industry Revenue (Million) Forecast, by Application 2019 & 2032
- Table 27: Southeast Asia FSM Industry Revenue (Million) Forecast, by Application 2019 & 2032
- Table 28: Australia FSM Industry Revenue (Million) Forecast, by Application 2019 & 2032
- Table 29: Indonesia FSM Industry Revenue (Million) Forecast, by Application 2019 & 2032
- Table 30: Phillipes FSM Industry Revenue (Million) Forecast, by Application 2019 & 2032
- Table 31: Singapore FSM Industry Revenue (Million) Forecast, by Application 2019 & 2032
- Table 32: Thailandc FSM Industry Revenue (Million) Forecast, by Application 2019 & 2032
- Table 33: Rest of Asia Pacific FSM Industry Revenue (Million) Forecast, by Application 2019 & 2032
- Table 34: Global FSM Industry Revenue Million Forecast, by Country 2019 & 2032
- Table 35: Brazil FSM Industry Revenue (Million) Forecast, by Application 2019 & 2032
- Table 36: Argentina FSM Industry Revenue (Million) Forecast, by Application 2019 & 2032
- Table 37: Peru FSM Industry Revenue (Million) Forecast, by Application 2019 & 2032
- Table 38: Chile FSM Industry Revenue (Million) Forecast, by Application 2019 & 2032
- Table 39: Colombia FSM Industry Revenue (Million) Forecast, by Application 2019 & 2032
- Table 40: Ecuador FSM Industry Revenue (Million) Forecast, by Application 2019 & 2032
- Table 41: Venezuela FSM Industry Revenue (Million) Forecast, by Application 2019 & 2032
- Table 42: Rest of South America FSM Industry Revenue (Million) Forecast, by Application 2019 & 2032
- Table 43: Global FSM Industry Revenue Million Forecast, by Country 2019 & 2032
- Table 44: United States FSM Industry Revenue (Million) Forecast, by Application 2019 & 2032
- Table 45: Canada FSM Industry Revenue (Million) Forecast, by Application 2019 & 2032
- Table 46: Mexico FSM Industry Revenue (Million) Forecast, by Application 2019 & 2032
- Table 47: Global FSM Industry Revenue Million Forecast, by Country 2019 & 2032
- Table 48: United Arab Emirates FSM Industry Revenue (Million) Forecast, by Application 2019 & 2032
- Table 49: Saudi Arabia FSM Industry Revenue (Million) Forecast, by Application 2019 & 2032
- Table 50: South Africa FSM Industry Revenue (Million) Forecast, by Application 2019 & 2032
- Table 51: Rest of Middle East and Africa FSM Industry Revenue (Million) Forecast, by Application 2019 & 2032
- Table 52: Global FSM Industry Revenue Million Forecast, by Deployment Type 2019 & 2032
- Table 53: Global FSM Industry Revenue Million Forecast, by Organisation Size 2019 & 2032
- Table 54: Global FSM Industry Revenue Million Forecast, by FSM Software and Service Type 2019 & 2032
- Table 55: Global FSM Industry Revenue Million Forecast, by End-User 2019 & 2032
- Table 56: Global FSM Industry Revenue Million Forecast, by Country 2019 & 2032
- Table 57: Global FSM Industry Revenue Million Forecast, by Deployment Type 2019 & 2032
- Table 58: Global FSM Industry Revenue Million Forecast, by Organisation Size 2019 & 2032
- Table 59: Global FSM Industry Revenue Million Forecast, by FSM Software and Service Type 2019 & 2032
- Table 60: Global FSM Industry Revenue Million Forecast, by End-User 2019 & 2032
- Table 61: Global FSM Industry Revenue Million Forecast, by Country 2019 & 2032
- Table 62: Global FSM Industry Revenue Million Forecast, by Deployment Type 2019 & 2032
- Table 63: Global FSM Industry Revenue Million Forecast, by Organisation Size 2019 & 2032
- Table 64: Global FSM Industry Revenue Million Forecast, by FSM Software and Service Type 2019 & 2032
- Table 65: Global FSM Industry Revenue Million Forecast, by End-User 2019 & 2032
- Table 66: Global FSM Industry Revenue Million Forecast, by Country 2019 & 2032
- Table 67: Global FSM Industry Revenue Million Forecast, by Deployment Type 2019 & 2032
- Table 68: Global FSM Industry Revenue Million Forecast, by Organisation Size 2019 & 2032
- Table 69: Global FSM Industry Revenue Million Forecast, by FSM Software and Service Type 2019 & 2032
- Table 70: Global FSM Industry Revenue Million Forecast, by End-User 2019 & 2032
- Table 71: Global FSM Industry Revenue Million Forecast, by Country 2019 & 2032
- Table 72: Global FSM Industry Revenue Million Forecast, by Deployment Type 2019 & 2032
- Table 73: Global FSM Industry Revenue Million Forecast, by Organisation Size 2019 & 2032
- Table 74: Global FSM Industry Revenue Million Forecast, by FSM Software and Service Type 2019 & 2032
- Table 75: Global FSM Industry Revenue Million Forecast, by End-User 2019 & 2032
- Table 76: Global FSM Industry Revenue Million Forecast, by Country 2019 & 2032
- Table 77: Global FSM Industry Revenue Million Forecast, by Deployment Type 2019 & 2032
- Table 78: Global FSM Industry Revenue Million Forecast, by Organisation Size 2019 & 2032
- Table 79: Global FSM Industry Revenue Million Forecast, by FSM Software and Service Type 2019 & 2032
- Table 80: Global FSM Industry Revenue Million Forecast, by End-User 2019 & 2032
- Table 81: Global FSM Industry Revenue Million Forecast, by Country 2019 & 2032
Frequently Asked Questions
1. What is the projected Compound Annual Growth Rate (CAGR) of the FSM Industry?
The projected CAGR is approximately 11.70%.
2. Which companies are prominent players in the FSM Industry?
Key companies in the market include Mize Inc, Microsoft Corporation (Dynamics 365 for Field Service), Zinier Inc, The simPRO Group Pty Limited, Kirona Solutions Limited, IFS AB, ServiceMax Inc, Field Aware US Inc, Salesforce com Inc (Field Service Cloud), Trimble Inc, Oracle Corporation (OFSC), Accruent LLC (Fortive Corp), Coresystems (SAP SE), ServicePower Inc.
3. What are the main segments of the FSM Industry?
The market segments include Deployment Type, Organisation Size, FSM Software and Service Type, End-User.
4. Can you provide details about the market size?
The market size is estimated to be USD 4.94 Million as of 2022.
5. What are some drivers contributing to market growth?
Growing emphasis on maximizing work efficiency; Technological trends such as mobility and adoption of cloud-based solutions; Creation of new sales opportunities.
6. What are the notable trends driving market growth?
Service Contract Management to Hold Significant Market Share.
7. Are there any restraints impacting market growth?
Increasing Risk of Counterfeits.
8. Can you provide examples of recent developments in the market?
October 2022 - OutSmart, a provider of field service management software for small and medium-sized organizations, has been acquired by Visma, a company in cloud software in Europe. OutSmart has operations in the Netherlands, Belgium, Germany, and Portugal. OutSmart can expedite its growth goals by joining Visma due to its software having features for digital scheduling, materials management, quotes, customer relationship management, time tracking, invoicing, project planning, contract and object management, as well as particular features for refrigeration installation.
9. What pricing options are available for accessing the report?
Pricing options include single-user, multi-user, and enterprise licenses priced at USD 4750, USD 5250, and USD 8750 respectively.
10. Is the market size provided in terms of value or volume?
The market size is provided in terms of value, measured in Million.
11. Are there any specific market keywords associated with the report?
Yes, the market keyword associated with the report is "FSM Industry," which aids in identifying and referencing the specific market segment covered.
12. How do I determine which pricing option suits my needs best?
The pricing options vary based on user requirements and access needs. Individual users may opt for single-user licenses, while businesses requiring broader access may choose multi-user or enterprise licenses for cost-effective access to the report.
13. Are there any additional resources or data provided in the FSM Industry report?
While the report offers comprehensive insights, it's advisable to review the specific contents or supplementary materials provided to ascertain if additional resources or data are available.
14. How can I stay updated on further developments or reports in the FSM Industry?
To stay informed about further developments, trends, and reports in the FSM Industry, consider subscribing to industry newsletters, following relevant companies and organizations, or regularly checking reputable industry news sources and publications.
Methodology
Step 1 - Identification of Relevant Samples Size from Population Database


Step 2 - Approaches for Defining Global Market Size (Value, Volume* & Price*)

Note*: In applicable scenarios
Step 3 - Data Sources
Primary Research
- Web Analytics
- Survey Reports
- Research Institute
- Latest Research Reports
- Opinion Leaders
Secondary Research
- Annual Reports
- White Paper
- Latest Press Release
- Industry Association
- Paid Database
- Investor Presentations

Step 4 - Data Triangulation
Involves using different sources of information in order to increase the validity of a study
These sources are likely to be stakeholders in a program - participants, other researchers, program staff, other community members, and so on.
Then we put all data in single framework & apply various statistical tools to find out the dynamic on the market.
During the analysis stage, feedback from the stakeholder groups would be compared to determine areas of agreement as well as areas of divergence


