
Key Insights
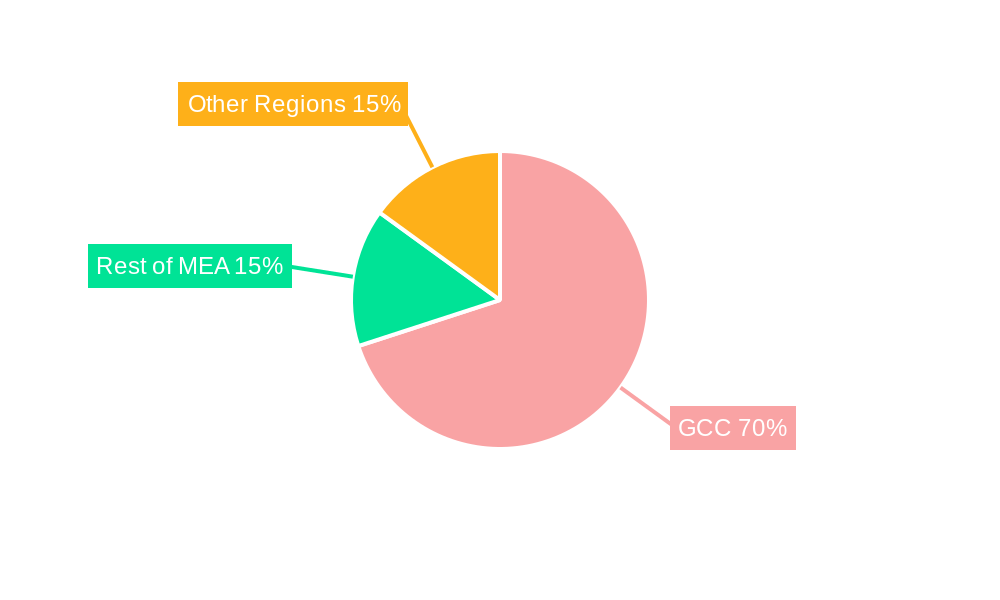
The GCC PET packaging market is experiencing robust growth, driven by a surge in demand from the food and beverage sector, coupled with the region's expanding population and rising disposable incomes. The increasing preference for convenient, lightweight, and recyclable packaging solutions fuels the adoption of PET materials. A compound annual growth rate (CAGR) exceeding 4% indicates a consistently expanding market, projected to reach significant value within the next decade. Key drivers include the rising popularity of bottled water and soft drinks, the growth of the e-commerce sector necessitating safe and efficient packaging, and government initiatives promoting sustainable packaging solutions. Furthermore, advancements in PET technology, leading to lighter-weight and more durable packaging, are contributing to market expansion. While challenges exist, such as fluctuations in raw material prices and environmental concerns regarding plastic waste, the overall outlook remains positive due to strategic investments in recycling infrastructure and the adoption of eco-friendly practices by major players like SABIC, BASF SE, and JBF RAK. The segmentation within the market reveals significant contributions from bottles, films and sheets, and household containers across diverse end-user industries, indicating a broad and diverse market landscape with considerable potential for future growth. The market's regional distribution reflects a strong concentration within the GCC, with further expansion anticipated across other Middle Eastern and African nations.
The diverse product types within the GCC PET packaging market, catering to various end-user industries such as food and beverage, automotive, and healthcare, showcase the market's versatility and resilience. Market leaders are proactively innovating to address concerns about sustainability and environmental impact through initiatives that promote recycling and the use of recycled PET materials. This commitment to sustainability is likely to be a key factor in the long-term success and growth of the GCC PET packaging market. Future growth will likely be influenced by factors such as technological advancements leading to more efficient production processes and the development of more sustainable PET alternatives. A consistent focus on innovative solutions, combined with a supportive regulatory environment, will further bolster the market's positive trajectory.
GCC PET Packaging Industry: Market Analysis, Trends, and Forecast 2019-2033
This comprehensive report provides an in-depth analysis of the GCC PET packaging industry, offering valuable insights for stakeholders seeking to understand market dynamics, growth opportunities, and competitive landscapes. The study period covers 2019-2033, with 2025 serving as the base and estimated year. The report leverages extensive primary and secondary research, incorporating data from key players, industry experts, and market intelligence databases to deliver actionable insights. The total market value in 2025 is estimated at xx Million, projected to reach xx Million by 2033, exhibiting a CAGR of xx%.
GCC PET Packaging Industry Market Concentration & Innovation
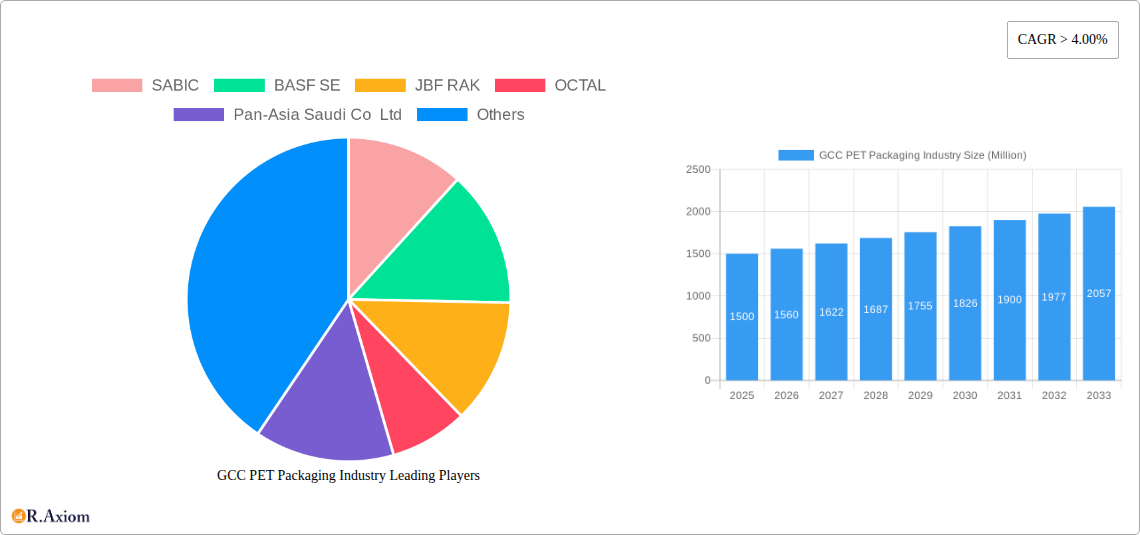
The GCC PET packaging market exhibits a moderately concentrated structure, with a few major players like SABIC, BASF SE, JBF RAK, OCTAL, and Pan-Asia Saudi Co Ltd holding significant market share. However, the presence of numerous smaller players ensures a dynamic competitive landscape. Market share analysis reveals SABIC holds approximately xx% market share in 2025, followed by BASF SE with xx%, JBF RAK with xx%, OCTAL with xx% and Pan-Asia Saudi Co Ltd with xx%. Innovation is driven by the increasing demand for sustainable packaging solutions, lightweighting initiatives to reduce transportation costs, and advancements in barrier technologies to enhance product shelf life. Regulatory frameworks, particularly concerning recyclability and material composition, are shaping product development. Significant M&A activity in the past five years, valued at approximately xx Million, signals industry consolidation and expansion strategies. Key drivers of M&A include acquiring new technologies, accessing wider distribution networks, and expanding product portfolios. Product substitutes, such as biodegradable plastics and paper-based alternatives, pose a growing challenge, prompting innovation in recyclable and sustainable PET packaging options. End-user trends, such as growing demand for convenience and e-commerce, fuel the need for innovative packaging designs and formats.
- Market Concentration: Moderately concentrated with key players holding significant share.
- Innovation Drivers: Sustainability, lightweighting, barrier technology advancements.
- M&A Activity (2020-2025): Total deal value approximately xx Million.
- Regulatory Influences: Focus on recyclability and material composition.
- Product Substitutes: Biodegradable plastics, paper-based alternatives.
GCC PET Packaging Industry Industry Trends & Insights
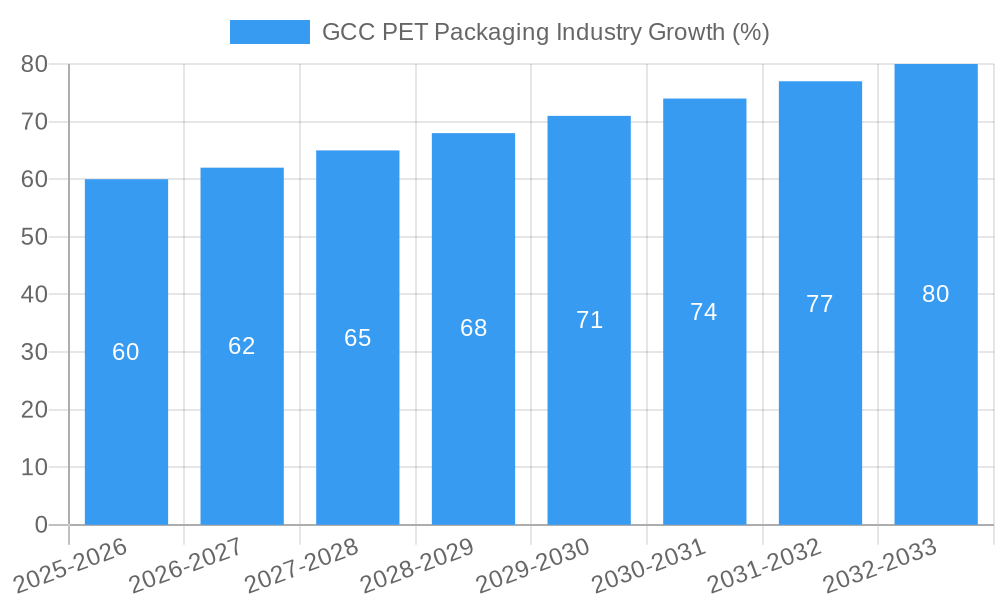
The GCC PET packaging market is experiencing robust growth fueled by several key factors. The region's expanding population, rising disposable incomes, and a burgeoning food and beverage sector are major contributors to increased demand. Technological disruptions, such as advancements in PET resin production, improved recycling technologies, and the adoption of automation in packaging processes, are improving efficiency and product quality. Consumer preferences are shifting towards sustainable and convenient packaging solutions, pushing manufacturers to innovate and offer eco-friendly options. Competitive dynamics are characterized by intense competition among established players and the emergence of new entrants focusing on niche markets or specialized applications. This competitive landscape drives innovation and price optimization, benefitting consumers. The market penetration of PET packaging in various end-use sectors is increasing steadily, with significant growth observed in the food and beverage and consumer goods segments. The compound annual growth rate (CAGR) for the forecast period (2025-2033) is estimated at xx%, reflecting the continued expansion of the market.
Dominant Markets & Segments in GCC PET Packaging Industry
The Food and Beverage sector dominates the GCC PET packaging market, accounting for approximately xx% of total market value in 2025. This dominance is driven by the region's significant growth in the food processing and beverage industries, along with rising consumption of packaged food and beverages. Within product types, Bottles constitute the largest segment, with a market share of approximately xx% in 2025, primarily due to their widespread use in beverages and other liquid products. Geographically, the Kingdom of Saudi Arabia leads the GCC market due to its large population, high consumption levels, and significant investments in the food and beverage industry.
Key Drivers for Food and Beverage Dominance: Rising consumption, growing food processing industry.
Key Drivers for Bottle Segment Dominance: Widespread use in beverage and liquid packaging.
Key Drivers for KSA Market Dominance: Large population, high consumption, industry investments.
Other significant segments: Consumer goods, healthcare, and automotive are showing steady growth due to increased demand for convenience and packaging advancements.
GCC PET Packaging Industry Product Developments
Recent product innovations focus on enhanced barrier properties to extend shelf life, lightweight designs to reduce material usage and transportation costs, and increased recyclability to meet growing sustainability demands. New applications are emerging in the healthcare and pharmaceutical sectors, driving the development of specialized PET packaging solutions. Competitive advantages are increasingly driven by technological advancements, sustainable manufacturing processes, and the ability to offer customized packaging solutions tailored to specific customer needs. This focus on innovation differentiates products and secures market share in a competitive landscape.
Report Scope & Segmentation Analysis
This report comprehensively analyzes the GCC PET packaging market, segmented by product type (Bottles, Films and Sheets, Household Containers, Other Product Types) and end-user industry (Food and Beverage, Automotive, Electrical and Electronics, Healthcare, Consumer Goods, Other End-user Industries). Each segment’s growth projections, market sizes, and competitive dynamics are detailed. The report examines market trends, opportunities, and challenges for each segment, providing a complete overview of the current state and future potential. For example, the Bottles segment is expected to grow at a CAGR of xx% during the forecast period, driven by increasing demand from the food and beverage industry, while the Films and Sheets segment demonstrates growth of xx%, reflecting their use in various packaging applications. Competitive dynamics within each segment are also analyzed, highlighting key players and their market strategies.
Key Drivers of GCC PET Packaging Industry Growth
The GCC PET packaging industry's growth is driven by several factors: the burgeoning food and beverage sector, increasing consumer demand for packaged goods, rising disposable incomes in the region, and government support for industrial development. Technological advancements in PET resin production and packaging technologies further contribute to market expansion. Favorable economic policies and infrastructure development also enhance market prospects. The adoption of sustainable packaging practices, driven by both consumer preferences and regulatory pressures, is another key growth driver.
Challenges in the GCC PET Packaging Industry Sector
Challenges include fluctuating raw material prices, environmental concerns related to plastic waste, stringent regulatory requirements for packaging materials, and the emergence of competing sustainable packaging alternatives. Supply chain disruptions can also negatively impact production and profitability. Intense competition among established players and new entrants puts pressure on pricing and profit margins. These challenges require innovative solutions and strategic adaptations to ensure continued growth and profitability.
Emerging Opportunities in GCC PET Packaging Industry
Emerging opportunities include the growing demand for sustainable and recyclable PET packaging, the expansion of e-commerce and its associated packaging needs, and the increasing use of PET packaging in specialized applications, such as pharmaceuticals and healthcare products. The development and adoption of advanced recycling technologies offer significant opportunities for the industry. Exploring new markets and focusing on customized packaging solutions tailored to specific customer requirements present further growth avenues.
Leading Players in the GCC PET Packaging Industry Market
Key Developments in GCC PET Packaging Industry Industry
- January 2023: SABIC launched a new range of recycled PET resins.
- March 2022: BASF SE invested in a new PET recycling facility in the region.
- June 2021: OCTAL expanded its production capacity for PET bottles.
- (Further developments can be added here)
Strategic Outlook for GCC PET Packaging Industry Market
The GCC PET packaging market presents significant growth potential driven by the region's economic development, changing consumer preferences, and technological advancements. Focusing on sustainable and recyclable solutions, embracing innovative packaging designs, and expanding into new applications will be crucial for success. The industry's strategic outlook is positive, with continued growth expected throughout the forecast period, particularly in segments aligned with sustainability trends and consumer demands for convenience and safety.
GCC PET Packaging Industry Segmentation
-
1. Product Type
- 1.1. Bottles
- 1.2. Films and Sheets
- 1.3. Household Containers
- 1.4. Other Product Types
-
2. End-user Industry
- 2.1. Food and Beverage
- 2.2. Automotive
- 2.3. Electrical and Electronics
- 2.4. Healthcare
- 2.5. Consumer Goods
- 2.6. Other End-user Industries
-
3. Geography
- 3.1. Saudi Arabia
- 3.2. Kuwait
- 3.3. United Arab Emirates
- 3.4. Qatar
- 3.5. Bahrain
- 3.6. Oman
GCC PET Packaging Industry Segmentation By Geography
- 1. Saudi Arabia
- 2. Kuwait
- 3. United Arab Emirates
- 4. Qatar
- 5. Bahrain
- 6. Oman
GCC PET Packaging Industry REPORT HIGHLIGHTS
| Aspects | Details |
|---|---|
| Study Period | 2019-2033 |
| Base Year | 2024 |
| Estimated Year | 2025 |
| Forecast Period | 2025-2033 |
| Historical Period | 2019-2024 |
| Growth Rate | CAGR of > 4.00% from 2019-2033 |
| Segmentation |
|
Table of Contents
- 1. Introduction
- 1.1. Research Scope
- 1.2. Market Segmentation
- 1.3. Research Methodology
- 1.4. Definitions and Assumptions
- 2. Executive Summary
- 2.1. Introduction
- 3. Market Dynamics
- 3.1. Introduction
- 3.2. Market Drivers
- 3.2.1. ; Increasing Emphasis on Recycling
- 3.3. Market Restrains
- 3.3.1. ; Aquatic Toxicity Related to Ionic Liquid; Unfavorable Conditions Arising Due to COVID-19 Outbreak
- 3.4. Market Trends
- 3.4.1. Soaring Demand from the Food and Beverage Industry
- 4. Market Factor Analysis
- 4.1. Porters Five Forces
- 4.2. Supply/Value Chain
- 4.3. PESTEL analysis
- 4.4. Market Entropy
- 4.5. Patent/Trademark Analysis
- 5. Global GCC PET Packaging Industry Analysis, Insights and Forecast, 2019-2031
- 5.1. Market Analysis, Insights and Forecast - by Product Type
- 5.1.1. Bottles
- 5.1.2. Films and Sheets
- 5.1.3. Household Containers
- 5.1.4. Other Product Types
- 5.2. Market Analysis, Insights and Forecast - by End-user Industry
- 5.2.1. Food and Beverage
- 5.2.2. Automotive
- 5.2.3. Electrical and Electronics
- 5.2.4. Healthcare
- 5.2.5. Consumer Goods
- 5.2.6. Other End-user Industries
- 5.3. Market Analysis, Insights and Forecast - by Geography
- 5.3.1. Saudi Arabia
- 5.3.2. Kuwait
- 5.3.3. United Arab Emirates
- 5.3.4. Qatar
- 5.3.5. Bahrain
- 5.3.6. Oman
- 5.4. Market Analysis, Insights and Forecast - by Region
- 5.4.1. Saudi Arabia
- 5.4.2. Kuwait
- 5.4.3. United Arab Emirates
- 5.4.4. Qatar
- 5.4.5. Bahrain
- 5.4.6. Oman
- 5.1. Market Analysis, Insights and Forecast - by Product Type
- 6. Saudi Arabia GCC PET Packaging Industry Analysis, Insights and Forecast, 2019-2031
- 6.1. Market Analysis, Insights and Forecast - by Product Type
- 6.1.1. Bottles
- 6.1.2. Films and Sheets
- 6.1.3. Household Containers
- 6.1.4. Other Product Types
- 6.2. Market Analysis, Insights and Forecast - by End-user Industry
- 6.2.1. Food and Beverage
- 6.2.2. Automotive
- 6.2.3. Electrical and Electronics
- 6.2.4. Healthcare
- 6.2.5. Consumer Goods
- 6.2.6. Other End-user Industries
- 6.3. Market Analysis, Insights and Forecast - by Geography
- 6.3.1. Saudi Arabia
- 6.3.2. Kuwait
- 6.3.3. United Arab Emirates
- 6.3.4. Qatar
- 6.3.5. Bahrain
- 6.3.6. Oman
- 6.1. Market Analysis, Insights and Forecast - by Product Type
- 7. Kuwait GCC PET Packaging Industry Analysis, Insights and Forecast, 2019-2031
- 7.1. Market Analysis, Insights and Forecast - by Product Type
- 7.1.1. Bottles
- 7.1.2. Films and Sheets
- 7.1.3. Household Containers
- 7.1.4. Other Product Types
- 7.2. Market Analysis, Insights and Forecast - by End-user Industry
- 7.2.1. Food and Beverage
- 7.2.2. Automotive
- 7.2.3. Electrical and Electronics
- 7.2.4. Healthcare
- 7.2.5. Consumer Goods
- 7.2.6. Other End-user Industries
- 7.3. Market Analysis, Insights and Forecast - by Geography
- 7.3.1. Saudi Arabia
- 7.3.2. Kuwait
- 7.3.3. United Arab Emirates
- 7.3.4. Qatar
- 7.3.5. Bahrain
- 7.3.6. Oman
- 7.1. Market Analysis, Insights and Forecast - by Product Type
- 8. United Arab Emirates GCC PET Packaging Industry Analysis, Insights and Forecast, 2019-2031
- 8.1. Market Analysis, Insights and Forecast - by Product Type
- 8.1.1. Bottles
- 8.1.2. Films and Sheets
- 8.1.3. Household Containers
- 8.1.4. Other Product Types
- 8.2. Market Analysis, Insights and Forecast - by End-user Industry
- 8.2.1. Food and Beverage
- 8.2.2. Automotive
- 8.2.3. Electrical and Electronics
- 8.2.4. Healthcare
- 8.2.5. Consumer Goods
- 8.2.6. Other End-user Industries
- 8.3. Market Analysis, Insights and Forecast - by Geography
- 8.3.1. Saudi Arabia
- 8.3.2. Kuwait
- 8.3.3. United Arab Emirates
- 8.3.4. Qatar
- 8.3.5. Bahrain
- 8.3.6. Oman
- 8.1. Market Analysis, Insights and Forecast - by Product Type
- 9. Qatar GCC PET Packaging Industry Analysis, Insights and Forecast, 2019-2031
- 9.1. Market Analysis, Insights and Forecast - by Product Type
- 9.1.1. Bottles
- 9.1.2. Films and Sheets
- 9.1.3. Household Containers
- 9.1.4. Other Product Types
- 9.2. Market Analysis, Insights and Forecast - by End-user Industry
- 9.2.1. Food and Beverage
- 9.2.2. Automotive
- 9.2.3. Electrical and Electronics
- 9.2.4. Healthcare
- 9.2.5. Consumer Goods
- 9.2.6. Other End-user Industries
- 9.3. Market Analysis, Insights and Forecast - by Geography
- 9.3.1. Saudi Arabia
- 9.3.2. Kuwait
- 9.3.3. United Arab Emirates
- 9.3.4. Qatar
- 9.3.5. Bahrain
- 9.3.6. Oman
- 9.1. Market Analysis, Insights and Forecast - by Product Type
- 10. Bahrain GCC PET Packaging Industry Analysis, Insights and Forecast, 2019-2031
- 10.1. Market Analysis, Insights and Forecast - by Product Type
- 10.1.1. Bottles
- 10.1.2. Films and Sheets
- 10.1.3. Household Containers
- 10.1.4. Other Product Types
- 10.2. Market Analysis, Insights and Forecast - by End-user Industry
- 10.2.1. Food and Beverage
- 10.2.2. Automotive
- 10.2.3. Electrical and Electronics
- 10.2.4. Healthcare
- 10.2.5. Consumer Goods
- 10.2.6. Other End-user Industries
- 10.3. Market Analysis, Insights and Forecast - by Geography
- 10.3.1. Saudi Arabia
- 10.3.2. Kuwait
- 10.3.3. United Arab Emirates
- 10.3.4. Qatar
- 10.3.5. Bahrain
- 10.3.6. Oman
- 10.1. Market Analysis, Insights and Forecast - by Product Type
- 11. Oman GCC PET Packaging Industry Analysis, Insights and Forecast, 2019-2031
- 11.1. Market Analysis, Insights and Forecast - by Product Type
- 11.1.1. Bottles
- 11.1.2. Films and Sheets
- 11.1.3. Household Containers
- 11.1.4. Other Product Types
- 11.2. Market Analysis, Insights and Forecast - by End-user Industry
- 11.2.1. Food and Beverage
- 11.2.2. Automotive
- 11.2.3. Electrical and Electronics
- 11.2.4. Healthcare
- 11.2.5. Consumer Goods
- 11.2.6. Other End-user Industries
- 11.3. Market Analysis, Insights and Forecast - by Geography
- 11.3.1. Saudi Arabia
- 11.3.2. Kuwait
- 11.3.3. United Arab Emirates
- 11.3.4. Qatar
- 11.3.5. Bahrain
- 11.3.6. Oman
- 11.1. Market Analysis, Insights and Forecast - by Product Type
- 12. North America GCC PET Packaging Industry Analysis, Insights and Forecast, 2019-2031
- 12.1. Market Analysis, Insights and Forecast - By Country/Sub-region
- 12.1.1 United States
- 12.1.2 Canada
- 12.1.3 Mexico
- 13. Europe GCC PET Packaging Industry Analysis, Insights and Forecast, 2019-2031
- 13.1. Market Analysis, Insights and Forecast - By Country/Sub-region
- 13.1.1 Germany
- 13.1.2 United Kingdom
- 13.1.3 France
- 13.1.4 Spain
- 13.1.5 Italy
- 13.1.6 Spain
- 13.1.7 Belgium
- 13.1.8 Netherland
- 13.1.9 Nordics
- 13.1.10 Rest of Europe
- 14. Asia Pacific GCC PET Packaging Industry Analysis, Insights and Forecast, 2019-2031
- 14.1. Market Analysis, Insights and Forecast - By Country/Sub-region
- 14.1.1 China
- 14.1.2 Japan
- 14.1.3 India
- 14.1.4 South Korea
- 14.1.5 Southeast Asia
- 14.1.6 Australia
- 14.1.7 Indonesia
- 14.1.8 Phillipes
- 14.1.9 Singapore
- 14.1.10 Thailandc
- 14.1.11 Rest of Asia Pacific
- 15. South America GCC PET Packaging Industry Analysis, Insights and Forecast, 2019-2031
- 15.1. Market Analysis, Insights and Forecast - By Country/Sub-region
- 15.1.1 Brazil
- 15.1.2 Argentina
- 15.1.3 Peru
- 15.1.4 Chile
- 15.1.5 Colombia
- 15.1.6 Ecuador
- 15.1.7 Venezuela
- 15.1.8 Rest of South America
- 16. North America GCC PET Packaging Industry Analysis, Insights and Forecast, 2019-2031
- 16.1. Market Analysis, Insights and Forecast - By Country/Sub-region
- 16.1.1 United States
- 16.1.2 Canada
- 16.1.3 Mexico
- 17. MEA GCC PET Packaging Industry Analysis, Insights and Forecast, 2019-2031
- 17.1. Market Analysis, Insights and Forecast - By Country/Sub-region
- 17.1.1 United Arab Emirates
- 17.1.2 Saudi Arabia
- 17.1.3 South Africa
- 17.1.4 Rest of Middle East and Africa
- 18. Competitive Analysis
- 18.1. Global Market Share Analysis 2024
- 18.2. Company Profiles
- 18.2.1 SABIC
- 18.2.1.1. Overview
- 18.2.1.2. Products
- 18.2.1.3. SWOT Analysis
- 18.2.1.4. Recent Developments
- 18.2.1.5. Financials (Based on Availability)
- 18.2.2 BASF SE
- 18.2.2.1. Overview
- 18.2.2.2. Products
- 18.2.2.3. SWOT Analysis
- 18.2.2.4. Recent Developments
- 18.2.2.5. Financials (Based on Availability)
- 18.2.3 JBF RAK
- 18.2.3.1. Overview
- 18.2.3.2. Products
- 18.2.3.3. SWOT Analysis
- 18.2.3.4. Recent Developments
- 18.2.3.5. Financials (Based on Availability)
- 18.2.4 OCTAL
- 18.2.4.1. Overview
- 18.2.4.2. Products
- 18.2.4.3. SWOT Analysis
- 18.2.4.4. Recent Developments
- 18.2.4.5. Financials (Based on Availability)
- 18.2.5 Pan-Asia Saudi Co Ltd
- 18.2.5.1. Overview
- 18.2.5.2. Products
- 18.2.5.3. SWOT Analysis
- 18.2.5.4. Recent Developments
- 18.2.5.5. Financials (Based on Availability)
- 18.2.1 SABIC
List of Figures
- Figure 1: Global GCC PET Packaging Industry Revenue Breakdown (Million, %) by Region 2024 & 2032
- Figure 2: Global GCC PET Packaging Industry Volume Breakdown (K Unit, %) by Region 2024 & 2032
- Figure 3: North America GCC PET Packaging Industry Revenue (Million), by Country 2024 & 2032
- Figure 4: North America GCC PET Packaging Industry Volume (K Unit), by Country 2024 & 2032
- Figure 5: North America GCC PET Packaging Industry Revenue Share (%), by Country 2024 & 2032
- Figure 6: North America GCC PET Packaging Industry Volume Share (%), by Country 2024 & 2032
- Figure 7: Europe GCC PET Packaging Industry Revenue (Million), by Country 2024 & 2032
- Figure 8: Europe GCC PET Packaging Industry Volume (K Unit), by Country 2024 & 2032
- Figure 9: Europe GCC PET Packaging Industry Revenue Share (%), by Country 2024 & 2032
- Figure 10: Europe GCC PET Packaging Industry Volume Share (%), by Country 2024 & 2032
- Figure 11: Asia Pacific GCC PET Packaging Industry Revenue (Million), by Country 2024 & 2032
- Figure 12: Asia Pacific GCC PET Packaging Industry Volume (K Unit), by Country 2024 & 2032
- Figure 13: Asia Pacific GCC PET Packaging Industry Revenue Share (%), by Country 2024 & 2032
- Figure 14: Asia Pacific GCC PET Packaging Industry Volume Share (%), by Country 2024 & 2032
- Figure 15: South America GCC PET Packaging Industry Revenue (Million), by Country 2024 & 2032
- Figure 16: South America GCC PET Packaging Industry Volume (K Unit), by Country 2024 & 2032
- Figure 17: South America GCC PET Packaging Industry Revenue Share (%), by Country 2024 & 2032
- Figure 18: South America GCC PET Packaging Industry Volume Share (%), by Country 2024 & 2032
- Figure 19: North America GCC PET Packaging Industry Revenue (Million), by Country 2024 & 2032
- Figure 20: North America GCC PET Packaging Industry Volume (K Unit), by Country 2024 & 2032
- Figure 21: North America GCC PET Packaging Industry Revenue Share (%), by Country 2024 & 2032
- Figure 22: North America GCC PET Packaging Industry Volume Share (%), by Country 2024 & 2032
- Figure 23: MEA GCC PET Packaging Industry Revenue (Million), by Country 2024 & 2032
- Figure 24: MEA GCC PET Packaging Industry Volume (K Unit), by Country 2024 & 2032
- Figure 25: MEA GCC PET Packaging Industry Revenue Share (%), by Country 2024 & 2032
- Figure 26: MEA GCC PET Packaging Industry Volume Share (%), by Country 2024 & 2032
- Figure 27: Saudi Arabia GCC PET Packaging Industry Revenue (Million), by Product Type 2024 & 2032
- Figure 28: Saudi Arabia GCC PET Packaging Industry Volume (K Unit), by Product Type 2024 & 2032
- Figure 29: Saudi Arabia GCC PET Packaging Industry Revenue Share (%), by Product Type 2024 & 2032
- Figure 30: Saudi Arabia GCC PET Packaging Industry Volume Share (%), by Product Type 2024 & 2032
- Figure 31: Saudi Arabia GCC PET Packaging Industry Revenue (Million), by End-user Industry 2024 & 2032
- Figure 32: Saudi Arabia GCC PET Packaging Industry Volume (K Unit), by End-user Industry 2024 & 2032
- Figure 33: Saudi Arabia GCC PET Packaging Industry Revenue Share (%), by End-user Industry 2024 & 2032
- Figure 34: Saudi Arabia GCC PET Packaging Industry Volume Share (%), by End-user Industry 2024 & 2032
- Figure 35: Saudi Arabia GCC PET Packaging Industry Revenue (Million), by Geography 2024 & 2032
- Figure 36: Saudi Arabia GCC PET Packaging Industry Volume (K Unit), by Geography 2024 & 2032
- Figure 37: Saudi Arabia GCC PET Packaging Industry Revenue Share (%), by Geography 2024 & 2032
- Figure 38: Saudi Arabia GCC PET Packaging Industry Volume Share (%), by Geography 2024 & 2032
- Figure 39: Saudi Arabia GCC PET Packaging Industry Revenue (Million), by Country 2024 & 2032
- Figure 40: Saudi Arabia GCC PET Packaging Industry Volume (K Unit), by Country 2024 & 2032
- Figure 41: Saudi Arabia GCC PET Packaging Industry Revenue Share (%), by Country 2024 & 2032
- Figure 42: Saudi Arabia GCC PET Packaging Industry Volume Share (%), by Country 2024 & 2032
- Figure 43: Kuwait GCC PET Packaging Industry Revenue (Million), by Product Type 2024 & 2032
- Figure 44: Kuwait GCC PET Packaging Industry Volume (K Unit), by Product Type 2024 & 2032
- Figure 45: Kuwait GCC PET Packaging Industry Revenue Share (%), by Product Type 2024 & 2032
- Figure 46: Kuwait GCC PET Packaging Industry Volume Share (%), by Product Type 2024 & 2032
- Figure 47: Kuwait GCC PET Packaging Industry Revenue (Million), by End-user Industry 2024 & 2032
- Figure 48: Kuwait GCC PET Packaging Industry Volume (K Unit), by End-user Industry 2024 & 2032
- Figure 49: Kuwait GCC PET Packaging Industry Revenue Share (%), by End-user Industry 2024 & 2032
- Figure 50: Kuwait GCC PET Packaging Industry Volume Share (%), by End-user Industry 2024 & 2032
- Figure 51: Kuwait GCC PET Packaging Industry Revenue (Million), by Geography 2024 & 2032
- Figure 52: Kuwait GCC PET Packaging Industry Volume (K Unit), by Geography 2024 & 2032
- Figure 53: Kuwait GCC PET Packaging Industry Revenue Share (%), by Geography 2024 & 2032
- Figure 54: Kuwait GCC PET Packaging Industry Volume Share (%), by Geography 2024 & 2032
- Figure 55: Kuwait GCC PET Packaging Industry Revenue (Million), by Country 2024 & 2032
- Figure 56: Kuwait GCC PET Packaging Industry Volume (K Unit), by Country 2024 & 2032
- Figure 57: Kuwait GCC PET Packaging Industry Revenue Share (%), by Country 2024 & 2032
- Figure 58: Kuwait GCC PET Packaging Industry Volume Share (%), by Country 2024 & 2032
- Figure 59: United Arab Emirates GCC PET Packaging Industry Revenue (Million), by Product Type 2024 & 2032
- Figure 60: United Arab Emirates GCC PET Packaging Industry Volume (K Unit), by Product Type 2024 & 2032
- Figure 61: United Arab Emirates GCC PET Packaging Industry Revenue Share (%), by Product Type 2024 & 2032
- Figure 62: United Arab Emirates GCC PET Packaging Industry Volume Share (%), by Product Type 2024 & 2032
- Figure 63: United Arab Emirates GCC PET Packaging Industry Revenue (Million), by End-user Industry 2024 & 2032
- Figure 64: United Arab Emirates GCC PET Packaging Industry Volume (K Unit), by End-user Industry 2024 & 2032
- Figure 65: United Arab Emirates GCC PET Packaging Industry Revenue Share (%), by End-user Industry 2024 & 2032
- Figure 66: United Arab Emirates GCC PET Packaging Industry Volume Share (%), by End-user Industry 2024 & 2032
- Figure 67: United Arab Emirates GCC PET Packaging Industry Revenue (Million), by Geography 2024 & 2032
- Figure 68: United Arab Emirates GCC PET Packaging Industry Volume (K Unit), by Geography 2024 & 2032
- Figure 69: United Arab Emirates GCC PET Packaging Industry Revenue Share (%), by Geography 2024 & 2032
- Figure 70: United Arab Emirates GCC PET Packaging Industry Volume Share (%), by Geography 2024 & 2032
- Figure 71: United Arab Emirates GCC PET Packaging Industry Revenue (Million), by Country 2024 & 2032
- Figure 72: United Arab Emirates GCC PET Packaging Industry Volume (K Unit), by Country 2024 & 2032
- Figure 73: United Arab Emirates GCC PET Packaging Industry Revenue Share (%), by Country 2024 & 2032
- Figure 74: United Arab Emirates GCC PET Packaging Industry Volume Share (%), by Country 2024 & 2032
- Figure 75: Qatar GCC PET Packaging Industry Revenue (Million), by Product Type 2024 & 2032
- Figure 76: Qatar GCC PET Packaging Industry Volume (K Unit), by Product Type 2024 & 2032
- Figure 77: Qatar GCC PET Packaging Industry Revenue Share (%), by Product Type 2024 & 2032
- Figure 78: Qatar GCC PET Packaging Industry Volume Share (%), by Product Type 2024 & 2032
- Figure 79: Qatar GCC PET Packaging Industry Revenue (Million), by End-user Industry 2024 & 2032
- Figure 80: Qatar GCC PET Packaging Industry Volume (K Unit), by End-user Industry 2024 & 2032
- Figure 81: Qatar GCC PET Packaging Industry Revenue Share (%), by End-user Industry 2024 & 2032
- Figure 82: Qatar GCC PET Packaging Industry Volume Share (%), by End-user Industry 2024 & 2032
- Figure 83: Qatar GCC PET Packaging Industry Revenue (Million), by Geography 2024 & 2032
- Figure 84: Qatar GCC PET Packaging Industry Volume (K Unit), by Geography 2024 & 2032
- Figure 85: Qatar GCC PET Packaging Industry Revenue Share (%), by Geography 2024 & 2032
- Figure 86: Qatar GCC PET Packaging Industry Volume Share (%), by Geography 2024 & 2032
- Figure 87: Qatar GCC PET Packaging Industry Revenue (Million), by Country 2024 & 2032
- Figure 88: Qatar GCC PET Packaging Industry Volume (K Unit), by Country 2024 & 2032
- Figure 89: Qatar GCC PET Packaging Industry Revenue Share (%), by Country 2024 & 2032
- Figure 90: Qatar GCC PET Packaging Industry Volume Share (%), by Country 2024 & 2032
- Figure 91: Bahrain GCC PET Packaging Industry Revenue (Million), by Product Type 2024 & 2032
- Figure 92: Bahrain GCC PET Packaging Industry Volume (K Unit), by Product Type 2024 & 2032
- Figure 93: Bahrain GCC PET Packaging Industry Revenue Share (%), by Product Type 2024 & 2032
- Figure 94: Bahrain GCC PET Packaging Industry Volume Share (%), by Product Type 2024 & 2032
- Figure 95: Bahrain GCC PET Packaging Industry Revenue (Million), by End-user Industry 2024 & 2032
- Figure 96: Bahrain GCC PET Packaging Industry Volume (K Unit), by End-user Industry 2024 & 2032
- Figure 97: Bahrain GCC PET Packaging Industry Revenue Share (%), by End-user Industry 2024 & 2032
- Figure 98: Bahrain GCC PET Packaging Industry Volume Share (%), by End-user Industry 2024 & 2032
- Figure 99: Bahrain GCC PET Packaging Industry Revenue (Million), by Geography 2024 & 2032
- Figure 100: Bahrain GCC PET Packaging Industry Volume (K Unit), by Geography 2024 & 2032
- Figure 101: Bahrain GCC PET Packaging Industry Revenue Share (%), by Geography 2024 & 2032
- Figure 102: Bahrain GCC PET Packaging Industry Volume Share (%), by Geography 2024 & 2032
- Figure 103: Bahrain GCC PET Packaging Industry Revenue (Million), by Country 2024 & 2032
- Figure 104: Bahrain GCC PET Packaging Industry Volume (K Unit), by Country 2024 & 2032
- Figure 105: Bahrain GCC PET Packaging Industry Revenue Share (%), by Country 2024 & 2032
- Figure 106: Bahrain GCC PET Packaging Industry Volume Share (%), by Country 2024 & 2032
- Figure 107: Oman GCC PET Packaging Industry Revenue (Million), by Product Type 2024 & 2032
- Figure 108: Oman GCC PET Packaging Industry Volume (K Unit), by Product Type 2024 & 2032
- Figure 109: Oman GCC PET Packaging Industry Revenue Share (%), by Product Type 2024 & 2032
- Figure 110: Oman GCC PET Packaging Industry Volume Share (%), by Product Type 2024 & 2032
- Figure 111: Oman GCC PET Packaging Industry Revenue (Million), by End-user Industry 2024 & 2032
- Figure 112: Oman GCC PET Packaging Industry Volume (K Unit), by End-user Industry 2024 & 2032
- Figure 113: Oman GCC PET Packaging Industry Revenue Share (%), by End-user Industry 2024 & 2032
- Figure 114: Oman GCC PET Packaging Industry Volume Share (%), by End-user Industry 2024 & 2032
- Figure 115: Oman GCC PET Packaging Industry Revenue (Million), by Geography 2024 & 2032
- Figure 116: Oman GCC PET Packaging Industry Volume (K Unit), by Geography 2024 & 2032
- Figure 117: Oman GCC PET Packaging Industry Revenue Share (%), by Geography 2024 & 2032
- Figure 118: Oman GCC PET Packaging Industry Volume Share (%), by Geography 2024 & 2032
- Figure 119: Oman GCC PET Packaging Industry Revenue (Million), by Country 2024 & 2032
- Figure 120: Oman GCC PET Packaging Industry Volume (K Unit), by Country 2024 & 2032
- Figure 121: Oman GCC PET Packaging Industry Revenue Share (%), by Country 2024 & 2032
- Figure 122: Oman GCC PET Packaging Industry Volume Share (%), by Country 2024 & 2032
List of Tables
- Table 1: Global GCC PET Packaging Industry Revenue Million Forecast, by Region 2019 & 2032
- Table 2: Global GCC PET Packaging Industry Volume K Unit Forecast, by Region 2019 & 2032
- Table 3: Global GCC PET Packaging Industry Revenue Million Forecast, by Product Type 2019 & 2032
- Table 4: Global GCC PET Packaging Industry Volume K Unit Forecast, by Product Type 2019 & 2032
- Table 5: Global GCC PET Packaging Industry Revenue Million Forecast, by End-user Industry 2019 & 2032
- Table 6: Global GCC PET Packaging Industry Volume K Unit Forecast, by End-user Industry 2019 & 2032
- Table 7: Global GCC PET Packaging Industry Revenue Million Forecast, by Geography 2019 & 2032
- Table 8: Global GCC PET Packaging Industry Volume K Unit Forecast, by Geography 2019 & 2032
- Table 9: Global GCC PET Packaging Industry Revenue Million Forecast, by Region 2019 & 2032
- Table 10: Global GCC PET Packaging Industry Volume K Unit Forecast, by Region 2019 & 2032
- Table 11: Global GCC PET Packaging Industry Revenue Million Forecast, by Country 2019 & 2032
- Table 12: Global GCC PET Packaging Industry Volume K Unit Forecast, by Country 2019 & 2032
- Table 13: United States GCC PET Packaging Industry Revenue (Million) Forecast, by Application 2019 & 2032
- Table 14: United States GCC PET Packaging Industry Volume (K Unit) Forecast, by Application 2019 & 2032
- Table 15: Canada GCC PET Packaging Industry Revenue (Million) Forecast, by Application 2019 & 2032
- Table 16: Canada GCC PET Packaging Industry Volume (K Unit) Forecast, by Application 2019 & 2032
- Table 17: Mexico GCC PET Packaging Industry Revenue (Million) Forecast, by Application 2019 & 2032
- Table 18: Mexico GCC PET Packaging Industry Volume (K Unit) Forecast, by Application 2019 & 2032
- Table 19: Global GCC PET Packaging Industry Revenue Million Forecast, by Country 2019 & 2032
- Table 20: Global GCC PET Packaging Industry Volume K Unit Forecast, by Country 2019 & 2032
- Table 21: Germany GCC PET Packaging Industry Revenue (Million) Forecast, by Application 2019 & 2032
- Table 22: Germany GCC PET Packaging Industry Volume (K Unit) Forecast, by Application 2019 & 2032
- Table 23: United Kingdom GCC PET Packaging Industry Revenue (Million) Forecast, by Application 2019 & 2032
- Table 24: United Kingdom GCC PET Packaging Industry Volume (K Unit) Forecast, by Application 2019 & 2032
- Table 25: France GCC PET Packaging Industry Revenue (Million) Forecast, by Application 2019 & 2032
- Table 26: France GCC PET Packaging Industry Volume (K Unit) Forecast, by Application 2019 & 2032
- Table 27: Spain GCC PET Packaging Industry Revenue (Million) Forecast, by Application 2019 & 2032
- Table 28: Spain GCC PET Packaging Industry Volume (K Unit) Forecast, by Application 2019 & 2032
- Table 29: Italy GCC PET Packaging Industry Revenue (Million) Forecast, by Application 2019 & 2032
- Table 30: Italy GCC PET Packaging Industry Volume (K Unit) Forecast, by Application 2019 & 2032
- Table 31: Spain GCC PET Packaging Industry Revenue (Million) Forecast, by Application 2019 & 2032
- Table 32: Spain GCC PET Packaging Industry Volume (K Unit) Forecast, by Application 2019 & 2032
- Table 33: Belgium GCC PET Packaging Industry Revenue (Million) Forecast, by Application 2019 & 2032
- Table 34: Belgium GCC PET Packaging Industry Volume (K Unit) Forecast, by Application 2019 & 2032
- Table 35: Netherland GCC PET Packaging Industry Revenue (Million) Forecast, by Application 2019 & 2032
- Table 36: Netherland GCC PET Packaging Industry Volume (K Unit) Forecast, by Application 2019 & 2032
- Table 37: Nordics GCC PET Packaging Industry Revenue (Million) Forecast, by Application 2019 & 2032
- Table 38: Nordics GCC PET Packaging Industry Volume (K Unit) Forecast, by Application 2019 & 2032
- Table 39: Rest of Europe GCC PET Packaging Industry Revenue (Million) Forecast, by Application 2019 & 2032
- Table 40: Rest of Europe GCC PET Packaging Industry Volume (K Unit) Forecast, by Application 2019 & 2032
- Table 41: Global GCC PET Packaging Industry Revenue Million Forecast, by Country 2019 & 2032
- Table 42: Global GCC PET Packaging Industry Volume K Unit Forecast, by Country 2019 & 2032
- Table 43: China GCC PET Packaging Industry Revenue (Million) Forecast, by Application 2019 & 2032
- Table 44: China GCC PET Packaging Industry Volume (K Unit) Forecast, by Application 2019 & 2032
- Table 45: Japan GCC PET Packaging Industry Revenue (Million) Forecast, by Application 2019 & 2032
- Table 46: Japan GCC PET Packaging Industry Volume (K Unit) Forecast, by Application 2019 & 2032
- Table 47: India GCC PET Packaging Industry Revenue (Million) Forecast, by Application 2019 & 2032
- Table 48: India GCC PET Packaging Industry Volume (K Unit) Forecast, by Application 2019 & 2032
- Table 49: South Korea GCC PET Packaging Industry Revenue (Million) Forecast, by Application 2019 & 2032
- Table 50: South Korea GCC PET Packaging Industry Volume (K Unit) Forecast, by Application 2019 & 2032
- Table 51: Southeast Asia GCC PET Packaging Industry Revenue (Million) Forecast, by Application 2019 & 2032
- Table 52: Southeast Asia GCC PET Packaging Industry Volume (K Unit) Forecast, by Application 2019 & 2032
- Table 53: Australia GCC PET Packaging Industry Revenue (Million) Forecast, by Application 2019 & 2032
- Table 54: Australia GCC PET Packaging Industry Volume (K Unit) Forecast, by Application 2019 & 2032
- Table 55: Indonesia GCC PET Packaging Industry Revenue (Million) Forecast, by Application 2019 & 2032
- Table 56: Indonesia GCC PET Packaging Industry Volume (K Unit) Forecast, by Application 2019 & 2032
- Table 57: Phillipes GCC PET Packaging Industry Revenue (Million) Forecast, by Application 2019 & 2032
- Table 58: Phillipes GCC PET Packaging Industry Volume (K Unit) Forecast, by Application 2019 & 2032
- Table 59: Singapore GCC PET Packaging Industry Revenue (Million) Forecast, by Application 2019 & 2032
- Table 60: Singapore GCC PET Packaging Industry Volume (K Unit) Forecast, by Application 2019 & 2032
- Table 61: Thailandc GCC PET Packaging Industry Revenue (Million) Forecast, by Application 2019 & 2032
- Table 62: Thailandc GCC PET Packaging Industry Volume (K Unit) Forecast, by Application 2019 & 2032
- Table 63: Rest of Asia Pacific GCC PET Packaging Industry Revenue (Million) Forecast, by Application 2019 & 2032
- Table 64: Rest of Asia Pacific GCC PET Packaging Industry Volume (K Unit) Forecast, by Application 2019 & 2032
- Table 65: Global GCC PET Packaging Industry Revenue Million Forecast, by Country 2019 & 2032
- Table 66: Global GCC PET Packaging Industry Volume K Unit Forecast, by Country 2019 & 2032
- Table 67: Brazil GCC PET Packaging Industry Revenue (Million) Forecast, by Application 2019 & 2032
- Table 68: Brazil GCC PET Packaging Industry Volume (K Unit) Forecast, by Application 2019 & 2032
- Table 69: Argentina GCC PET Packaging Industry Revenue (Million) Forecast, by Application 2019 & 2032
- Table 70: Argentina GCC PET Packaging Industry Volume (K Unit) Forecast, by Application 2019 & 2032
- Table 71: Peru GCC PET Packaging Industry Revenue (Million) Forecast, by Application 2019 & 2032
- Table 72: Peru GCC PET Packaging Industry Volume (K Unit) Forecast, by Application 2019 & 2032
- Table 73: Chile GCC PET Packaging Industry Revenue (Million) Forecast, by Application 2019 & 2032
- Table 74: Chile GCC PET Packaging Industry Volume (K Unit) Forecast, by Application 2019 & 2032
- Table 75: Colombia GCC PET Packaging Industry Revenue (Million) Forecast, by Application 2019 & 2032
- Table 76: Colombia GCC PET Packaging Industry Volume (K Unit) Forecast, by Application 2019 & 2032
- Table 77: Ecuador GCC PET Packaging Industry Revenue (Million) Forecast, by Application 2019 & 2032
- Table 78: Ecuador GCC PET Packaging Industry Volume (K Unit) Forecast, by Application 2019 & 2032
- Table 79: Venezuela GCC PET Packaging Industry Revenue (Million) Forecast, by Application 2019 & 2032
- Table 80: Venezuela GCC PET Packaging Industry Volume (K Unit) Forecast, by Application 2019 & 2032
- Table 81: Rest of South America GCC PET Packaging Industry Revenue (Million) Forecast, by Application 2019 & 2032
- Table 82: Rest of South America GCC PET Packaging Industry Volume (K Unit) Forecast, by Application 2019 & 2032
- Table 83: Global GCC PET Packaging Industry Revenue Million Forecast, by Country 2019 & 2032
- Table 84: Global GCC PET Packaging Industry Volume K Unit Forecast, by Country 2019 & 2032
- Table 85: United States GCC PET Packaging Industry Revenue (Million) Forecast, by Application 2019 & 2032
- Table 86: United States GCC PET Packaging Industry Volume (K Unit) Forecast, by Application 2019 & 2032
- Table 87: Canada GCC PET Packaging Industry Revenue (Million) Forecast, by Application 2019 & 2032
- Table 88: Canada GCC PET Packaging Industry Volume (K Unit) Forecast, by Application 2019 & 2032
- Table 89: Mexico GCC PET Packaging Industry Revenue (Million) Forecast, by Application 2019 & 2032
- Table 90: Mexico GCC PET Packaging Industry Volume (K Unit) Forecast, by Application 2019 & 2032
- Table 91: Global GCC PET Packaging Industry Revenue Million Forecast, by Country 2019 & 2032
- Table 92: Global GCC PET Packaging Industry Volume K Unit Forecast, by Country 2019 & 2032
- Table 93: United Arab Emirates GCC PET Packaging Industry Revenue (Million) Forecast, by Application 2019 & 2032
- Table 94: United Arab Emirates GCC PET Packaging Industry Volume (K Unit) Forecast, by Application 2019 & 2032
- Table 95: Saudi Arabia GCC PET Packaging Industry Revenue (Million) Forecast, by Application 2019 & 2032
- Table 96: Saudi Arabia GCC PET Packaging Industry Volume (K Unit) Forecast, by Application 2019 & 2032
- Table 97: South Africa GCC PET Packaging Industry Revenue (Million) Forecast, by Application 2019 & 2032
- Table 98: South Africa GCC PET Packaging Industry Volume (K Unit) Forecast, by Application 2019 & 2032
- Table 99: Rest of Middle East and Africa GCC PET Packaging Industry Revenue (Million) Forecast, by Application 2019 & 2032
- Table 100: Rest of Middle East and Africa GCC PET Packaging Industry Volume (K Unit) Forecast, by Application 2019 & 2032
- Table 101: Global GCC PET Packaging Industry Revenue Million Forecast, by Product Type 2019 & 2032
- Table 102: Global GCC PET Packaging Industry Volume K Unit Forecast, by Product Type 2019 & 2032
- Table 103: Global GCC PET Packaging Industry Revenue Million Forecast, by End-user Industry 2019 & 2032
- Table 104: Global GCC PET Packaging Industry Volume K Unit Forecast, by End-user Industry 2019 & 2032
- Table 105: Global GCC PET Packaging Industry Revenue Million Forecast, by Geography 2019 & 2032
- Table 106: Global GCC PET Packaging Industry Volume K Unit Forecast, by Geography 2019 & 2032
- Table 107: Global GCC PET Packaging Industry Revenue Million Forecast, by Country 2019 & 2032
- Table 108: Global GCC PET Packaging Industry Volume K Unit Forecast, by Country 2019 & 2032
- Table 109: Global GCC PET Packaging Industry Revenue Million Forecast, by Product Type 2019 & 2032
- Table 110: Global GCC PET Packaging Industry Volume K Unit Forecast, by Product Type 2019 & 2032
- Table 111: Global GCC PET Packaging Industry Revenue Million Forecast, by End-user Industry 2019 & 2032
- Table 112: Global GCC PET Packaging Industry Volume K Unit Forecast, by End-user Industry 2019 & 2032
- Table 113: Global GCC PET Packaging Industry Revenue Million Forecast, by Geography 2019 & 2032
- Table 114: Global GCC PET Packaging Industry Volume K Unit Forecast, by Geography 2019 & 2032
- Table 115: Global GCC PET Packaging Industry Revenue Million Forecast, by Country 2019 & 2032
- Table 116: Global GCC PET Packaging Industry Volume K Unit Forecast, by Country 2019 & 2032
- Table 117: Global GCC PET Packaging Industry Revenue Million Forecast, by Product Type 2019 & 2032
- Table 118: Global GCC PET Packaging Industry Volume K Unit Forecast, by Product Type 2019 & 2032
- Table 119: Global GCC PET Packaging Industry Revenue Million Forecast, by End-user Industry 2019 & 2032
- Table 120: Global GCC PET Packaging Industry Volume K Unit Forecast, by End-user Industry 2019 & 2032
- Table 121: Global GCC PET Packaging Industry Revenue Million Forecast, by Geography 2019 & 2032
- Table 122: Global GCC PET Packaging Industry Volume K Unit Forecast, by Geography 2019 & 2032
- Table 123: Global GCC PET Packaging Industry Revenue Million Forecast, by Country 2019 & 2032
- Table 124: Global GCC PET Packaging Industry Volume K Unit Forecast, by Country 2019 & 2032
- Table 125: Global GCC PET Packaging Industry Revenue Million Forecast, by Product Type 2019 & 2032
- Table 126: Global GCC PET Packaging Industry Volume K Unit Forecast, by Product Type 2019 & 2032
- Table 127: Global GCC PET Packaging Industry Revenue Million Forecast, by End-user Industry 2019 & 2032
- Table 128: Global GCC PET Packaging Industry Volume K Unit Forecast, by End-user Industry 2019 & 2032
- Table 129: Global GCC PET Packaging Industry Revenue Million Forecast, by Geography 2019 & 2032
- Table 130: Global GCC PET Packaging Industry Volume K Unit Forecast, by Geography 2019 & 2032
- Table 131: Global GCC PET Packaging Industry Revenue Million Forecast, by Country 2019 & 2032
- Table 132: Global GCC PET Packaging Industry Volume K Unit Forecast, by Country 2019 & 2032
- Table 133: Global GCC PET Packaging Industry Revenue Million Forecast, by Product Type 2019 & 2032
- Table 134: Global GCC PET Packaging Industry Volume K Unit Forecast, by Product Type 2019 & 2032
- Table 135: Global GCC PET Packaging Industry Revenue Million Forecast, by End-user Industry 2019 & 2032
- Table 136: Global GCC PET Packaging Industry Volume K Unit Forecast, by End-user Industry 2019 & 2032
- Table 137: Global GCC PET Packaging Industry Revenue Million Forecast, by Geography 2019 & 2032
- Table 138: Global GCC PET Packaging Industry Volume K Unit Forecast, by Geography 2019 & 2032
- Table 139: Global GCC PET Packaging Industry Revenue Million Forecast, by Country 2019 & 2032
- Table 140: Global GCC PET Packaging Industry Volume K Unit Forecast, by Country 2019 & 2032
- Table 141: Global GCC PET Packaging Industry Revenue Million Forecast, by Product Type 2019 & 2032
- Table 142: Global GCC PET Packaging Industry Volume K Unit Forecast, by Product Type 2019 & 2032
- Table 143: Global GCC PET Packaging Industry Revenue Million Forecast, by End-user Industry 2019 & 2032
- Table 144: Global GCC PET Packaging Industry Volume K Unit Forecast, by End-user Industry 2019 & 2032
- Table 145: Global GCC PET Packaging Industry Revenue Million Forecast, by Geography 2019 & 2032
- Table 146: Global GCC PET Packaging Industry Volume K Unit Forecast, by Geography 2019 & 2032
- Table 147: Global GCC PET Packaging Industry Revenue Million Forecast, by Country 2019 & 2032
- Table 148: Global GCC PET Packaging Industry Volume K Unit Forecast, by Country 2019 & 2032
Frequently Asked Questions
1. What is the projected Compound Annual Growth Rate (CAGR) of the GCC PET Packaging Industry?
The projected CAGR is approximately > 4.00%.
2. Which companies are prominent players in the GCC PET Packaging Industry?
Key companies in the market include SABIC, BASF SE, JBF RAK, OCTAL, Pan-Asia Saudi Co Ltd.
3. What are the main segments of the GCC PET Packaging Industry?
The market segments include Product Type, End-user Industry, Geography.
4. Can you provide details about the market size?
The market size is estimated to be USD XX Million as of 2022.
5. What are some drivers contributing to market growth?
; Increasing Emphasis on Recycling.
6. What are the notable trends driving market growth?
Soaring Demand from the Food and Beverage Industry.
7. Are there any restraints impacting market growth?
; Aquatic Toxicity Related to Ionic Liquid; Unfavorable Conditions Arising Due to COVID-19 Outbreak.
8. Can you provide examples of recent developments in the market?
N/A
9. What pricing options are available for accessing the report?
Pricing options include single-user, multi-user, and enterprise licenses priced at USD 4750, USD 5250, and USD 8750 respectively.
10. Is the market size provided in terms of value or volume?
The market size is provided in terms of value, measured in Million and volume, measured in K Unit.
11. Are there any specific market keywords associated with the report?
Yes, the market keyword associated with the report is "GCC PET Packaging Industry," which aids in identifying and referencing the specific market segment covered.
12. How do I determine which pricing option suits my needs best?
The pricing options vary based on user requirements and access needs. Individual users may opt for single-user licenses, while businesses requiring broader access may choose multi-user or enterprise licenses for cost-effective access to the report.
13. Are there any additional resources or data provided in the GCC PET Packaging Industry report?
While the report offers comprehensive insights, it's advisable to review the specific contents or supplementary materials provided to ascertain if additional resources or data are available.
14. How can I stay updated on further developments or reports in the GCC PET Packaging Industry?
To stay informed about further developments, trends, and reports in the GCC PET Packaging Industry, consider subscribing to industry newsletters, following relevant companies and organizations, or regularly checking reputable industry news sources and publications.
Methodology
Step 1 - Identification of Relevant Samples Size from Population Database


Step 2 - Approaches for Defining Global Market Size (Value, Volume* & Price*)

Note*: In applicable scenarios
Step 3 - Data Sources
Primary Research
- Web Analytics
- Survey Reports
- Research Institute
- Latest Research Reports
- Opinion Leaders
Secondary Research
- Annual Reports
- White Paper
- Latest Press Release
- Industry Association
- Paid Database
- Investor Presentations

Step 4 - Data Triangulation
Involves using different sources of information in order to increase the validity of a study
These sources are likely to be stakeholders in a program - participants, other researchers, program staff, other community members, and so on.
Then we put all data in single framework & apply various statistical tools to find out the dynamic on the market.
During the analysis stage, feedback from the stakeholder groups would be compared to determine areas of agreement as well as areas of divergence


