
Key Insights
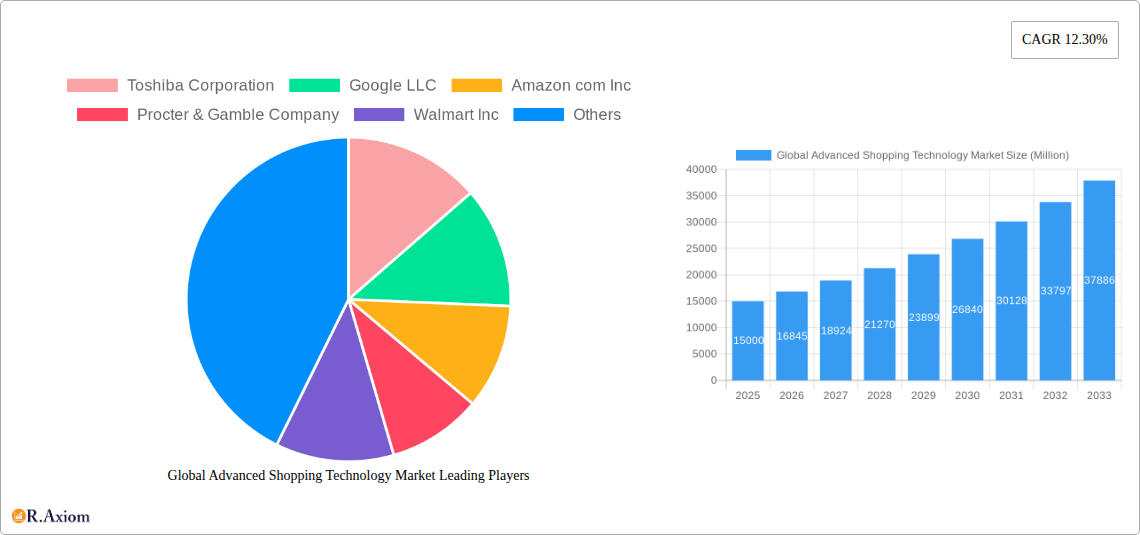
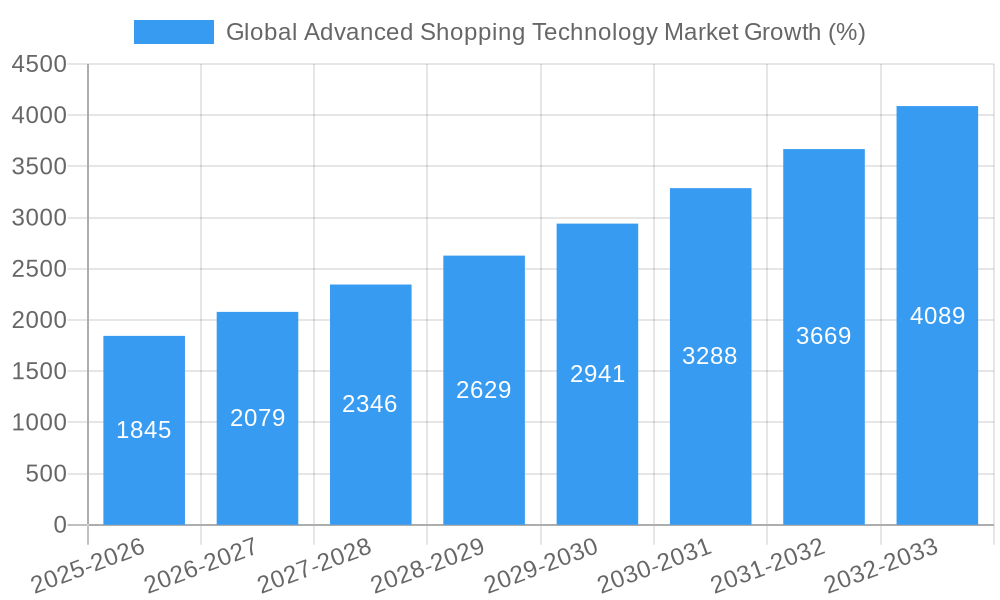
The global advanced shopping technology market is experiencing robust growth, projected to reach a significant size within the forecast period (2025-2033). A compound annual growth rate (CAGR) of 12.30% indicates substantial market expansion driven by several key factors. The increasing adoption of e-commerce and omnichannel strategies by retailers is a primary driver, fueling demand for technologies like beacons, virtual reality (VR) experiences, smart shelves, and retail apps that enhance the customer journey and drive sales. Furthermore, the growing popularity of social media marketing and showrooming tactics, allowing consumers to research products online before purchasing in-store or vice-versa, contribute to the market's expansion. Technological advancements in areas such as artificial intelligence (AI) and augmented reality (AR) are further enhancing the capabilities of these technologies, improving personalization and customer engagement. While data privacy concerns and the high initial investment costs associated with implementing some of these technologies pose potential restraints, the overall market outlook remains positive. Segment analysis reveals strong growth across retail and commercial advertising applications, with beacons and retail apps currently leading in terms of market share. North America and Asia-Pacific are expected to dominate the market due to high technological adoption rates and the presence of major technology companies and retail giants. This rapid evolution within the advanced shopping technology space highlights the continuous need for businesses to adapt and invest in innovative solutions to remain competitive in a dynamic market.
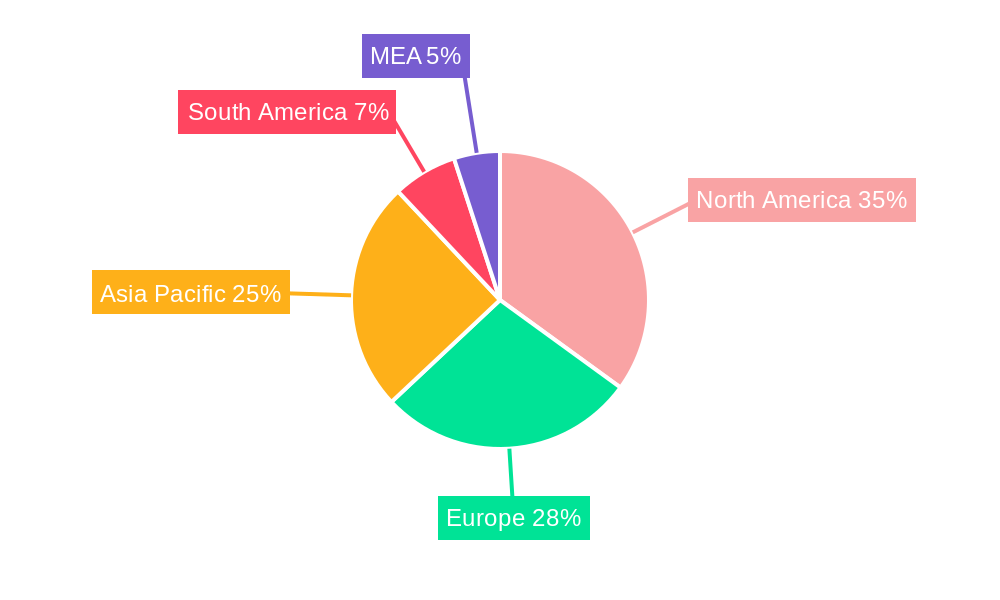
The geographical distribution of this market showcases a concentration of activity in developed economies, with North America and Europe holding significant market shares. However, rapidly developing economies in Asia-Pacific, particularly China and India, demonstrate significant growth potential due to expanding e-commerce infrastructure and a burgeoning middle class. Leading companies like Toshiba, Google, Amazon, Procter & Gamble, and Walmart are actively driving market innovation and adoption through strategic investments and the development of cutting-edge solutions. The competitive landscape is characterized by both established technology companies and retail giants vying for market dominance, fueling competition and driving further innovation. The continuous improvement in technology coupled with the growing integration of AI and data analytics offers immense potential for further market expansion, impacting everything from inventory management to personalized marketing strategies. This signifies that the market is poised for sustained growth, with substantial opportunities for stakeholders across the value chain.
Global Advanced Shopping Technology Market: A Comprehensive Report (2019-2033)
This in-depth report provides a comprehensive analysis of the Global Advanced Shopping Technology Market, covering market size, segmentation, growth drivers, challenges, opportunities, and key players. The study period spans from 2019 to 2033, with 2025 as the base and estimated year. The report leverages extensive primary and secondary research to deliver actionable insights for industry stakeholders. The market is segmented by product type (Beacons, Virtual Reality, Smart Shelves, Retail Apps, Social Media and Showrooming, Others) and application (Retail, Commercial Advertising, Others).
Global Advanced Shopping Technology Market Market Concentration & Innovation
This section analyzes the competitive landscape of the global advanced shopping technology market, exploring market concentration, innovation drivers, regulatory frameworks, product substitutes, end-user trends, and mergers and acquisitions (M&A) activities. The market is characterized by a moderate level of concentration, with a few dominant players and numerous smaller niche players. Market share data for key players such as Toshiba Corporation, Google LLC, Amazon.com Inc, Procter & Gamble Company, and Walmart Inc. will be presented, revealing the distribution of market power. The report will also delve into the M&A landscape, analyzing deal values and their impact on market consolidation. Innovation is a key driver, with ongoing advancements in areas such as artificial intelligence (AI), augmented reality (AR), and the Internet of Things (IoT). Regulatory frameworks, including data privacy regulations, significantly influence market development. The substitution of traditional shopping methods with advanced technologies is a major trend, impacting market dynamics. Finally, end-user preferences, such as the demand for personalized shopping experiences, are shaping the technological advancements and market growth. The analysis will include a detailed examination of these aspects, using quantitative data and qualitative insights to paint a complete picture.
Global Advanced Shopping Technology Market Industry Trends & Insights
This section provides an in-depth analysis of the key industry trends and insights shaping the global advanced shopping technology market. The market is experiencing robust growth, driven by factors such as increasing e-commerce penetration, rising consumer demand for personalized shopping experiences, and the rapid adoption of innovative technologies. The Compound Annual Growth Rate (CAGR) for the forecast period (2025-2033) is estimated at xx%, reflecting the significant growth potential. The market penetration of advanced shopping technologies is also increasing steadily, particularly in developed economies. Technological disruptions, such as the proliferation of AI-powered solutions and the rise of mobile commerce, are reshaping the competitive landscape and creating new opportunities for innovation. Consumer preferences are shifting towards seamless, omnichannel shopping experiences, and retailers are adapting their strategies to meet these changing demands. The competitive dynamics are characterized by intense competition among established players and the emergence of new entrants, driving innovation and price competition. Detailed analysis will be provided to illustrate the interplay of these factors and provide a comprehensive understanding of the industry's growth trajectory.
Dominant Markets & Segments in Global Advanced Shopping Technology Market
This section identifies the leading regions, countries, and segments within the global advanced shopping technology market. The analysis will pinpoint the dominant players and factors contributing to their success in these markets.
By Product Type:
- Retail Apps: High penetration in developed economies fueled by smartphone adoption and consumer preference for mobile shopping.
- Smart Shelves: Growing adoption in supermarkets and retail stores driven by inventory management and personalized offerings.
- Beacons: Maturing market, significant adoption in retail for targeted promotions and location-based services.
- Virtual Reality (VR): Emerging market with high potential, driven by advancements in technology and increasing consumer interest in immersive experiences.
- Social Media and Showrooming: Increasing influence of social media in purchase decisions and the shift towards online browsing with in-store purchase.
- Others: This segment includes other emerging technologies like AI-driven personalization engines and checkout kiosks.
By Application:
- Retail: The largest segment, driven by e-commerce growth and the need for enhanced customer experiences.
- Commercial Advertising: Growing segment with the increasing use of advanced technologies for targeted advertising.
- Others: Includes niche applications such as healthcare and hospitality.
North America is projected to maintain its position as the leading market throughout the forecast period, driven by high technology adoption rates and robust e-commerce infrastructure. Factors such as favorable economic policies, advanced technological infrastructure, and high disposable income levels significantly contribute to this dominance. However, the Asia-Pacific region is expected to witness significant growth, fueled by expanding e-commerce markets and increasing smartphone penetration.
Global Advanced Shopping Technology Market Product Developments
Recent years have witnessed significant product innovations, driving advancements in areas like augmented reality (AR) shopping experiences, AI-powered personalized recommendations, and frictionless checkout solutions. These innovations are enhancing the overall shopping experience, leading to increased customer engagement and satisfaction. The market is characterized by strong competition, with companies continuously striving to develop unique and innovative products and services. The success of these products hinges on their ability to effectively address consumer needs and provide a competitive advantage. Companies are leveraging technological advancements such as AI, machine learning, and big data analytics to develop sophisticated solutions that improve operational efficiency and enhance customer experiences.
Report Scope & Segmentation Analysis
This report provides a detailed segmentation of the global advanced shopping technology market by product type (Beacons, Virtual Reality, Smart Shelves, Retail Apps, Social Media and Showrooming, Others) and application (Retail, Commercial Advertising, Others). Each segment's growth projections, market size, and competitive dynamics are analyzed. The Retail segment dominates the application side, while Retail Apps and Smart Shelves are leading in the product segment. Market sizes for each segment are provided for the historical period (2019-2024), base year (2025), and forecast period (2025-2033), giving a comprehensive understanding of market evolution and future projections. The competitive landscape within each segment is assessed, identifying key players and their market strategies.
Key Drivers of Global Advanced Shopping Technology Market Growth
The growth of the global advanced shopping technology market is fueled by several key factors. Technological advancements, such as the development of AI-powered solutions and the increasing adoption of IoT devices, are driving innovation and creating new opportunities. The rising adoption of e-commerce and mobile shopping is also significantly contributing to market growth. Favorable economic conditions and increasing consumer spending further fuel the market's expansion. Government initiatives and supportive regulatory frameworks play a crucial role in stimulating market development. For example, investments in digital infrastructure and policies promoting e-commerce growth in developing economies are boosting market expansion.
Challenges in the Global Advanced Shopping Technology Market Sector
The global advanced shopping technology market faces several challenges, impacting its growth trajectory. Regulatory hurdles, including data privacy concerns and compliance requirements, can impede market expansion. Supply chain disruptions, particularly the impact of geopolitical instability, can affect the availability of components and increase costs. Intense competition among established players and the emergence of new entrants create pricing pressures and require constant innovation to maintain a competitive edge. Moreover, the security and privacy of consumer data remain a significant concern, requiring robust security measures to ensure customer trust and confidence. Addressing these challenges is critical to sustainable market growth.
Emerging Opportunities in Global Advanced Shopping Technology Market
Despite challenges, the global advanced shopping technology market presents several exciting opportunities. Emerging markets, particularly in developing economies with growing internet penetration and increasing smartphone adoption, represent significant growth potential. New technologies, such as extended reality (XR) and the metaverse, are creating opportunities for innovative shopping experiences. The growing demand for personalized shopping experiences and omnichannel solutions presents opportunities for businesses to differentiate themselves and enhance customer engagement. Moreover, the increasing focus on sustainability and responsible consumption creates opportunities for eco-friendly shopping technologies.
Leading Players in the Global Advanced Shopping Technology Market Market
- Toshiba Corporation
- Google LLC
- Amazon.com Inc
- Procter & Gamble Company
- Walmart Inc
Key Developments in Global Advanced Shopping Technology Market Industry
- June 2021: Toshiba's Self Checkout System 7 solution, developed by Toshiba Global Commerce Solutions and Calimax, launched, offering faster, more convenient checkout experiences. This enhanced customer experience boosted sales and customer satisfaction, enhancing the market’s competitiveness.
- July 2021: Toshiba Global Commerce Solutions partnered with Stor.ai, integrating its platform for grocers to build scalable online storefronts. This strategic alliance accelerated the adoption of digital commerce solutions within the grocery sector, impacting the market's growth trajectory.
Strategic Outlook for Global Advanced Shopping Technology Market Market
The global advanced shopping technology market is poised for significant growth in the coming years, driven by ongoing technological advancements, increasing consumer demand for personalized experiences, and the expansion of e-commerce. Companies focusing on innovation, strategic partnerships, and addressing evolving consumer preferences are well-positioned to capitalize on the market's growth potential. The market's future success hinges on continued investment in research and development, the development of robust security measures, and the adaptation to evolving regulatory frameworks. The focus on creating seamless, omnichannel experiences will be critical for companies seeking to achieve sustainable growth and maintain a competitive edge.
Global Advanced Shopping Technology Market Segmentation
-
1. Product Type
- 1.1. Beacons
- 1.2. Virtual Reality
- 1.3. Smart Shelves
- 1.4. Retail Apps
- 1.5. Social Media and Showrooming
- 1.6. Others
-
2. Application
- 2.1. Retail
- 2.2. Commercial Advertising
- 2.3. Others
Global Advanced Shopping Technology Market Segmentation By Geography
- 1. North America
- 2. Europe
- 3. Asia Pacific
- 4. Latin America
- 5. Middle East and Africa
Global Advanced Shopping Technology Market REPORT HIGHLIGHTS
| Aspects | Details |
|---|---|
| Study Period | 2019-2033 |
| Base Year | 2024 |
| Estimated Year | 2025 |
| Forecast Period | 2025-2033 |
| Historical Period | 2019-2024 |
| Growth Rate | CAGR of 12.30% from 2019-2033 |
| Segmentation |
|
Table of Contents
- 1. Introduction
- 1.1. Research Scope
- 1.2. Market Segmentation
- 1.3. Research Methodology
- 1.4. Definitions and Assumptions
- 2. Executive Summary
- 2.1. Introduction
- 3. Market Dynamics
- 3.1. Introduction
- 3.2. Market Drivers
- 3.2.1. Increasing adoption of advance technology in retail sector; Artificial intelligence and robots in retail stores
- 3.3. Market Restrains
- 3.3.1. High cost of implementation of the technology
- 3.4. Market Trends
- 3.4.1. Increasing Adoption of Virtual Reality in the Retail Sector is Expected to Drive the Market
- 4. Market Factor Analysis
- 4.1. Porters Five Forces
- 4.2. Supply/Value Chain
- 4.3. PESTEL analysis
- 4.4. Market Entropy
- 4.5. Patent/Trademark Analysis
- 5. Global Advanced Shopping Technology Market Analysis, Insights and Forecast, 2019-2031
- 5.1. Market Analysis, Insights and Forecast - by Product Type
- 5.1.1. Beacons
- 5.1.2. Virtual Reality
- 5.1.3. Smart Shelves
- 5.1.4. Retail Apps
- 5.1.5. Social Media and Showrooming
- 5.1.6. Others
- 5.2. Market Analysis, Insights and Forecast - by Application
- 5.2.1. Retail
- 5.2.2. Commercial Advertising
- 5.2.3. Others
- 5.3. Market Analysis, Insights and Forecast - by Region
- 5.3.1. North America
- 5.3.2. Europe
- 5.3.3. Asia Pacific
- 5.3.4. Latin America
- 5.3.5. Middle East and Africa
- 5.1. Market Analysis, Insights and Forecast - by Product Type
- 6. North America Global Advanced Shopping Technology Market Analysis, Insights and Forecast, 2019-2031
- 6.1. Market Analysis, Insights and Forecast - by Product Type
- 6.1.1. Beacons
- 6.1.2. Virtual Reality
- 6.1.3. Smart Shelves
- 6.1.4. Retail Apps
- 6.1.5. Social Media and Showrooming
- 6.1.6. Others
- 6.2. Market Analysis, Insights and Forecast - by Application
- 6.2.1. Retail
- 6.2.2. Commercial Advertising
- 6.2.3. Others
- 6.1. Market Analysis, Insights and Forecast - by Product Type
- 7. Europe Global Advanced Shopping Technology Market Analysis, Insights and Forecast, 2019-2031
- 7.1. Market Analysis, Insights and Forecast - by Product Type
- 7.1.1. Beacons
- 7.1.2. Virtual Reality
- 7.1.3. Smart Shelves
- 7.1.4. Retail Apps
- 7.1.5. Social Media and Showrooming
- 7.1.6. Others
- 7.2. Market Analysis, Insights and Forecast - by Application
- 7.2.1. Retail
- 7.2.2. Commercial Advertising
- 7.2.3. Others
- 7.1. Market Analysis, Insights and Forecast - by Product Type
- 8. Asia Pacific Global Advanced Shopping Technology Market Analysis, Insights and Forecast, 2019-2031
- 8.1. Market Analysis, Insights and Forecast - by Product Type
- 8.1.1. Beacons
- 8.1.2. Virtual Reality
- 8.1.3. Smart Shelves
- 8.1.4. Retail Apps
- 8.1.5. Social Media and Showrooming
- 8.1.6. Others
- 8.2. Market Analysis, Insights and Forecast - by Application
- 8.2.1. Retail
- 8.2.2. Commercial Advertising
- 8.2.3. Others
- 8.1. Market Analysis, Insights and Forecast - by Product Type
- 9. Latin America Global Advanced Shopping Technology Market Analysis, Insights and Forecast, 2019-2031
- 9.1. Market Analysis, Insights and Forecast - by Product Type
- 9.1.1. Beacons
- 9.1.2. Virtual Reality
- 9.1.3. Smart Shelves
- 9.1.4. Retail Apps
- 9.1.5. Social Media and Showrooming
- 9.1.6. Others
- 9.2. Market Analysis, Insights and Forecast - by Application
- 9.2.1. Retail
- 9.2.2. Commercial Advertising
- 9.2.3. Others
- 9.1. Market Analysis, Insights and Forecast - by Product Type
- 10. Middle East and Africa Global Advanced Shopping Technology Market Analysis, Insights and Forecast, 2019-2031
- 10.1. Market Analysis, Insights and Forecast - by Product Type
- 10.1.1. Beacons
- 10.1.2. Virtual Reality
- 10.1.3. Smart Shelves
- 10.1.4. Retail Apps
- 10.1.5. Social Media and Showrooming
- 10.1.6. Others
- 10.2. Market Analysis, Insights and Forecast - by Application
- 10.2.1. Retail
- 10.2.2. Commercial Advertising
- 10.2.3. Others
- 10.1. Market Analysis, Insights and Forecast - by Product Type
- 11. North America Global Advanced Shopping Technology Market Analysis, Insights and Forecast, 2019-2031
- 11.1. Market Analysis, Insights and Forecast - By Country/Sub-region
- 11.1.1 United States
- 11.1.2 Canada
- 11.1.3 Mexico
- 12. Europe Global Advanced Shopping Technology Market Analysis, Insights and Forecast, 2019-2031
- 12.1. Market Analysis, Insights and Forecast - By Country/Sub-region
- 12.1.1 Germany
- 12.1.2 United Kingdom
- 12.1.3 France
- 12.1.4 Spain
- 12.1.5 Italy
- 12.1.6 Spain
- 12.1.7 Belgium
- 12.1.8 Netherland
- 12.1.9 Nordics
- 12.1.10 Rest of Europe
- 13. Asia Pacific Global Advanced Shopping Technology Market Analysis, Insights and Forecast, 2019-2031
- 13.1. Market Analysis, Insights and Forecast - By Country/Sub-region
- 13.1.1 China
- 13.1.2 Japan
- 13.1.3 India
- 13.1.4 South Korea
- 13.1.5 Southeast Asia
- 13.1.6 Australia
- 13.1.7 Indonesia
- 13.1.8 Phillipes
- 13.1.9 Singapore
- 13.1.10 Thailandc
- 13.1.11 Rest of Asia Pacific
- 14. South America Global Advanced Shopping Technology Market Analysis, Insights and Forecast, 2019-2031
- 14.1. Market Analysis, Insights and Forecast - By Country/Sub-region
- 14.1.1 Brazil
- 14.1.2 Argentina
- 14.1.3 Peru
- 14.1.4 Chile
- 14.1.5 Colombia
- 14.1.6 Ecuador
- 14.1.7 Venezuela
- 14.1.8 Rest of South America
- 15. North America Global Advanced Shopping Technology Market Analysis, Insights and Forecast, 2019-2031
- 15.1. Market Analysis, Insights and Forecast - By Country/Sub-region
- 15.1.1 United States
- 15.1.2 Canada
- 15.1.3 Mexico
- 16. MEA Global Advanced Shopping Technology Market Analysis, Insights and Forecast, 2019-2031
- 16.1. Market Analysis, Insights and Forecast - By Country/Sub-region
- 16.1.1 United Arab Emirates
- 16.1.2 Saudi Arabia
- 16.1.3 South Africa
- 16.1.4 Rest of Middle East and Africa
- 17. Competitive Analysis
- 17.1. Market Share Analysis 2024
- 17.2. Company Profiles
- 17.2.1 Toshiba Corporation
- 17.2.1.1. Overview
- 17.2.1.2. Products
- 17.2.1.3. SWOT Analysis
- 17.2.1.4. Recent Developments
- 17.2.1.5. Financials (Based on Availability)
- 17.2.2 Google LLC
- 17.2.2.1. Overview
- 17.2.2.2. Products
- 17.2.2.3. SWOT Analysis
- 17.2.2.4. Recent Developments
- 17.2.2.5. Financials (Based on Availability)
- 17.2.3 Amazon com Inc
- 17.2.3.1. Overview
- 17.2.3.2. Products
- 17.2.3.3. SWOT Analysis
- 17.2.3.4. Recent Developments
- 17.2.3.5. Financials (Based on Availability)
- 17.2.4 Procter & Gamble Company
- 17.2.4.1. Overview
- 17.2.4.2. Products
- 17.2.4.3. SWOT Analysis
- 17.2.4.4. Recent Developments
- 17.2.4.5. Financials (Based on Availability)
- 17.2.5 Walmart Inc
- 17.2.5.1. Overview
- 17.2.5.2. Products
- 17.2.5.3. SWOT Analysis
- 17.2.5.4. Recent Developments
- 17.2.5.5. Financials (Based on Availability)
- 17.2.1 Toshiba Corporation
List of Figures
- Figure 1: Global Global Advanced Shopping Technology Market Revenue Breakdown (Million, %) by Region 2024 & 2032
- Figure 2: Global Global Advanced Shopping Technology Market Volume Breakdown (K Unit, %) by Region 2024 & 2032
- Figure 3: North America Global Advanced Shopping Technology Market Revenue (Million), by Country 2024 & 2032
- Figure 4: North America Global Advanced Shopping Technology Market Volume (K Unit), by Country 2024 & 2032
- Figure 5: North America Global Advanced Shopping Technology Market Revenue Share (%), by Country 2024 & 2032
- Figure 6: North America Global Advanced Shopping Technology Market Volume Share (%), by Country 2024 & 2032
- Figure 7: Europe Global Advanced Shopping Technology Market Revenue (Million), by Country 2024 & 2032
- Figure 8: Europe Global Advanced Shopping Technology Market Volume (K Unit), by Country 2024 & 2032
- Figure 9: Europe Global Advanced Shopping Technology Market Revenue Share (%), by Country 2024 & 2032
- Figure 10: Europe Global Advanced Shopping Technology Market Volume Share (%), by Country 2024 & 2032
- Figure 11: Asia Pacific Global Advanced Shopping Technology Market Revenue (Million), by Country 2024 & 2032
- Figure 12: Asia Pacific Global Advanced Shopping Technology Market Volume (K Unit), by Country 2024 & 2032
- Figure 13: Asia Pacific Global Advanced Shopping Technology Market Revenue Share (%), by Country 2024 & 2032
- Figure 14: Asia Pacific Global Advanced Shopping Technology Market Volume Share (%), by Country 2024 & 2032
- Figure 15: South America Global Advanced Shopping Technology Market Revenue (Million), by Country 2024 & 2032
- Figure 16: South America Global Advanced Shopping Technology Market Volume (K Unit), by Country 2024 & 2032
- Figure 17: South America Global Advanced Shopping Technology Market Revenue Share (%), by Country 2024 & 2032
- Figure 18: South America Global Advanced Shopping Technology Market Volume Share (%), by Country 2024 & 2032
- Figure 19: North America Global Advanced Shopping Technology Market Revenue (Million), by Country 2024 & 2032
- Figure 20: North America Global Advanced Shopping Technology Market Volume (K Unit), by Country 2024 & 2032
- Figure 21: North America Global Advanced Shopping Technology Market Revenue Share (%), by Country 2024 & 2032
- Figure 22: North America Global Advanced Shopping Technology Market Volume Share (%), by Country 2024 & 2032
- Figure 23: MEA Global Advanced Shopping Technology Market Revenue (Million), by Country 2024 & 2032
- Figure 24: MEA Global Advanced Shopping Technology Market Volume (K Unit), by Country 2024 & 2032
- Figure 25: MEA Global Advanced Shopping Technology Market Revenue Share (%), by Country 2024 & 2032
- Figure 26: MEA Global Advanced Shopping Technology Market Volume Share (%), by Country 2024 & 2032
- Figure 27: North America Global Advanced Shopping Technology Market Revenue (Million), by Product Type 2024 & 2032
- Figure 28: North America Global Advanced Shopping Technology Market Volume (K Unit), by Product Type 2024 & 2032
- Figure 29: North America Global Advanced Shopping Technology Market Revenue Share (%), by Product Type 2024 & 2032
- Figure 30: North America Global Advanced Shopping Technology Market Volume Share (%), by Product Type 2024 & 2032
- Figure 31: North America Global Advanced Shopping Technology Market Revenue (Million), by Application 2024 & 2032
- Figure 32: North America Global Advanced Shopping Technology Market Volume (K Unit), by Application 2024 & 2032
- Figure 33: North America Global Advanced Shopping Technology Market Revenue Share (%), by Application 2024 & 2032
- Figure 34: North America Global Advanced Shopping Technology Market Volume Share (%), by Application 2024 & 2032
- Figure 35: North America Global Advanced Shopping Technology Market Revenue (Million), by Country 2024 & 2032
- Figure 36: North America Global Advanced Shopping Technology Market Volume (K Unit), by Country 2024 & 2032
- Figure 37: North America Global Advanced Shopping Technology Market Revenue Share (%), by Country 2024 & 2032
- Figure 38: North America Global Advanced Shopping Technology Market Volume Share (%), by Country 2024 & 2032
- Figure 39: Europe Global Advanced Shopping Technology Market Revenue (Million), by Product Type 2024 & 2032
- Figure 40: Europe Global Advanced Shopping Technology Market Volume (K Unit), by Product Type 2024 & 2032
- Figure 41: Europe Global Advanced Shopping Technology Market Revenue Share (%), by Product Type 2024 & 2032
- Figure 42: Europe Global Advanced Shopping Technology Market Volume Share (%), by Product Type 2024 & 2032
- Figure 43: Europe Global Advanced Shopping Technology Market Revenue (Million), by Application 2024 & 2032
- Figure 44: Europe Global Advanced Shopping Technology Market Volume (K Unit), by Application 2024 & 2032
- Figure 45: Europe Global Advanced Shopping Technology Market Revenue Share (%), by Application 2024 & 2032
- Figure 46: Europe Global Advanced Shopping Technology Market Volume Share (%), by Application 2024 & 2032
- Figure 47: Europe Global Advanced Shopping Technology Market Revenue (Million), by Country 2024 & 2032
- Figure 48: Europe Global Advanced Shopping Technology Market Volume (K Unit), by Country 2024 & 2032
- Figure 49: Europe Global Advanced Shopping Technology Market Revenue Share (%), by Country 2024 & 2032
- Figure 50: Europe Global Advanced Shopping Technology Market Volume Share (%), by Country 2024 & 2032
- Figure 51: Asia Pacific Global Advanced Shopping Technology Market Revenue (Million), by Product Type 2024 & 2032
- Figure 52: Asia Pacific Global Advanced Shopping Technology Market Volume (K Unit), by Product Type 2024 & 2032
- Figure 53: Asia Pacific Global Advanced Shopping Technology Market Revenue Share (%), by Product Type 2024 & 2032
- Figure 54: Asia Pacific Global Advanced Shopping Technology Market Volume Share (%), by Product Type 2024 & 2032
- Figure 55: Asia Pacific Global Advanced Shopping Technology Market Revenue (Million), by Application 2024 & 2032
- Figure 56: Asia Pacific Global Advanced Shopping Technology Market Volume (K Unit), by Application 2024 & 2032
- Figure 57: Asia Pacific Global Advanced Shopping Technology Market Revenue Share (%), by Application 2024 & 2032
- Figure 58: Asia Pacific Global Advanced Shopping Technology Market Volume Share (%), by Application 2024 & 2032
- Figure 59: Asia Pacific Global Advanced Shopping Technology Market Revenue (Million), by Country 2024 & 2032
- Figure 60: Asia Pacific Global Advanced Shopping Technology Market Volume (K Unit), by Country 2024 & 2032
- Figure 61: Asia Pacific Global Advanced Shopping Technology Market Revenue Share (%), by Country 2024 & 2032
- Figure 62: Asia Pacific Global Advanced Shopping Technology Market Volume Share (%), by Country 2024 & 2032
- Figure 63: Latin America Global Advanced Shopping Technology Market Revenue (Million), by Product Type 2024 & 2032
- Figure 64: Latin America Global Advanced Shopping Technology Market Volume (K Unit), by Product Type 2024 & 2032
- Figure 65: Latin America Global Advanced Shopping Technology Market Revenue Share (%), by Product Type 2024 & 2032
- Figure 66: Latin America Global Advanced Shopping Technology Market Volume Share (%), by Product Type 2024 & 2032
- Figure 67: Latin America Global Advanced Shopping Technology Market Revenue (Million), by Application 2024 & 2032
- Figure 68: Latin America Global Advanced Shopping Technology Market Volume (K Unit), by Application 2024 & 2032
- Figure 69: Latin America Global Advanced Shopping Technology Market Revenue Share (%), by Application 2024 & 2032
- Figure 70: Latin America Global Advanced Shopping Technology Market Volume Share (%), by Application 2024 & 2032
- Figure 71: Latin America Global Advanced Shopping Technology Market Revenue (Million), by Country 2024 & 2032
- Figure 72: Latin America Global Advanced Shopping Technology Market Volume (K Unit), by Country 2024 & 2032
- Figure 73: Latin America Global Advanced Shopping Technology Market Revenue Share (%), by Country 2024 & 2032
- Figure 74: Latin America Global Advanced Shopping Technology Market Volume Share (%), by Country 2024 & 2032
- Figure 75: Middle East and Africa Global Advanced Shopping Technology Market Revenue (Million), by Product Type 2024 & 2032
- Figure 76: Middle East and Africa Global Advanced Shopping Technology Market Volume (K Unit), by Product Type 2024 & 2032
- Figure 77: Middle East and Africa Global Advanced Shopping Technology Market Revenue Share (%), by Product Type 2024 & 2032
- Figure 78: Middle East and Africa Global Advanced Shopping Technology Market Volume Share (%), by Product Type 2024 & 2032
- Figure 79: Middle East and Africa Global Advanced Shopping Technology Market Revenue (Million), by Application 2024 & 2032
- Figure 80: Middle East and Africa Global Advanced Shopping Technology Market Volume (K Unit), by Application 2024 & 2032
- Figure 81: Middle East and Africa Global Advanced Shopping Technology Market Revenue Share (%), by Application 2024 & 2032
- Figure 82: Middle East and Africa Global Advanced Shopping Technology Market Volume Share (%), by Application 2024 & 2032
- Figure 83: Middle East and Africa Global Advanced Shopping Technology Market Revenue (Million), by Country 2024 & 2032
- Figure 84: Middle East and Africa Global Advanced Shopping Technology Market Volume (K Unit), by Country 2024 & 2032
- Figure 85: Middle East and Africa Global Advanced Shopping Technology Market Revenue Share (%), by Country 2024 & 2032
- Figure 86: Middle East and Africa Global Advanced Shopping Technology Market Volume Share (%), by Country 2024 & 2032
List of Tables
- Table 1: Global Advanced Shopping Technology Market Revenue Million Forecast, by Region 2019 & 2032
- Table 2: Global Advanced Shopping Technology Market Volume K Unit Forecast, by Region 2019 & 2032
- Table 3: Global Advanced Shopping Technology Market Revenue Million Forecast, by Product Type 2019 & 2032
- Table 4: Global Advanced Shopping Technology Market Volume K Unit Forecast, by Product Type 2019 & 2032
- Table 5: Global Advanced Shopping Technology Market Revenue Million Forecast, by Application 2019 & 2032
- Table 6: Global Advanced Shopping Technology Market Volume K Unit Forecast, by Application 2019 & 2032
- Table 7: Global Advanced Shopping Technology Market Revenue Million Forecast, by Region 2019 & 2032
- Table 8: Global Advanced Shopping Technology Market Volume K Unit Forecast, by Region 2019 & 2032
- Table 9: Global Advanced Shopping Technology Market Revenue Million Forecast, by Country 2019 & 2032
- Table 10: Global Advanced Shopping Technology Market Volume K Unit Forecast, by Country 2019 & 2032
- Table 11: United States Global Advanced Shopping Technology Market Revenue (Million) Forecast, by Application 2019 & 2032
- Table 12: United States Global Advanced Shopping Technology Market Volume (K Unit) Forecast, by Application 2019 & 2032
- Table 13: Canada Global Advanced Shopping Technology Market Revenue (Million) Forecast, by Application 2019 & 2032
- Table 14: Canada Global Advanced Shopping Technology Market Volume (K Unit) Forecast, by Application 2019 & 2032
- Table 15: Mexico Global Advanced Shopping Technology Market Revenue (Million) Forecast, by Application 2019 & 2032
- Table 16: Mexico Global Advanced Shopping Technology Market Volume (K Unit) Forecast, by Application 2019 & 2032
- Table 17: Global Advanced Shopping Technology Market Revenue Million Forecast, by Country 2019 & 2032
- Table 18: Global Advanced Shopping Technology Market Volume K Unit Forecast, by Country 2019 & 2032
- Table 19: Germany Global Advanced Shopping Technology Market Revenue (Million) Forecast, by Application 2019 & 2032
- Table 20: Germany Global Advanced Shopping Technology Market Volume (K Unit) Forecast, by Application 2019 & 2032
- Table 21: United Kingdom Global Advanced Shopping Technology Market Revenue (Million) Forecast, by Application 2019 & 2032
- Table 22: United Kingdom Global Advanced Shopping Technology Market Volume (K Unit) Forecast, by Application 2019 & 2032
- Table 23: France Global Advanced Shopping Technology Market Revenue (Million) Forecast, by Application 2019 & 2032
- Table 24: France Global Advanced Shopping Technology Market Volume (K Unit) Forecast, by Application 2019 & 2032
- Table 25: Spain Global Advanced Shopping Technology Market Revenue (Million) Forecast, by Application 2019 & 2032
- Table 26: Spain Global Advanced Shopping Technology Market Volume (K Unit) Forecast, by Application 2019 & 2032
- Table 27: Italy Global Advanced Shopping Technology Market Revenue (Million) Forecast, by Application 2019 & 2032
- Table 28: Italy Global Advanced Shopping Technology Market Volume (K Unit) Forecast, by Application 2019 & 2032
- Table 29: Spain Global Advanced Shopping Technology Market Revenue (Million) Forecast, by Application 2019 & 2032
- Table 30: Spain Global Advanced Shopping Technology Market Volume (K Unit) Forecast, by Application 2019 & 2032
- Table 31: Belgium Global Advanced Shopping Technology Market Revenue (Million) Forecast, by Application 2019 & 2032
- Table 32: Belgium Global Advanced Shopping Technology Market Volume (K Unit) Forecast, by Application 2019 & 2032
- Table 33: Netherland Global Advanced Shopping Technology Market Revenue (Million) Forecast, by Application 2019 & 2032
- Table 34: Netherland Global Advanced Shopping Technology Market Volume (K Unit) Forecast, by Application 2019 & 2032
- Table 35: Nordics Global Advanced Shopping Technology Market Revenue (Million) Forecast, by Application 2019 & 2032
- Table 36: Nordics Global Advanced Shopping Technology Market Volume (K Unit) Forecast, by Application 2019 & 2032
- Table 37: Rest of Europe Global Advanced Shopping Technology Market Revenue (Million) Forecast, by Application 2019 & 2032
- Table 38: Rest of Europe Global Advanced Shopping Technology Market Volume (K Unit) Forecast, by Application 2019 & 2032
- Table 39: Global Advanced Shopping Technology Market Revenue Million Forecast, by Country 2019 & 2032
- Table 40: Global Advanced Shopping Technology Market Volume K Unit Forecast, by Country 2019 & 2032
- Table 41: China Global Advanced Shopping Technology Market Revenue (Million) Forecast, by Application 2019 & 2032
- Table 42: China Global Advanced Shopping Technology Market Volume (K Unit) Forecast, by Application 2019 & 2032
- Table 43: Japan Global Advanced Shopping Technology Market Revenue (Million) Forecast, by Application 2019 & 2032
- Table 44: Japan Global Advanced Shopping Technology Market Volume (K Unit) Forecast, by Application 2019 & 2032
- Table 45: India Global Advanced Shopping Technology Market Revenue (Million) Forecast, by Application 2019 & 2032
- Table 46: India Global Advanced Shopping Technology Market Volume (K Unit) Forecast, by Application 2019 & 2032
- Table 47: South Korea Global Advanced Shopping Technology Market Revenue (Million) Forecast, by Application 2019 & 2032
- Table 48: South Korea Global Advanced Shopping Technology Market Volume (K Unit) Forecast, by Application 2019 & 2032
- Table 49: Southeast Asia Global Advanced Shopping Technology Market Revenue (Million) Forecast, by Application 2019 & 2032
- Table 50: Southeast Asia Global Advanced Shopping Technology Market Volume (K Unit) Forecast, by Application 2019 & 2032
- Table 51: Australia Global Advanced Shopping Technology Market Revenue (Million) Forecast, by Application 2019 & 2032
- Table 52: Australia Global Advanced Shopping Technology Market Volume (K Unit) Forecast, by Application 2019 & 2032
- Table 53: Indonesia Global Advanced Shopping Technology Market Revenue (Million) Forecast, by Application 2019 & 2032
- Table 54: Indonesia Global Advanced Shopping Technology Market Volume (K Unit) Forecast, by Application 2019 & 2032
- Table 55: Phillipes Global Advanced Shopping Technology Market Revenue (Million) Forecast, by Application 2019 & 2032
- Table 56: Phillipes Global Advanced Shopping Technology Market Volume (K Unit) Forecast, by Application 2019 & 2032
- Table 57: Singapore Global Advanced Shopping Technology Market Revenue (Million) Forecast, by Application 2019 & 2032
- Table 58: Singapore Global Advanced Shopping Technology Market Volume (K Unit) Forecast, by Application 2019 & 2032
- Table 59: Thailandc Global Advanced Shopping Technology Market Revenue (Million) Forecast, by Application 2019 & 2032
- Table 60: Thailandc Global Advanced Shopping Technology Market Volume (K Unit) Forecast, by Application 2019 & 2032
- Table 61: Rest of Asia Pacific Global Advanced Shopping Technology Market Revenue (Million) Forecast, by Application 2019 & 2032
- Table 62: Rest of Asia Pacific Global Advanced Shopping Technology Market Volume (K Unit) Forecast, by Application 2019 & 2032
- Table 63: Global Advanced Shopping Technology Market Revenue Million Forecast, by Country 2019 & 2032
- Table 64: Global Advanced Shopping Technology Market Volume K Unit Forecast, by Country 2019 & 2032
- Table 65: Brazil Global Advanced Shopping Technology Market Revenue (Million) Forecast, by Application 2019 & 2032
- Table 66: Brazil Global Advanced Shopping Technology Market Volume (K Unit) Forecast, by Application 2019 & 2032
- Table 67: Argentina Global Advanced Shopping Technology Market Revenue (Million) Forecast, by Application 2019 & 2032
- Table 68: Argentina Global Advanced Shopping Technology Market Volume (K Unit) Forecast, by Application 2019 & 2032
- Table 69: Peru Global Advanced Shopping Technology Market Revenue (Million) Forecast, by Application 2019 & 2032
- Table 70: Peru Global Advanced Shopping Technology Market Volume (K Unit) Forecast, by Application 2019 & 2032
- Table 71: Chile Global Advanced Shopping Technology Market Revenue (Million) Forecast, by Application 2019 & 2032
- Table 72: Chile Global Advanced Shopping Technology Market Volume (K Unit) Forecast, by Application 2019 & 2032
- Table 73: Colombia Global Advanced Shopping Technology Market Revenue (Million) Forecast, by Application 2019 & 2032
- Table 74: Colombia Global Advanced Shopping Technology Market Volume (K Unit) Forecast, by Application 2019 & 2032
- Table 75: Ecuador Global Advanced Shopping Technology Market Revenue (Million) Forecast, by Application 2019 & 2032
- Table 76: Ecuador Global Advanced Shopping Technology Market Volume (K Unit) Forecast, by Application 2019 & 2032
- Table 77: Venezuela Global Advanced Shopping Technology Market Revenue (Million) Forecast, by Application 2019 & 2032
- Table 78: Venezuela Global Advanced Shopping Technology Market Volume (K Unit) Forecast, by Application 2019 & 2032
- Table 79: Rest of South America Global Advanced Shopping Technology Market Revenue (Million) Forecast, by Application 2019 & 2032
- Table 80: Rest of South America Global Advanced Shopping Technology Market Volume (K Unit) Forecast, by Application 2019 & 2032
- Table 81: Global Advanced Shopping Technology Market Revenue Million Forecast, by Country 2019 & 2032
- Table 82: Global Advanced Shopping Technology Market Volume K Unit Forecast, by Country 2019 & 2032
- Table 83: United States Global Advanced Shopping Technology Market Revenue (Million) Forecast, by Application 2019 & 2032
- Table 84: United States Global Advanced Shopping Technology Market Volume (K Unit) Forecast, by Application 2019 & 2032
- Table 85: Canada Global Advanced Shopping Technology Market Revenue (Million) Forecast, by Application 2019 & 2032
- Table 86: Canada Global Advanced Shopping Technology Market Volume (K Unit) Forecast, by Application 2019 & 2032
- Table 87: Mexico Global Advanced Shopping Technology Market Revenue (Million) Forecast, by Application 2019 & 2032
- Table 88: Mexico Global Advanced Shopping Technology Market Volume (K Unit) Forecast, by Application 2019 & 2032
- Table 89: Global Advanced Shopping Technology Market Revenue Million Forecast, by Country 2019 & 2032
- Table 90: Global Advanced Shopping Technology Market Volume K Unit Forecast, by Country 2019 & 2032
- Table 91: United Arab Emirates Global Advanced Shopping Technology Market Revenue (Million) Forecast, by Application 2019 & 2032
- Table 92: United Arab Emirates Global Advanced Shopping Technology Market Volume (K Unit) Forecast, by Application 2019 & 2032
- Table 93: Saudi Arabia Global Advanced Shopping Technology Market Revenue (Million) Forecast, by Application 2019 & 2032
- Table 94: Saudi Arabia Global Advanced Shopping Technology Market Volume (K Unit) Forecast, by Application 2019 & 2032
- Table 95: South Africa Global Advanced Shopping Technology Market Revenue (Million) Forecast, by Application 2019 & 2032
- Table 96: South Africa Global Advanced Shopping Technology Market Volume (K Unit) Forecast, by Application 2019 & 2032
- Table 97: Rest of Middle East and Africa Global Advanced Shopping Technology Market Revenue (Million) Forecast, by Application 2019 & 2032
- Table 98: Rest of Middle East and Africa Global Advanced Shopping Technology Market Volume (K Unit) Forecast, by Application 2019 & 2032
- Table 99: Global Advanced Shopping Technology Market Revenue Million Forecast, by Product Type 2019 & 2032
- Table 100: Global Advanced Shopping Technology Market Volume K Unit Forecast, by Product Type 2019 & 2032
- Table 101: Global Advanced Shopping Technology Market Revenue Million Forecast, by Application 2019 & 2032
- Table 102: Global Advanced Shopping Technology Market Volume K Unit Forecast, by Application 2019 & 2032
- Table 103: Global Advanced Shopping Technology Market Revenue Million Forecast, by Country 2019 & 2032
- Table 104: Global Advanced Shopping Technology Market Volume K Unit Forecast, by Country 2019 & 2032
- Table 105: Global Advanced Shopping Technology Market Revenue Million Forecast, by Product Type 2019 & 2032
- Table 106: Global Advanced Shopping Technology Market Volume K Unit Forecast, by Product Type 2019 & 2032
- Table 107: Global Advanced Shopping Technology Market Revenue Million Forecast, by Application 2019 & 2032
- Table 108: Global Advanced Shopping Technology Market Volume K Unit Forecast, by Application 2019 & 2032
- Table 109: Global Advanced Shopping Technology Market Revenue Million Forecast, by Country 2019 & 2032
- Table 110: Global Advanced Shopping Technology Market Volume K Unit Forecast, by Country 2019 & 2032
- Table 111: Global Advanced Shopping Technology Market Revenue Million Forecast, by Product Type 2019 & 2032
- Table 112: Global Advanced Shopping Technology Market Volume K Unit Forecast, by Product Type 2019 & 2032
- Table 113: Global Advanced Shopping Technology Market Revenue Million Forecast, by Application 2019 & 2032
- Table 114: Global Advanced Shopping Technology Market Volume K Unit Forecast, by Application 2019 & 2032
- Table 115: Global Advanced Shopping Technology Market Revenue Million Forecast, by Country 2019 & 2032
- Table 116: Global Advanced Shopping Technology Market Volume K Unit Forecast, by Country 2019 & 2032
- Table 117: Global Advanced Shopping Technology Market Revenue Million Forecast, by Product Type 2019 & 2032
- Table 118: Global Advanced Shopping Technology Market Volume K Unit Forecast, by Product Type 2019 & 2032
- Table 119: Global Advanced Shopping Technology Market Revenue Million Forecast, by Application 2019 & 2032
- Table 120: Global Advanced Shopping Technology Market Volume K Unit Forecast, by Application 2019 & 2032
- Table 121: Global Advanced Shopping Technology Market Revenue Million Forecast, by Country 2019 & 2032
- Table 122: Global Advanced Shopping Technology Market Volume K Unit Forecast, by Country 2019 & 2032
- Table 123: Global Advanced Shopping Technology Market Revenue Million Forecast, by Product Type 2019 & 2032
- Table 124: Global Advanced Shopping Technology Market Volume K Unit Forecast, by Product Type 2019 & 2032
- Table 125: Global Advanced Shopping Technology Market Revenue Million Forecast, by Application 2019 & 2032
- Table 126: Global Advanced Shopping Technology Market Volume K Unit Forecast, by Application 2019 & 2032
- Table 127: Global Advanced Shopping Technology Market Revenue Million Forecast, by Country 2019 & 2032
- Table 128: Global Advanced Shopping Technology Market Volume K Unit Forecast, by Country 2019 & 2032
Frequently Asked Questions
1. What is the projected Compound Annual Growth Rate (CAGR) of the Global Advanced Shopping Technology Market?
The projected CAGR is approximately 12.30%.
2. Which companies are prominent players in the Global Advanced Shopping Technology Market?
Key companies in the market include Toshiba Corporation, Google LLC, Amazon com Inc, Procter & Gamble Company, Walmart Inc.
3. What are the main segments of the Global Advanced Shopping Technology Market?
The market segments include Product Type, Application.
4. Can you provide details about the market size?
The market size is estimated to be USD XX Million as of 2022.
5. What are some drivers contributing to market growth?
Increasing adoption of advance technology in retail sector; Artificial intelligence and robots in retail stores.
6. What are the notable trends driving market growth?
Increasing Adoption of Virtual Reality in the Retail Sector is Expected to Drive the Market.
7. Are there any restraints impacting market growth?
High cost of implementation of the technology.
8. Can you provide examples of recent developments in the market?
June 2021: Toshiba's Self Checkout System 7 solution, developed by Toshiba Global Commerce Solutions and Calimax, provides fast, convenient, and frictionless checkout experiences. Calimax and Toshiba are designing the checkout experiences that shoppers want, thanks to user input and a collaborative approach, resulting in more checkout alternatives for customers and more sales.
9. What pricing options are available for accessing the report?
Pricing options include single-user, multi-user, and enterprise licenses priced at USD 4750, USD 5250, and USD 8750 respectively.
10. Is the market size provided in terms of value or volume?
The market size is provided in terms of value, measured in Million and volume, measured in K Unit.
11. Are there any specific market keywords associated with the report?
Yes, the market keyword associated with the report is "Global Advanced Shopping Technology Market," which aids in identifying and referencing the specific market segment covered.
12. How do I determine which pricing option suits my needs best?
The pricing options vary based on user requirements and access needs. Individual users may opt for single-user licenses, while businesses requiring broader access may choose multi-user or enterprise licenses for cost-effective access to the report.
13. Are there any additional resources or data provided in the Global Advanced Shopping Technology Market report?
While the report offers comprehensive insights, it's advisable to review the specific contents or supplementary materials provided to ascertain if additional resources or data are available.
14. How can I stay updated on further developments or reports in the Global Advanced Shopping Technology Market?
To stay informed about further developments, trends, and reports in the Global Advanced Shopping Technology Market, consider subscribing to industry newsletters, following relevant companies and organizations, or regularly checking reputable industry news sources and publications.
Methodology
Step 1 - Identification of Relevant Samples Size from Population Database


Step 2 - Approaches for Defining Global Market Size (Value, Volume* & Price*)

Note*: In applicable scenarios
Step 3 - Data Sources
Primary Research
- Web Analytics
- Survey Reports
- Research Institute
- Latest Research Reports
- Opinion Leaders
Secondary Research
- Annual Reports
- White Paper
- Latest Press Release
- Industry Association
- Paid Database
- Investor Presentations

Step 4 - Data Triangulation
Involves using different sources of information in order to increase the validity of a study
These sources are likely to be stakeholders in a program - participants, other researchers, program staff, other community members, and so on.
Then we put all data in single framework & apply various statistical tools to find out the dynamic on the market.
During the analysis stage, feedback from the stakeholder groups would be compared to determine areas of agreement as well as areas of divergence


