
Key Insights
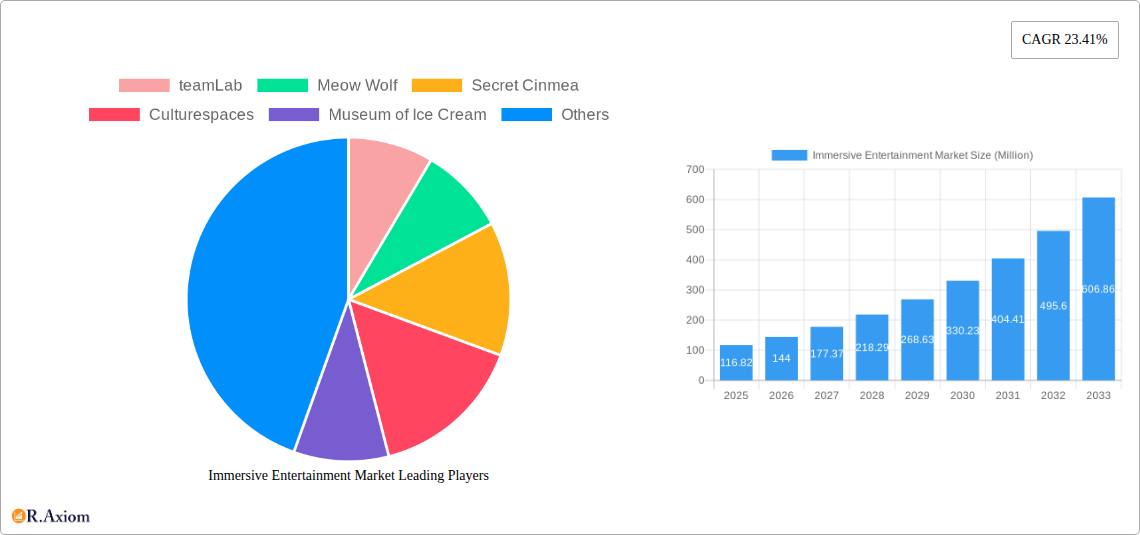
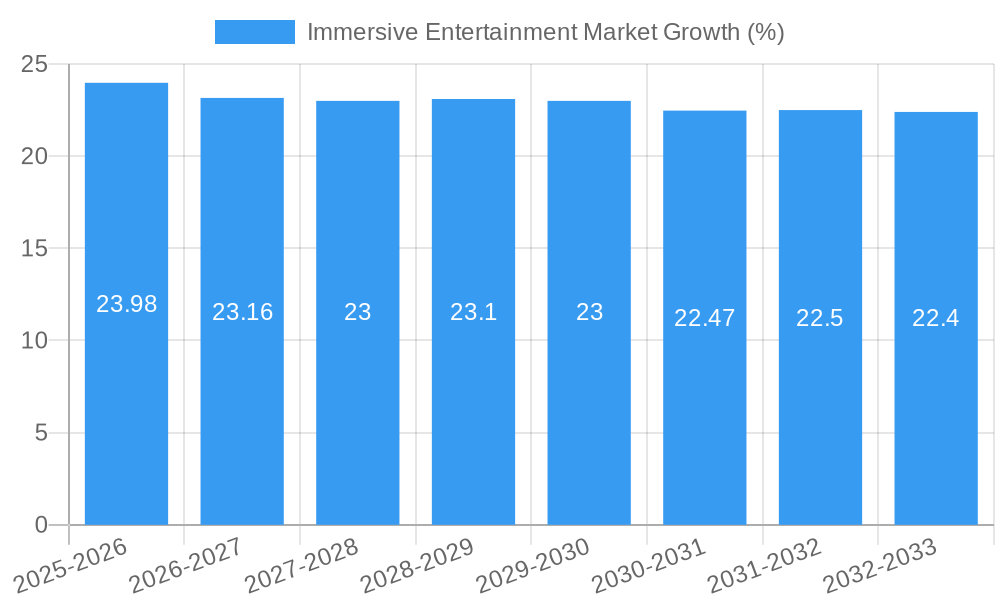
The immersive entertainment market is experiencing explosive growth, projected to reach a substantial size, driven by several key factors. The market's Compound Annual Growth Rate (CAGR) of 23.41% from 2019 to 2024 indicates significant expansion, fueled by increasing consumer demand for unique and engaging experiences. This demand stems from a desire for escapism, interactive entertainment, and shareable social experiences. Technological advancements, particularly in virtual reality (VR), augmented reality (AR), and mixed reality (MR), are crucial enablers, creating increasingly sophisticated and immersive environments. The rise of experiential retail and the integration of immersive technologies into tourism and other sectors further contribute to market expansion. Key players like teamLab, Meow Wolf, and major entertainment corporations are driving innovation and market penetration, developing cutting-edge attractions and experiences that cater to diverse demographics.
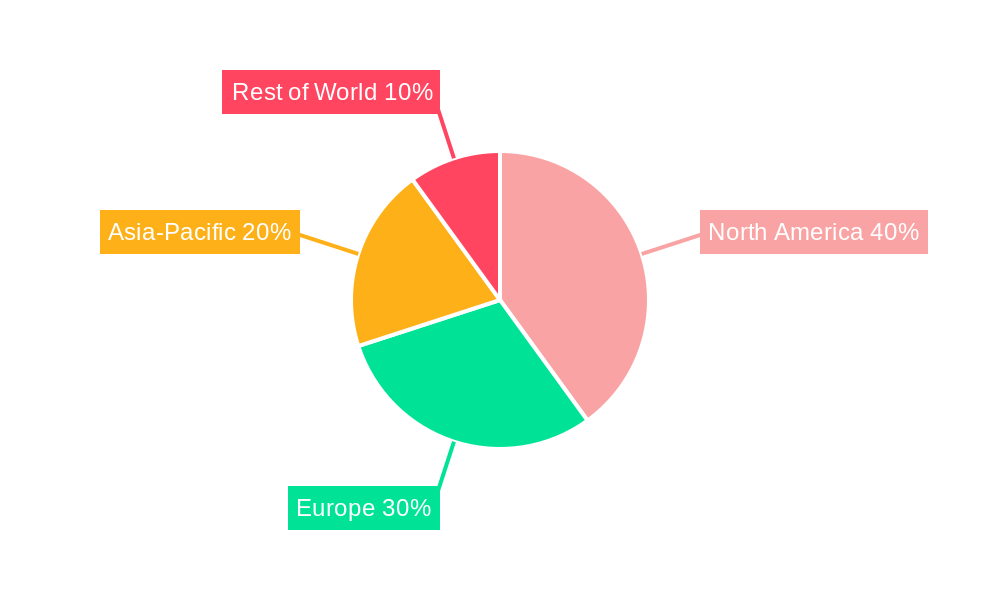
This rapid growth is expected to continue throughout the forecast period (2025-2033). While specific regional data is unavailable, we can infer a strong presence across North America and Europe, given the concentration of major players and early adoption of immersive technologies in these regions. The market is segmented based on the type of experience offered (e.g., VR arcades, themed attractions, interactive museums), and this segmentation continues to evolve as new technologies and creative concepts emerge. Challenges might include the high cost of developing and maintaining immersive experiences, as well as the need to constantly innovate to maintain consumer interest. However, the overall outlook for the immersive entertainment market remains exceptionally positive, indicating strong investment potential and continuing expansion in the coming years. The market's evolution will be influenced by technological breakthroughs, shifting consumer preferences, and the creative vision of industry leaders.
Immersive Entertainment Market: A Comprehensive Report (2019-2033)
This comprehensive report provides an in-depth analysis of the Immersive Entertainment Market, covering the period 2019-2033. It delves into market dynamics, growth drivers, challenges, and opportunities, offering valuable insights for industry stakeholders, investors, and businesses seeking to navigate this rapidly evolving sector. The report utilizes data from the historical period (2019-2024), the base year (2025), and provides forecasts for the period 2025-2033. The total market size is projected to reach xx Million by 2033, showcasing significant growth potential.
Immersive Entertainment Market Concentration & Innovation
The Immersive Entertainment market exhibits a moderately concentrated landscape with several key players holding significant market share. While precise market share figures for individual companies remain confidential and vary based on specific segments, major players like The Walt Disney Company and Universal Parks & Resorts command substantial portions. However, the market is also characterized by a high degree of innovation, with smaller, agile companies such as Meow Wolf and teamLab pushing creative boundaries and capturing niche markets.
- Market Concentration: The top 5 players likely hold approximately 60% of the market share (estimated), with the remainder distributed among numerous smaller players and emerging startups.
- Innovation Drivers: Technological advancements in VR/AR, AI, and interactive storytelling are key drivers. The demand for unique, personalized experiences also fuels innovation.
- Regulatory Frameworks: Varying regulations across different regions and regarding data privacy and safety standards impact market growth.
- Product Substitutes: Traditional entertainment options (movies, video games) remain substitutes, though immersive experiences offer a unique value proposition.
- End-User Trends: Growing demand for experiential entertainment, particularly amongst younger demographics, is a major driver. The desire for social sharing and unique content also plays a significant role.
- M&A Activities: The market has witnessed several significant M&A activities in recent years, with larger companies acquiring smaller, innovative firms to expand their portfolios and enhance technological capabilities. While precise deal values are often undisclosed, these acquisitions have typically been in the range of xx Million to xx Million per transaction.
Immersive Entertainment Market Industry Trends & Insights
The Immersive Entertainment Market is experiencing robust growth, driven by several key factors. Technological advancements in virtual and augmented reality (VR/AR), interactive storytelling, and haptic feedback create increasingly realistic and engaging experiences. The rising disposable incomes, especially in emerging economies, and a growing preference for experiential entertainment are boosting demand. Furthermore, the increasing adoption of mobile devices and the expansion of high-speed internet infrastructure further fuel this trend.
The market’s Compound Annual Growth Rate (CAGR) during the forecast period (2025-2033) is estimated at xx%, driven by factors such as increasing investments in theme parks, museums, and other entertainment venues. Market penetration in this sector is also rapidly growing, with the adoption of immersive technology increasing across various segments. However, competitive pressures from established and emerging players remain a key dynamic. The overall growth trajectory reflects a healthy market environment, with considerable scope for further expansion and innovation.
Dominant Markets & Segments in Immersive Entertainment Market
The North American market currently dominates the Immersive Entertainment sector, driven by high disposable incomes, advanced technological infrastructure, and a strong existing theme park and entertainment industry. However, Asia-Pacific is rapidly emerging as a key market, propelled by a young and tech-savvy population, coupled with substantial investment in entertainment infrastructure.
- Key Drivers of North American Dominance:
- Strong entertainment industry infrastructure.
- High disposable incomes.
- Early adoption of new technologies.
- Established presence of major players.
- Key Drivers of Asia-Pacific Growth:
- Large and growing young population.
- Increasing disposable incomes.
- Rapid technological advancements.
- Government support for the entertainment industry.
Europe also holds a substantial market share, particularly in specific niche segments like interactive museums and art installations. The dominance of these regions is expected to continue, although the growth rate in Asia-Pacific is projected to exceed that of North America. Further segmentation by type of experience (VR arcades, theme park attractions, etc.) reveals different growth dynamics, reflecting consumer preferences and technological trends.
Immersive Entertainment Market Product Developments
Recent product innovations include advancements in VR/AR headsets, haptic suits, and interactive storytelling technologies. This creates more immersive and realistic experiences, enhancing user engagement and driving adoption. New applications are continuously emerging, encompassing everything from theme parks and museums to marketing campaigns and educational tools. These applications leverage the immersive nature of the technology to create highly engaging and memorable experiences. The competitive advantage hinges on creating unique, high-quality experiences that stand out in a crowded market, as well as seamless integration with existing entertainment platforms and technologies.
Report Scope & Segmentation Analysis
This report segments the Immersive Entertainment market based on several key factors:
- By Technology: VR, AR, MR, and other immersive technologies. Each segment exhibits distinct growth trajectories reflecting the varying levels of technological maturity and consumer adoption.
- By Application: Theme Parks, Museums, Retail, Marketing, Education, and others. Growth rates differ across segments based on industry-specific adoption rates and the potential for integration of immersive experiences.
- By Region: North America, Europe, Asia-Pacific, and Rest of World. Each region displays unique growth patterns due to factors such as economic conditions, technological infrastructure, and cultural preferences.
Each segment displays unique market sizes, growth projections, and competitive dynamics.
Key Drivers of Immersive Entertainment Market Growth
Several factors drive the growth of the Immersive Entertainment market. Technological advancements in VR/AR and related technologies continue to enhance the quality and realism of experiences. Rising disposable incomes globally fuel demand for entertainment and leisure activities, making immersive experiences more accessible. Furthermore, the increasing prevalence of smartphones and high-speed internet access broaden the reach and accessibility of immersive content. Positive regulatory environments in some regions also promote market expansion.
Challenges in the Immersive Entertainment Market Sector
Challenges include the high cost of developing and deploying immersive technologies, which can limit market access and affordability for consumers. The potential for motion sickness and other adverse physical effects related to VR/AR use presents a barrier to wider adoption. Furthermore, the need for ongoing technological upgrades and content updates represents an ongoing cost for businesses in the sector. The competition from other forms of entertainment also puts pressure on pricing strategies and innovation rates.
Emerging Opportunities in Immersive Entertainment Market
The market offers exciting opportunities. Expansion into emerging markets presents significant growth potential as these regions adopt immersive technologies. New applications in education, healthcare, and training are continuously emerging, expanding the market beyond entertainment. The integration of immersive technologies with other platforms (e.g., metaverse experiences) also unlocks significant future opportunities. Furthermore, the development of more affordable and accessible hardware and software creates wider reach and adoption.
Leading Players in the Immersive Entertainment Market
- teamLab
- Meow Wolf
- Secret Cinmea
- Culturespaces
- Museum of Ice Cream
- Grande Experiences
- The Walt Disney Company
- Universal Parks & Resorts
- Six Flags Entertainment Corporation
- Cedar Fair Entertainment Company
- *List Not Exhaustive
Key Developments in Immersive Entertainment Market Industry
- May 2024: Technicolor Group expands into experiential entertainment, signaling growing industry interest and investment.
- August 2024: Disney+ and National Geographic launch an immersive Iceland experience on Apple Vision Pro, highlighting the growing use of immersive technology in streaming and travel.
Strategic Outlook for Immersive Entertainment Market
The Immersive Entertainment Market shows immense potential for continued growth, fueled by ongoing technological advancements, increasing consumer demand for experiential entertainment, and expansion into new applications and markets. Strategic investments in innovative technologies, content development, and strategic partnerships will be crucial for success in this dynamic sector. Companies should focus on creating high-quality, unique experiences that leverage the latest technological advancements to capture market share and drive growth.
Immersive Entertainment Market Segmentation
-
1. Application
- 1.1. Themed Entertainment
- 1.2. Haunted Attractions and Escape Rroms
- 1.3. Immersive Theatres
- 1.4. Experiential Art Museums
- 1.5. Other Applications (Includes Exhibitions, etc.)
Immersive Entertainment Market Segmentation By Geography
- 1. North America
- 2. Europe
- 3. Asia
- 4. Australia and New Zealand
- 5. Latin America
- 6. Middle East and Africa
Immersive Entertainment Market REPORT HIGHLIGHTS
| Aspects | Details |
|---|---|
| Study Period | 2019-2033 |
| Base Year | 2024 |
| Estimated Year | 2025 |
| Forecast Period | 2025-2033 |
| Historical Period | 2019-2024 |
| Growth Rate | CAGR of 23.41% from 2019-2033 |
| Segmentation |
|
Table of Contents
- 1. Introduction
- 1.1. Research Scope
- 1.2. Market Segmentation
- 1.3. Research Methodology
- 1.4. Definitions and Assumptions
- 2. Executive Summary
- 2.1. Introduction
- 3. Market Dynamics
- 3.1. Introduction
- 3.2. Market Drivers
- 3.2.1. Creative success in the Entertainment industry is driving the revenue growth in the sector
- 3.3. Market Restrains
- 3.3.1. Creative success in the Entertainment industry is driving the revenue growth in the sector
- 3.4. Market Trends
- 3.4.1. Increasing Consumer Demand in Gaming Entertainment is Driving the Market Growth Opportunities
- 4. Market Factor Analysis
- 4.1. Porters Five Forces
- 4.2. Supply/Value Chain
- 4.3. PESTEL analysis
- 4.4. Market Entropy
- 4.5. Patent/Trademark Analysis
- 5. Global Immersive Entertainment Market Analysis, Insights and Forecast, 2019-2031
- 5.1. Market Analysis, Insights and Forecast - by Application
- 5.1.1. Themed Entertainment
- 5.1.2. Haunted Attractions and Escape Rroms
- 5.1.3. Immersive Theatres
- 5.1.4. Experiential Art Museums
- 5.1.5. Other Applications (Includes Exhibitions, etc.)
- 5.2. Market Analysis, Insights and Forecast - by Region
- 5.2.1. North America
- 5.2.2. Europe
- 5.2.3. Asia
- 5.2.4. Australia and New Zealand
- 5.2.5. Latin America
- 5.2.6. Middle East and Africa
- 5.1. Market Analysis, Insights and Forecast - by Application
- 6. North America Immersive Entertainment Market Analysis, Insights and Forecast, 2019-2031
- 6.1. Market Analysis, Insights and Forecast - by Application
- 6.1.1. Themed Entertainment
- 6.1.2. Haunted Attractions and Escape Rroms
- 6.1.3. Immersive Theatres
- 6.1.4. Experiential Art Museums
- 6.1.5. Other Applications (Includes Exhibitions, etc.)
- 6.1. Market Analysis, Insights and Forecast - by Application
- 7. Europe Immersive Entertainment Market Analysis, Insights and Forecast, 2019-2031
- 7.1. Market Analysis, Insights and Forecast - by Application
- 7.1.1. Themed Entertainment
- 7.1.2. Haunted Attractions and Escape Rroms
- 7.1.3. Immersive Theatres
- 7.1.4. Experiential Art Museums
- 7.1.5. Other Applications (Includes Exhibitions, etc.)
- 7.1. Market Analysis, Insights and Forecast - by Application
- 8. Asia Immersive Entertainment Market Analysis, Insights and Forecast, 2019-2031
- 8.1. Market Analysis, Insights and Forecast - by Application
- 8.1.1. Themed Entertainment
- 8.1.2. Haunted Attractions and Escape Rroms
- 8.1.3. Immersive Theatres
- 8.1.4. Experiential Art Museums
- 8.1.5. Other Applications (Includes Exhibitions, etc.)
- 8.1. Market Analysis, Insights and Forecast - by Application
- 9. Australia and New Zealand Immersive Entertainment Market Analysis, Insights and Forecast, 2019-2031
- 9.1. Market Analysis, Insights and Forecast - by Application
- 9.1.1. Themed Entertainment
- 9.1.2. Haunted Attractions and Escape Rroms
- 9.1.3. Immersive Theatres
- 9.1.4. Experiential Art Museums
- 9.1.5. Other Applications (Includes Exhibitions, etc.)
- 9.1. Market Analysis, Insights and Forecast - by Application
- 10. Latin America Immersive Entertainment Market Analysis, Insights and Forecast, 2019-2031
- 10.1. Market Analysis, Insights and Forecast - by Application
- 10.1.1. Themed Entertainment
- 10.1.2. Haunted Attractions and Escape Rroms
- 10.1.3. Immersive Theatres
- 10.1.4. Experiential Art Museums
- 10.1.5. Other Applications (Includes Exhibitions, etc.)
- 10.1. Market Analysis, Insights and Forecast - by Application
- 11. Middle East and Africa Immersive Entertainment Market Analysis, Insights and Forecast, 2019-2031
- 11.1. Market Analysis, Insights and Forecast - by Application
- 11.1.1. Themed Entertainment
- 11.1.2. Haunted Attractions and Escape Rroms
- 11.1.3. Immersive Theatres
- 11.1.4. Experiential Art Museums
- 11.1.5. Other Applications (Includes Exhibitions, etc.)
- 11.1. Market Analysis, Insights and Forecast - by Application
- 12. Competitive Analysis
- 12.1. Global Market Share Analysis 2024
- 12.2. Company Profiles
- 12.2.1 teamLab
- 12.2.1.1. Overview
- 12.2.1.2. Products
- 12.2.1.3. SWOT Analysis
- 12.2.1.4. Recent Developments
- 12.2.1.5. Financials (Based on Availability)
- 12.2.2 Meow Wolf
- 12.2.2.1. Overview
- 12.2.2.2. Products
- 12.2.2.3. SWOT Analysis
- 12.2.2.4. Recent Developments
- 12.2.2.5. Financials (Based on Availability)
- 12.2.3 Secret Cinmea
- 12.2.3.1. Overview
- 12.2.3.2. Products
- 12.2.3.3. SWOT Analysis
- 12.2.3.4. Recent Developments
- 12.2.3.5. Financials (Based on Availability)
- 12.2.4 Culturespaces
- 12.2.4.1. Overview
- 12.2.4.2. Products
- 12.2.4.3. SWOT Analysis
- 12.2.4.4. Recent Developments
- 12.2.4.5. Financials (Based on Availability)
- 12.2.5 Museum of Ice Cream
- 12.2.5.1. Overview
- 12.2.5.2. Products
- 12.2.5.3. SWOT Analysis
- 12.2.5.4. Recent Developments
- 12.2.5.5. Financials (Based on Availability)
- 12.2.6 Grande Experiences
- 12.2.6.1. Overview
- 12.2.6.2. Products
- 12.2.6.3. SWOT Analysis
- 12.2.6.4. Recent Developments
- 12.2.6.5. Financials (Based on Availability)
- 12.2.7 The Walt Disney Company
- 12.2.7.1. Overview
- 12.2.7.2. Products
- 12.2.7.3. SWOT Analysis
- 12.2.7.4. Recent Developments
- 12.2.7.5. Financials (Based on Availability)
- 12.2.8 Universal Parks & Resorts
- 12.2.8.1. Overview
- 12.2.8.2. Products
- 12.2.8.3. SWOT Analysis
- 12.2.8.4. Recent Developments
- 12.2.8.5. Financials (Based on Availability)
- 12.2.9 Six Flags Entertainment Corporation
- 12.2.9.1. Overview
- 12.2.9.2. Products
- 12.2.9.3. SWOT Analysis
- 12.2.9.4. Recent Developments
- 12.2.9.5. Financials (Based on Availability)
- 12.2.10 Cedar Fair Entertainment Company*List Not Exhaustive
- 12.2.10.1. Overview
- 12.2.10.2. Products
- 12.2.10.3. SWOT Analysis
- 12.2.10.4. Recent Developments
- 12.2.10.5. Financials (Based on Availability)
- 12.2.1 teamLab
List of Figures
- Figure 1: Global Immersive Entertainment Market Revenue Breakdown (Million, %) by Region 2024 & 2032
- Figure 2: Global Immersive Entertainment Market Volume Breakdown (Billion, %) by Region 2024 & 2032
- Figure 3: North America Immersive Entertainment Market Revenue (Million), by Application 2024 & 2032
- Figure 4: North America Immersive Entertainment Market Volume (Billion), by Application 2024 & 2032
- Figure 5: North America Immersive Entertainment Market Revenue Share (%), by Application 2024 & 2032
- Figure 6: North America Immersive Entertainment Market Volume Share (%), by Application 2024 & 2032
- Figure 7: North America Immersive Entertainment Market Revenue (Million), by Country 2024 & 2032
- Figure 8: North America Immersive Entertainment Market Volume (Billion), by Country 2024 & 2032
- Figure 9: North America Immersive Entertainment Market Revenue Share (%), by Country 2024 & 2032
- Figure 10: North America Immersive Entertainment Market Volume Share (%), by Country 2024 & 2032
- Figure 11: Europe Immersive Entertainment Market Revenue (Million), by Application 2024 & 2032
- Figure 12: Europe Immersive Entertainment Market Volume (Billion), by Application 2024 & 2032
- Figure 13: Europe Immersive Entertainment Market Revenue Share (%), by Application 2024 & 2032
- Figure 14: Europe Immersive Entertainment Market Volume Share (%), by Application 2024 & 2032
- Figure 15: Europe Immersive Entertainment Market Revenue (Million), by Country 2024 & 2032
- Figure 16: Europe Immersive Entertainment Market Volume (Billion), by Country 2024 & 2032
- Figure 17: Europe Immersive Entertainment Market Revenue Share (%), by Country 2024 & 2032
- Figure 18: Europe Immersive Entertainment Market Volume Share (%), by Country 2024 & 2032
- Figure 19: Asia Immersive Entertainment Market Revenue (Million), by Application 2024 & 2032
- Figure 20: Asia Immersive Entertainment Market Volume (Billion), by Application 2024 & 2032
- Figure 21: Asia Immersive Entertainment Market Revenue Share (%), by Application 2024 & 2032
- Figure 22: Asia Immersive Entertainment Market Volume Share (%), by Application 2024 & 2032
- Figure 23: Asia Immersive Entertainment Market Revenue (Million), by Country 2024 & 2032
- Figure 24: Asia Immersive Entertainment Market Volume (Billion), by Country 2024 & 2032
- Figure 25: Asia Immersive Entertainment Market Revenue Share (%), by Country 2024 & 2032
- Figure 26: Asia Immersive Entertainment Market Volume Share (%), by Country 2024 & 2032
- Figure 27: Australia and New Zealand Immersive Entertainment Market Revenue (Million), by Application 2024 & 2032
- Figure 28: Australia and New Zealand Immersive Entertainment Market Volume (Billion), by Application 2024 & 2032
- Figure 29: Australia and New Zealand Immersive Entertainment Market Revenue Share (%), by Application 2024 & 2032
- Figure 30: Australia and New Zealand Immersive Entertainment Market Volume Share (%), by Application 2024 & 2032
- Figure 31: Australia and New Zealand Immersive Entertainment Market Revenue (Million), by Country 2024 & 2032
- Figure 32: Australia and New Zealand Immersive Entertainment Market Volume (Billion), by Country 2024 & 2032
- Figure 33: Australia and New Zealand Immersive Entertainment Market Revenue Share (%), by Country 2024 & 2032
- Figure 34: Australia and New Zealand Immersive Entertainment Market Volume Share (%), by Country 2024 & 2032
- Figure 35: Latin America Immersive Entertainment Market Revenue (Million), by Application 2024 & 2032
- Figure 36: Latin America Immersive Entertainment Market Volume (Billion), by Application 2024 & 2032
- Figure 37: Latin America Immersive Entertainment Market Revenue Share (%), by Application 2024 & 2032
- Figure 38: Latin America Immersive Entertainment Market Volume Share (%), by Application 2024 & 2032
- Figure 39: Latin America Immersive Entertainment Market Revenue (Million), by Country 2024 & 2032
- Figure 40: Latin America Immersive Entertainment Market Volume (Billion), by Country 2024 & 2032
- Figure 41: Latin America Immersive Entertainment Market Revenue Share (%), by Country 2024 & 2032
- Figure 42: Latin America Immersive Entertainment Market Volume Share (%), by Country 2024 & 2032
- Figure 43: Middle East and Africa Immersive Entertainment Market Revenue (Million), by Application 2024 & 2032
- Figure 44: Middle East and Africa Immersive Entertainment Market Volume (Billion), by Application 2024 & 2032
- Figure 45: Middle East and Africa Immersive Entertainment Market Revenue Share (%), by Application 2024 & 2032
- Figure 46: Middle East and Africa Immersive Entertainment Market Volume Share (%), by Application 2024 & 2032
- Figure 47: Middle East and Africa Immersive Entertainment Market Revenue (Million), by Country 2024 & 2032
- Figure 48: Middle East and Africa Immersive Entertainment Market Volume (Billion), by Country 2024 & 2032
- Figure 49: Middle East and Africa Immersive Entertainment Market Revenue Share (%), by Country 2024 & 2032
- Figure 50: Middle East and Africa Immersive Entertainment Market Volume Share (%), by Country 2024 & 2032
List of Tables
- Table 1: Global Immersive Entertainment Market Revenue Million Forecast, by Region 2019 & 2032
- Table 2: Global Immersive Entertainment Market Volume Billion Forecast, by Region 2019 & 2032
- Table 3: Global Immersive Entertainment Market Revenue Million Forecast, by Application 2019 & 2032
- Table 4: Global Immersive Entertainment Market Volume Billion Forecast, by Application 2019 & 2032
- Table 5: Global Immersive Entertainment Market Revenue Million Forecast, by Region 2019 & 2032
- Table 6: Global Immersive Entertainment Market Volume Billion Forecast, by Region 2019 & 2032
- Table 7: Global Immersive Entertainment Market Revenue Million Forecast, by Application 2019 & 2032
- Table 8: Global Immersive Entertainment Market Volume Billion Forecast, by Application 2019 & 2032
- Table 9: Global Immersive Entertainment Market Revenue Million Forecast, by Country 2019 & 2032
- Table 10: Global Immersive Entertainment Market Volume Billion Forecast, by Country 2019 & 2032
- Table 11: Global Immersive Entertainment Market Revenue Million Forecast, by Application 2019 & 2032
- Table 12: Global Immersive Entertainment Market Volume Billion Forecast, by Application 2019 & 2032
- Table 13: Global Immersive Entertainment Market Revenue Million Forecast, by Country 2019 & 2032
- Table 14: Global Immersive Entertainment Market Volume Billion Forecast, by Country 2019 & 2032
- Table 15: Global Immersive Entertainment Market Revenue Million Forecast, by Application 2019 & 2032
- Table 16: Global Immersive Entertainment Market Volume Billion Forecast, by Application 2019 & 2032
- Table 17: Global Immersive Entertainment Market Revenue Million Forecast, by Country 2019 & 2032
- Table 18: Global Immersive Entertainment Market Volume Billion Forecast, by Country 2019 & 2032
- Table 19: Global Immersive Entertainment Market Revenue Million Forecast, by Application 2019 & 2032
- Table 20: Global Immersive Entertainment Market Volume Billion Forecast, by Application 2019 & 2032
- Table 21: Global Immersive Entertainment Market Revenue Million Forecast, by Country 2019 & 2032
- Table 22: Global Immersive Entertainment Market Volume Billion Forecast, by Country 2019 & 2032
- Table 23: Global Immersive Entertainment Market Revenue Million Forecast, by Application 2019 & 2032
- Table 24: Global Immersive Entertainment Market Volume Billion Forecast, by Application 2019 & 2032
- Table 25: Global Immersive Entertainment Market Revenue Million Forecast, by Country 2019 & 2032
- Table 26: Global Immersive Entertainment Market Volume Billion Forecast, by Country 2019 & 2032
- Table 27: Global Immersive Entertainment Market Revenue Million Forecast, by Application 2019 & 2032
- Table 28: Global Immersive Entertainment Market Volume Billion Forecast, by Application 2019 & 2032
- Table 29: Global Immersive Entertainment Market Revenue Million Forecast, by Country 2019 & 2032
- Table 30: Global Immersive Entertainment Market Volume Billion Forecast, by Country 2019 & 2032
Frequently Asked Questions
1. What is the projected Compound Annual Growth Rate (CAGR) of the Immersive Entertainment Market?
The projected CAGR is approximately 23.41%.
2. Which companies are prominent players in the Immersive Entertainment Market?
Key companies in the market include teamLab, Meow Wolf, Secret Cinmea, Culturespaces, Museum of Ice Cream, Grande Experiences, The Walt Disney Company, Universal Parks & Resorts, Six Flags Entertainment Corporation, Cedar Fair Entertainment Company*List Not Exhaustive.
3. What are the main segments of the Immersive Entertainment Market?
The market segments include Application.
4. Can you provide details about the market size?
The market size is estimated to be USD 116.82 Million as of 2022.
5. What are some drivers contributing to market growth?
Creative success in the Entertainment industry is driving the revenue growth in the sector.
6. What are the notable trends driving market growth?
Increasing Consumer Demand in Gaming Entertainment is Driving the Market Growth Opportunities.
7. Are there any restraints impacting market growth?
Creative success in the Entertainment industry is driving the revenue growth in the sector.
8. Can you provide examples of recent developments in the market?
August 2024: Disney+ introduced a new immersive experience from National Geographic on its Apple Vision Pro app. Subscribers can now visually explore Iceland’s Thingvellir National Park through this feature. National Geographic has launched its inaugural immersive project tailored for Apple Vision Pro. Collaborating closely with Disney Studio Technology, National Geographic spearheaded this immersive environment's creative development and production. It utilized high-resolution 3D models captured on-site through photogrammetry alongside gigapixel panoramas.May 2024: Technicolor Group accelerated its expansion in experiential entertainment, building on its legacy of innovation and bolstering its dedicated team. This strategic decision aligns with the surging demand for experiential entertainment, extending beyond traditional theme parks to encompass museums, retail, marketing, travel, sports, and recreation.
9. What pricing options are available for accessing the report?
Pricing options include single-user, multi-user, and enterprise licenses priced at USD 4750, USD 5250, and USD 8750 respectively.
10. Is the market size provided in terms of value or volume?
The market size is provided in terms of value, measured in Million and volume, measured in Billion.
11. Are there any specific market keywords associated with the report?
Yes, the market keyword associated with the report is "Immersive Entertainment Market," which aids in identifying and referencing the specific market segment covered.
12. How do I determine which pricing option suits my needs best?
The pricing options vary based on user requirements and access needs. Individual users may opt for single-user licenses, while businesses requiring broader access may choose multi-user or enterprise licenses for cost-effective access to the report.
13. Are there any additional resources or data provided in the Immersive Entertainment Market report?
While the report offers comprehensive insights, it's advisable to review the specific contents or supplementary materials provided to ascertain if additional resources or data are available.
14. How can I stay updated on further developments or reports in the Immersive Entertainment Market?
To stay informed about further developments, trends, and reports in the Immersive Entertainment Market, consider subscribing to industry newsletters, following relevant companies and organizations, or regularly checking reputable industry news sources and publications.
Methodology
Step 1 - Identification of Relevant Samples Size from Population Database


Step 2 - Approaches for Defining Global Market Size (Value, Volume* & Price*)

Note*: In applicable scenarios
Step 3 - Data Sources
Primary Research
- Web Analytics
- Survey Reports
- Research Institute
- Latest Research Reports
- Opinion Leaders
Secondary Research
- Annual Reports
- White Paper
- Latest Press Release
- Industry Association
- Paid Database
- Investor Presentations

Step 4 - Data Triangulation
Involves using different sources of information in order to increase the validity of a study
These sources are likely to be stakeholders in a program - participants, other researchers, program staff, other community members, and so on.
Then we put all data in single framework & apply various statistical tools to find out the dynamic on the market.
During the analysis stage, feedback from the stakeholder groups would be compared to determine areas of agreement as well as areas of divergence


