
Key Insights
The Internet Filtering Software market is experiencing robust growth, projected to reach a substantial size by 2033. A compound annual growth rate (CAGR) of 14% from 2025 to 2033 indicates significant market expansion driven by several key factors. The increasing prevalence of cyber threats, including malware, phishing attacks, and data breaches, necessitates robust internet filtering solutions across diverse sectors. Government regulations mandating data security and privacy, particularly within BFSI and education, further fuel market demand. The rising adoption of cloud-based deployment models offers scalability and cost-effectiveness, contributing to market growth. Furthermore, the expansion of internet usage across emerging economies, particularly in Asia-Pacific, presents significant untapped potential. The market is segmented by industry vertical (BFSI, IT & Telecom, Government, Education, and others), component (solution and services), deployment mode (cloud and on-premises), and filtering type (DNS, keyword, URL, and others). The competitive landscape is characterized by established players such as Broadcom, Barracuda Networks, and Zscaler, along with emerging companies innovating in areas like AI-powered threat detection.
The market's future growth will depend on several factors. Continued advancements in filtering technologies, including AI and machine learning integration for improved threat detection, are crucial. The evolution of cyber threats and the emergence of new attack vectors will demand continuous innovation. Pricing strategies and the accessibility of these solutions for smaller organizations will also play a key role. Successful market penetration in emerging regions relies on localized support and addressing unique technological infrastructure challenges. Addressing concerns around data privacy and compliance with stringent regulations will be essential for sustained growth. The market will likely witness increased mergers and acquisitions as companies strive to expand their product portfolios and enhance market share.
Internet Filtering Software Industry Market Report: 2019-2033
This comprehensive report provides a detailed analysis of the Internet Filtering Software industry, covering market size, segmentation, growth drivers, challenges, and key players. The study period spans from 2019 to 2033, with 2025 serving as the base and estimated year. The forecast period is 2025-2033, and the historical period is 2019-2024. The global market size in 2025 is estimated at $XX Billion.
Internet Filtering Software Industry Market Concentration & Innovation
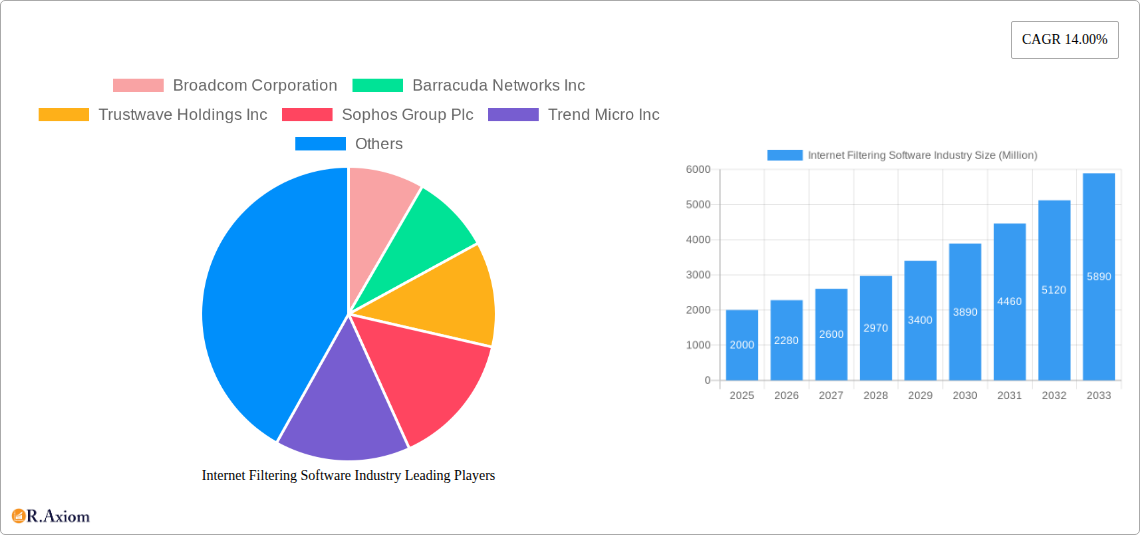
The Internet Filtering Software market exhibits a moderately concentrated landscape, with key players such as Broadcom Corporation, Barracuda Networks Inc, Trustwave Holdings Inc, Sophos Group Plc, Trend Micro Inc, Zscaler Inc, Fortinet Inc, McAfee Inc, Cisco Systems Inc, Webroot Inc, AO Kaspersky Lab, Forcepoint Inc, and Palo Alto Networks Inc holding significant market share. The top 5 players collectively account for approximately xx% of the market in 2025. Innovation is driven by the increasing sophistication of cyber threats, the growing demand for secure remote access, and evolving regulatory frameworks around data privacy.
- Market Share: The market share distribution is dynamic, with ongoing competition and strategic acquisitions influencing the landscape.
- M&A Activity: The industry has witnessed significant M&A activity in recent years, with deal values totaling $XX Billion during the historical period. These acquisitions have primarily focused on expanding product portfolios and geographical reach.
- Regulatory Frameworks: GDPR, CCPA, and other data privacy regulations are significant drivers of innovation, pushing vendors to enhance their solutions' compliance capabilities.
- Product Substitutes: While dedicated internet filtering software remains dominant, alternative security solutions such as firewalls and VPNs offer some level of overlapping functionality.
- End-User Trends: The shift towards cloud-based solutions, increased adoption of multi-factor authentication, and growing concerns about data breaches are shaping market trends.
Internet Filtering Software Industry Industry Trends & Insights
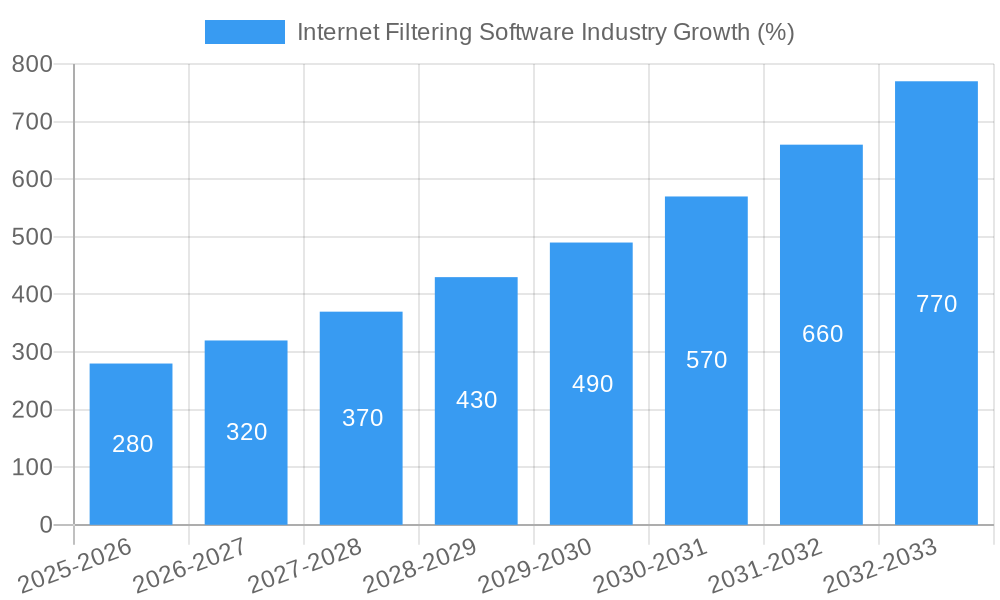
The Internet Filtering Software market is experiencing robust growth, fueled by a number of factors. The increasing prevalence of cyber threats, the expanding adoption of the internet and connected devices across various sectors, and the growing awareness of data security risks are key growth drivers. The market is also witnessing significant technological disruptions, including advancements in AI and machine learning, enhancing threat detection and response capabilities. Consumer preferences are shifting towards cloud-based solutions for their scalability, cost-effectiveness, and ease of management. The competitive dynamics are characterized by intense rivalry, with vendors focusing on product innovation, strategic partnerships, and acquisitions to gain a competitive edge. The CAGR for the forecast period (2025-2033) is estimated at xx%, with market penetration expected to reach xx% by 2033.
Dominant Markets & Segments in Internet Filtering Software Industry
By Industry Vertical: The BFSI (Banking, Financial Services, and Insurance) sector is the dominant segment, driven by stringent regulatory compliance requirements and the high value of sensitive data. The IT & Telecom sector follows closely, followed by Government and Education. Other industry verticals, including Manufacturing, Healthcare, and Retail, are also experiencing significant growth. Key drivers in each segment include:
- BFSI: Stringent regulatory compliance, high value of sensitive financial data.
- IT & Telecom: Protecting critical infrastructure and sensitive customer data.
- Government: Ensuring national security and protecting sensitive government information.
- Education: Protecting students and staff from inappropriate content and cyberbullying.
- Other Industry Verticals: Growing digitalization and increased reliance on internet connectivity.
By Component: The solution segment holds a larger market share compared to the services segment due to the higher demand for comprehensive security solutions. However, the services segment is expected to witness significant growth due to the increasing need for managed security services.
By Deployment Mode: The cloud deployment mode is experiencing faster growth due to its scalability, flexibility, and cost-effectiveness. On-premises deployments remain prevalent in certain sectors with stringent security requirements.
By Filtering Type: URL filtering is the most widely adopted filtering type, followed by DNS filtering. Keyword filtering and other filtering types are gaining traction as the sophistication of cyber threats increases.
Internet Filtering Software Industry Product Developments
Recent product innovations focus on enhancing threat detection capabilities through AI and machine learning, integrating advanced threat intelligence feeds, and improving usability and management features. Cloud-based solutions are becoming increasingly prevalent, offering enhanced scalability, flexibility, and cost-effectiveness. The market fit is strong, driven by the growing demand for comprehensive security solutions in diverse sectors facing increasing cyber threats.
Report Scope & Segmentation Analysis
This report comprehensively analyzes the Internet Filtering Software market across various segments: By Industry Vertical (BFSI, IT & Telecom, Government, Education, Other); By Component (Solution, Services); By Deployment Mode (Cloud, On-premises); and By Filtering Type (DNS Filtering, Keyword Filtering, URL Filtering, Other). Each segment's growth projections, market size, and competitive dynamics are detailed within the report. The market is projected to witness significant growth across all segments driven by increasing digitalization and the evolving threat landscape.
Key Drivers of Internet Filtering Software Industry Growth
The growth of the Internet Filtering Software market is driven by increasing cyber threats, stringent data privacy regulations (GDPR, CCPA), growing adoption of cloud computing, the rising use of connected devices, and increasing awareness of data security risks. The need for robust security measures across various sectors, from BFSI to education, fuels market expansion.
Challenges in the Internet Filtering Software Industry Sector
The industry faces challenges such as the ever-evolving nature of cyber threats, the complexity of managing security solutions, high implementation costs, and potential regulatory hurdles in different regions. Competition is intense, leading to pricing pressures. The market also faces the challenge of maintaining the balance between security and user experience.
Emerging Opportunities in Internet Filtering Software Industry
Emerging opportunities lie in the development of advanced threat detection and response capabilities using AI and machine learning, the integration of Internet Filtering Software with other security solutions, expansion into new geographic markets (particularly developing economies), and catering to the unique needs of specific industry verticals. The increasing adoption of IoT devices presents a substantial growth opportunity.
Leading Players in the Internet Filtering Software Industry Market
- Broadcom Corporation
- Barracuda Networks Inc
- Trustwave Holdings Inc
- Sophos Group Plc
- Trend Micro Inc
- Zscaler Inc
- Fortinet Inc
- McAfee Inc
- Cisco Systems Inc
- Webroot Inc
- AO Kaspersky Lab
- Forcepoint Inc
- Palo Alto Networks Inc
Key Developments in Internet Filtering Software Industry Industry
- 2022 Q3: Zscaler announces a new AI-powered threat detection capability.
- 2023 Q1: Fortinet acquires a smaller security vendor specializing in endpoint protection.
- 2024 Q2: New GDPR compliance regulations further impact the market, driving demand for compliant solutions.
- 2025 Q1: A significant merger takes place in the industry. Specific details are included in the full report.
Strategic Outlook for Internet Filtering Software Industry Market
The Internet Filtering Software market holds significant future potential, driven by continued technological advancements, the increasing reliance on internet connectivity across all sectors, and the persistent threat of cyberattacks. Opportunities exist for vendors that can offer comprehensive, integrated security solutions that address evolving cyber threats and comply with data privacy regulations. Focus on AI-driven solutions, enhanced user experiences, and tailored solutions for specific industries will be critical for success.
Internet Filtering Software Industry Segmentation
-
1. Component
- 1.1. Solution
- 1.2. Services
-
2. Deployment Mode
- 2.1. Cloud
- 2.2. On-premises
-
3. Filtering Type (Qualitative Study)
- 3.1. DNS Filtering
- 3.2. Keyword Filtering
- 3.3. URL Filtering
- 3.4. Other Filtering Types
-
4. Industry Vertical
- 4.1. BFSI
- 4.2. IT & Telecom
- 4.3. Government
- 4.4. Education
- 4.5. Other
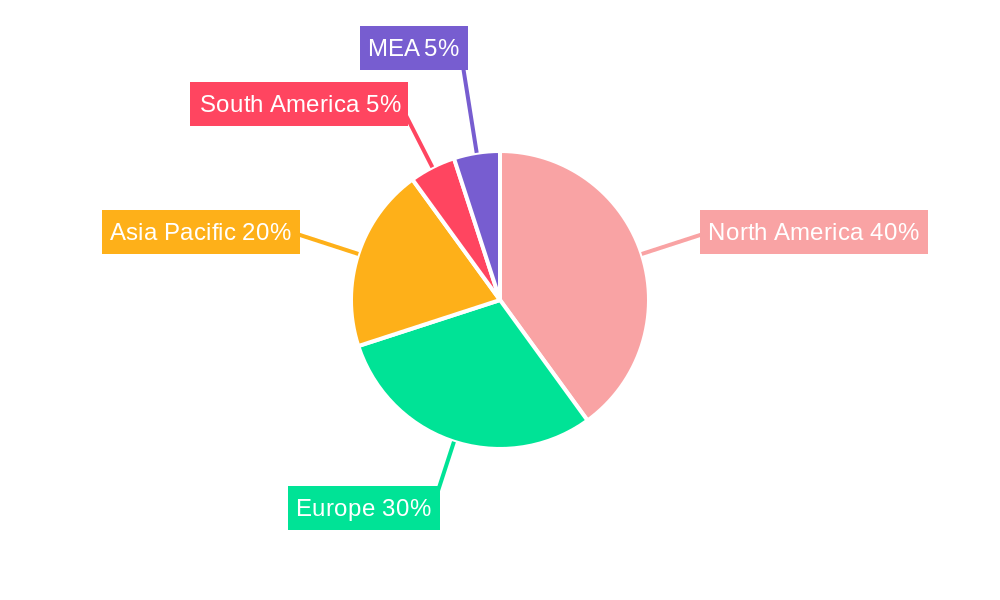
Internet Filtering Software Industry Segmentation By Geography
- 1. North America
- 2. Europe
- 3. Asia Pacific
- 4. Latin America
- 5. Middle East and Africa
Internet Filtering Software Industry REPORT HIGHLIGHTS
| Aspects | Details |
|---|---|
| Study Period | 2019-2033 |
| Base Year | 2024 |
| Estimated Year | 2025 |
| Forecast Period | 2025-2033 |
| Historical Period | 2019-2024 |
| Growth Rate | CAGR of 14.00% from 2019-2033 |
| Segmentation |
|
Table of Contents
- 1. Introduction
- 1.1. Research Scope
- 1.2. Market Segmentation
- 1.3. Research Methodology
- 1.4. Definitions and Assumptions
- 2. Executive Summary
- 2.1. Introduction
- 3. Market Dynamics
- 3.1. Introduction
- 3.2. Market Drivers
- 3.2.1. ; Strict Government Regulations and the Need for Compliance; Growing BYOD Trend; Growing Online Malware and the Increasing Refinement Levels of Web Attacks
- 3.3. Market Restrains
- 3.3.1. ; Absence of Technical Capabilities and Skills in Handling Complex and Changing Environments
- 3.4. Market Trends
- 3.4.1. BFSI to Drive the Market Growth
- 4. Market Factor Analysis
- 4.1. Porters Five Forces
- 4.2. Supply/Value Chain
- 4.3. PESTEL analysis
- 4.4. Market Entropy
- 4.5. Patent/Trademark Analysis
- 5. Global Internet Filtering Software Industry Analysis, Insights and Forecast, 2019-2031
- 5.1. Market Analysis, Insights and Forecast - by Component
- 5.1.1. Solution
- 5.1.2. Services
- 5.2. Market Analysis, Insights and Forecast - by Deployment Mode
- 5.2.1. Cloud
- 5.2.2. On-premises
- 5.3. Market Analysis, Insights and Forecast - by Filtering Type (Qualitative Study)
- 5.3.1. DNS Filtering
- 5.3.2. Keyword Filtering
- 5.3.3. URL Filtering
- 5.3.4. Other Filtering Types
- 5.4. Market Analysis, Insights and Forecast - by Industry Vertical
- 5.4.1. BFSI
- 5.4.2. IT & Telecom
- 5.4.3. Government
- 5.4.4. Education
- 5.4.5. Other
- 5.5. Market Analysis, Insights and Forecast - by Region
- 5.5.1. North America
- 5.5.2. Europe
- 5.5.3. Asia Pacific
- 5.5.4. Latin America
- 5.5.5. Middle East and Africa
- 5.1. Market Analysis, Insights and Forecast - by Component
- 6. North America Internet Filtering Software Industry Analysis, Insights and Forecast, 2019-2031
- 6.1. Market Analysis, Insights and Forecast - by Component
- 6.1.1. Solution
- 6.1.2. Services
- 6.2. Market Analysis, Insights and Forecast - by Deployment Mode
- 6.2.1. Cloud
- 6.2.2. On-premises
- 6.3. Market Analysis, Insights and Forecast - by Filtering Type (Qualitative Study)
- 6.3.1. DNS Filtering
- 6.3.2. Keyword Filtering
- 6.3.3. URL Filtering
- 6.3.4. Other Filtering Types
- 6.4. Market Analysis, Insights and Forecast - by Industry Vertical
- 6.4.1. BFSI
- 6.4.2. IT & Telecom
- 6.4.3. Government
- 6.4.4. Education
- 6.4.5. Other
- 6.1. Market Analysis, Insights and Forecast - by Component
- 7. Europe Internet Filtering Software Industry Analysis, Insights and Forecast, 2019-2031
- 7.1. Market Analysis, Insights and Forecast - by Component
- 7.1.1. Solution
- 7.1.2. Services
- 7.2. Market Analysis, Insights and Forecast - by Deployment Mode
- 7.2.1. Cloud
- 7.2.2. On-premises
- 7.3. Market Analysis, Insights and Forecast - by Filtering Type (Qualitative Study)
- 7.3.1. DNS Filtering
- 7.3.2. Keyword Filtering
- 7.3.3. URL Filtering
- 7.3.4. Other Filtering Types
- 7.4. Market Analysis, Insights and Forecast - by Industry Vertical
- 7.4.1. BFSI
- 7.4.2. IT & Telecom
- 7.4.3. Government
- 7.4.4. Education
- 7.4.5. Other
- 7.1. Market Analysis, Insights and Forecast - by Component
- 8. Asia Pacific Internet Filtering Software Industry Analysis, Insights and Forecast, 2019-2031
- 8.1. Market Analysis, Insights and Forecast - by Component
- 8.1.1. Solution
- 8.1.2. Services
- 8.2. Market Analysis, Insights and Forecast - by Deployment Mode
- 8.2.1. Cloud
- 8.2.2. On-premises
- 8.3. Market Analysis, Insights and Forecast - by Filtering Type (Qualitative Study)
- 8.3.1. DNS Filtering
- 8.3.2. Keyword Filtering
- 8.3.3. URL Filtering
- 8.3.4. Other Filtering Types
- 8.4. Market Analysis, Insights and Forecast - by Industry Vertical
- 8.4.1. BFSI
- 8.4.2. IT & Telecom
- 8.4.3. Government
- 8.4.4. Education
- 8.4.5. Other
- 8.1. Market Analysis, Insights and Forecast - by Component
- 9. Latin America Internet Filtering Software Industry Analysis, Insights and Forecast, 2019-2031
- 9.1. Market Analysis, Insights and Forecast - by Component
- 9.1.1. Solution
- 9.1.2. Services
- 9.2. Market Analysis, Insights and Forecast - by Deployment Mode
- 9.2.1. Cloud
- 9.2.2. On-premises
- 9.3. Market Analysis, Insights and Forecast - by Filtering Type (Qualitative Study)
- 9.3.1. DNS Filtering
- 9.3.2. Keyword Filtering
- 9.3.3. URL Filtering
- 9.3.4. Other Filtering Types
- 9.4. Market Analysis, Insights and Forecast - by Industry Vertical
- 9.4.1. BFSI
- 9.4.2. IT & Telecom
- 9.4.3. Government
- 9.4.4. Education
- 9.4.5. Other
- 9.1. Market Analysis, Insights and Forecast - by Component
- 10. Middle East and Africa Internet Filtering Software Industry Analysis, Insights and Forecast, 2019-2031
- 10.1. Market Analysis, Insights and Forecast - by Component
- 10.1.1. Solution
- 10.1.2. Services
- 10.2. Market Analysis, Insights and Forecast - by Deployment Mode
- 10.2.1. Cloud
- 10.2.2. On-premises
- 10.3. Market Analysis, Insights and Forecast - by Filtering Type (Qualitative Study)
- 10.3.1. DNS Filtering
- 10.3.2. Keyword Filtering
- 10.3.3. URL Filtering
- 10.3.4. Other Filtering Types
- 10.4. Market Analysis, Insights and Forecast - by Industry Vertical
- 10.4.1. BFSI
- 10.4.2. IT & Telecom
- 10.4.3. Government
- 10.4.4. Education
- 10.4.5. Other
- 10.1. Market Analysis, Insights and Forecast - by Component
- 11. North America Internet Filtering Software Industry Analysis, Insights and Forecast, 2019-2031
- 11.1. Market Analysis, Insights and Forecast - By Country/Sub-region
- 11.1.1 United States
- 11.1.2 Canada
- 11.1.3 Mexico
- 12. Europe Internet Filtering Software Industry Analysis, Insights and Forecast, 2019-2031
- 12.1. Market Analysis, Insights and Forecast - By Country/Sub-region
- 12.1.1 Germany
- 12.1.2 United Kingdom
- 12.1.3 France
- 12.1.4 Spain
- 12.1.5 Italy
- 12.1.6 Spain
- 12.1.7 Belgium
- 12.1.8 Netherland
- 12.1.9 Nordics
- 12.1.10 Rest of Europe
- 13. Asia Pacific Internet Filtering Software Industry Analysis, Insights and Forecast, 2019-2031
- 13.1. Market Analysis, Insights and Forecast - By Country/Sub-region
- 13.1.1 China
- 13.1.2 Japan
- 13.1.3 India
- 13.1.4 South Korea
- 13.1.5 Southeast Asia
- 13.1.6 Australia
- 13.1.7 Indonesia
- 13.1.8 Phillipes
- 13.1.9 Singapore
- 13.1.10 Thailandc
- 13.1.11 Rest of Asia Pacific
- 14. South America Internet Filtering Software Industry Analysis, Insights and Forecast, 2019-2031
- 14.1. Market Analysis, Insights and Forecast - By Country/Sub-region
- 14.1.1 Brazil
- 14.1.2 Argentina
- 14.1.3 Peru
- 14.1.4 Chile
- 14.1.5 Colombia
- 14.1.6 Ecuador
- 14.1.7 Venezuela
- 14.1.8 Rest of South America
- 15. North America Internet Filtering Software Industry Analysis, Insights and Forecast, 2019-2031
- 15.1. Market Analysis, Insights and Forecast - By Country/Sub-region
- 15.1.1 United States
- 15.1.2 Canada
- 15.1.3 Mexico
- 16. MEA Internet Filtering Software Industry Analysis, Insights and Forecast, 2019-2031
- 16.1. Market Analysis, Insights and Forecast - By Country/Sub-region
- 16.1.1 United Arab Emirates
- 16.1.2 Saudi Arabia
- 16.1.3 South Africa
- 16.1.4 Rest of Middle East and Africa
- 17. Competitive Analysis
- 17.1. Global Market Share Analysis 2024
- 17.2. Company Profiles
- 17.2.1 Broadcom Corporation
- 17.2.1.1. Overview
- 17.2.1.2. Products
- 17.2.1.3. SWOT Analysis
- 17.2.1.4. Recent Developments
- 17.2.1.5. Financials (Based on Availability)
- 17.2.2 Barracuda Networks Inc
- 17.2.2.1. Overview
- 17.2.2.2. Products
- 17.2.2.3. SWOT Analysis
- 17.2.2.4. Recent Developments
- 17.2.2.5. Financials (Based on Availability)
- 17.2.3 Trustwave Holdings Inc
- 17.2.3.1. Overview
- 17.2.3.2. Products
- 17.2.3.3. SWOT Analysis
- 17.2.3.4. Recent Developments
- 17.2.3.5. Financials (Based on Availability)
- 17.2.4 Sophos Group Plc
- 17.2.4.1. Overview
- 17.2.4.2. Products
- 17.2.4.3. SWOT Analysis
- 17.2.4.4. Recent Developments
- 17.2.4.5. Financials (Based on Availability)
- 17.2.5 Trend Micro Inc
- 17.2.5.1. Overview
- 17.2.5.2. Products
- 17.2.5.3. SWOT Analysis
- 17.2.5.4. Recent Developments
- 17.2.5.5. Financials (Based on Availability)
- 17.2.6 Zscaler Inc
- 17.2.6.1. Overview
- 17.2.6.2. Products
- 17.2.6.3. SWOT Analysis
- 17.2.6.4. Recent Developments
- 17.2.6.5. Financials (Based on Availability)
- 17.2.7 Fortinet Inc
- 17.2.7.1. Overview
- 17.2.7.2. Products
- 17.2.7.3. SWOT Analysis
- 17.2.7.4. Recent Developments
- 17.2.7.5. Financials (Based on Availability)
- 17.2.8 McAfee Inc
- 17.2.8.1. Overview
- 17.2.8.2. Products
- 17.2.8.3. SWOT Analysis
- 17.2.8.4. Recent Developments
- 17.2.8.5. Financials (Based on Availability)
- 17.2.9 Cisco Systems Inc
- 17.2.9.1. Overview
- 17.2.9.2. Products
- 17.2.9.3. SWOT Analysis
- 17.2.9.4. Recent Developments
- 17.2.9.5. Financials (Based on Availability)
- 17.2.10 Webroot Inc
- 17.2.10.1. Overview
- 17.2.10.2. Products
- 17.2.10.3. SWOT Analysis
- 17.2.10.4. Recent Developments
- 17.2.10.5. Financials (Based on Availability)
- 17.2.11 AO Kaspersky Lab
- 17.2.11.1. Overview
- 17.2.11.2. Products
- 17.2.11.3. SWOT Analysis
- 17.2.11.4. Recent Developments
- 17.2.11.5. Financials (Based on Availability)
- 17.2.12 Forcepoint Inc
- 17.2.12.1. Overview
- 17.2.12.2. Products
- 17.2.12.3. SWOT Analysis
- 17.2.12.4. Recent Developments
- 17.2.12.5. Financials (Based on Availability)
- 17.2.13 Palo Alto Networks Inc
- 17.2.13.1. Overview
- 17.2.13.2. Products
- 17.2.13.3. SWOT Analysis
- 17.2.13.4. Recent Developments
- 17.2.13.5. Financials (Based on Availability)
- 17.2.1 Broadcom Corporation
List of Figures
- Figure 1: Global Internet Filtering Software Industry Revenue Breakdown (Million, %) by Region 2024 & 2032
- Figure 2: North America Internet Filtering Software Industry Revenue (Million), by Country 2024 & 2032
- Figure 3: North America Internet Filtering Software Industry Revenue Share (%), by Country 2024 & 2032
- Figure 4: Europe Internet Filtering Software Industry Revenue (Million), by Country 2024 & 2032
- Figure 5: Europe Internet Filtering Software Industry Revenue Share (%), by Country 2024 & 2032
- Figure 6: Asia Pacific Internet Filtering Software Industry Revenue (Million), by Country 2024 & 2032
- Figure 7: Asia Pacific Internet Filtering Software Industry Revenue Share (%), by Country 2024 & 2032
- Figure 8: South America Internet Filtering Software Industry Revenue (Million), by Country 2024 & 2032
- Figure 9: South America Internet Filtering Software Industry Revenue Share (%), by Country 2024 & 2032
- Figure 10: North America Internet Filtering Software Industry Revenue (Million), by Country 2024 & 2032
- Figure 11: North America Internet Filtering Software Industry Revenue Share (%), by Country 2024 & 2032
- Figure 12: MEA Internet Filtering Software Industry Revenue (Million), by Country 2024 & 2032
- Figure 13: MEA Internet Filtering Software Industry Revenue Share (%), by Country 2024 & 2032
- Figure 14: North America Internet Filtering Software Industry Revenue (Million), by Component 2024 & 2032
- Figure 15: North America Internet Filtering Software Industry Revenue Share (%), by Component 2024 & 2032
- Figure 16: North America Internet Filtering Software Industry Revenue (Million), by Deployment Mode 2024 & 2032
- Figure 17: North America Internet Filtering Software Industry Revenue Share (%), by Deployment Mode 2024 & 2032
- Figure 18: North America Internet Filtering Software Industry Revenue (Million), by Filtering Type (Qualitative Study) 2024 & 2032
- Figure 19: North America Internet Filtering Software Industry Revenue Share (%), by Filtering Type (Qualitative Study) 2024 & 2032
- Figure 20: North America Internet Filtering Software Industry Revenue (Million), by Industry Vertical 2024 & 2032
- Figure 21: North America Internet Filtering Software Industry Revenue Share (%), by Industry Vertical 2024 & 2032
- Figure 22: North America Internet Filtering Software Industry Revenue (Million), by Country 2024 & 2032
- Figure 23: North America Internet Filtering Software Industry Revenue Share (%), by Country 2024 & 2032
- Figure 24: Europe Internet Filtering Software Industry Revenue (Million), by Component 2024 & 2032
- Figure 25: Europe Internet Filtering Software Industry Revenue Share (%), by Component 2024 & 2032
- Figure 26: Europe Internet Filtering Software Industry Revenue (Million), by Deployment Mode 2024 & 2032
- Figure 27: Europe Internet Filtering Software Industry Revenue Share (%), by Deployment Mode 2024 & 2032
- Figure 28: Europe Internet Filtering Software Industry Revenue (Million), by Filtering Type (Qualitative Study) 2024 & 2032
- Figure 29: Europe Internet Filtering Software Industry Revenue Share (%), by Filtering Type (Qualitative Study) 2024 & 2032
- Figure 30: Europe Internet Filtering Software Industry Revenue (Million), by Industry Vertical 2024 & 2032
- Figure 31: Europe Internet Filtering Software Industry Revenue Share (%), by Industry Vertical 2024 & 2032
- Figure 32: Europe Internet Filtering Software Industry Revenue (Million), by Country 2024 & 2032
- Figure 33: Europe Internet Filtering Software Industry Revenue Share (%), by Country 2024 & 2032
- Figure 34: Asia Pacific Internet Filtering Software Industry Revenue (Million), by Component 2024 & 2032
- Figure 35: Asia Pacific Internet Filtering Software Industry Revenue Share (%), by Component 2024 & 2032
- Figure 36: Asia Pacific Internet Filtering Software Industry Revenue (Million), by Deployment Mode 2024 & 2032
- Figure 37: Asia Pacific Internet Filtering Software Industry Revenue Share (%), by Deployment Mode 2024 & 2032
- Figure 38: Asia Pacific Internet Filtering Software Industry Revenue (Million), by Filtering Type (Qualitative Study) 2024 & 2032
- Figure 39: Asia Pacific Internet Filtering Software Industry Revenue Share (%), by Filtering Type (Qualitative Study) 2024 & 2032
- Figure 40: Asia Pacific Internet Filtering Software Industry Revenue (Million), by Industry Vertical 2024 & 2032
- Figure 41: Asia Pacific Internet Filtering Software Industry Revenue Share (%), by Industry Vertical 2024 & 2032
- Figure 42: Asia Pacific Internet Filtering Software Industry Revenue (Million), by Country 2024 & 2032
- Figure 43: Asia Pacific Internet Filtering Software Industry Revenue Share (%), by Country 2024 & 2032
- Figure 44: Latin America Internet Filtering Software Industry Revenue (Million), by Component 2024 & 2032
- Figure 45: Latin America Internet Filtering Software Industry Revenue Share (%), by Component 2024 & 2032
- Figure 46: Latin America Internet Filtering Software Industry Revenue (Million), by Deployment Mode 2024 & 2032
- Figure 47: Latin America Internet Filtering Software Industry Revenue Share (%), by Deployment Mode 2024 & 2032
- Figure 48: Latin America Internet Filtering Software Industry Revenue (Million), by Filtering Type (Qualitative Study) 2024 & 2032
- Figure 49: Latin America Internet Filtering Software Industry Revenue Share (%), by Filtering Type (Qualitative Study) 2024 & 2032
- Figure 50: Latin America Internet Filtering Software Industry Revenue (Million), by Industry Vertical 2024 & 2032
- Figure 51: Latin America Internet Filtering Software Industry Revenue Share (%), by Industry Vertical 2024 & 2032
- Figure 52: Latin America Internet Filtering Software Industry Revenue (Million), by Country 2024 & 2032
- Figure 53: Latin America Internet Filtering Software Industry Revenue Share (%), by Country 2024 & 2032
- Figure 54: Middle East and Africa Internet Filtering Software Industry Revenue (Million), by Component 2024 & 2032
- Figure 55: Middle East and Africa Internet Filtering Software Industry Revenue Share (%), by Component 2024 & 2032
- Figure 56: Middle East and Africa Internet Filtering Software Industry Revenue (Million), by Deployment Mode 2024 & 2032
- Figure 57: Middle East and Africa Internet Filtering Software Industry Revenue Share (%), by Deployment Mode 2024 & 2032
- Figure 58: Middle East and Africa Internet Filtering Software Industry Revenue (Million), by Filtering Type (Qualitative Study) 2024 & 2032
- Figure 59: Middle East and Africa Internet Filtering Software Industry Revenue Share (%), by Filtering Type (Qualitative Study) 2024 & 2032
- Figure 60: Middle East and Africa Internet Filtering Software Industry Revenue (Million), by Industry Vertical 2024 & 2032
- Figure 61: Middle East and Africa Internet Filtering Software Industry Revenue Share (%), by Industry Vertical 2024 & 2032
- Figure 62: Middle East and Africa Internet Filtering Software Industry Revenue (Million), by Country 2024 & 2032
- Figure 63: Middle East and Africa Internet Filtering Software Industry Revenue Share (%), by Country 2024 & 2032
List of Tables
- Table 1: Global Internet Filtering Software Industry Revenue Million Forecast, by Region 2019 & 2032
- Table 2: Global Internet Filtering Software Industry Revenue Million Forecast, by Component 2019 & 2032
- Table 3: Global Internet Filtering Software Industry Revenue Million Forecast, by Deployment Mode 2019 & 2032
- Table 4: Global Internet Filtering Software Industry Revenue Million Forecast, by Filtering Type (Qualitative Study) 2019 & 2032
- Table 5: Global Internet Filtering Software Industry Revenue Million Forecast, by Industry Vertical 2019 & 2032
- Table 6: Global Internet Filtering Software Industry Revenue Million Forecast, by Region 2019 & 2032
- Table 7: Global Internet Filtering Software Industry Revenue Million Forecast, by Country 2019 & 2032
- Table 8: United States Internet Filtering Software Industry Revenue (Million) Forecast, by Application 2019 & 2032
- Table 9: Canada Internet Filtering Software Industry Revenue (Million) Forecast, by Application 2019 & 2032
- Table 10: Mexico Internet Filtering Software Industry Revenue (Million) Forecast, by Application 2019 & 2032
- Table 11: Global Internet Filtering Software Industry Revenue Million Forecast, by Country 2019 & 2032
- Table 12: Germany Internet Filtering Software Industry Revenue (Million) Forecast, by Application 2019 & 2032
- Table 13: United Kingdom Internet Filtering Software Industry Revenue (Million) Forecast, by Application 2019 & 2032
- Table 14: France Internet Filtering Software Industry Revenue (Million) Forecast, by Application 2019 & 2032
- Table 15: Spain Internet Filtering Software Industry Revenue (Million) Forecast, by Application 2019 & 2032
- Table 16: Italy Internet Filtering Software Industry Revenue (Million) Forecast, by Application 2019 & 2032
- Table 17: Spain Internet Filtering Software Industry Revenue (Million) Forecast, by Application 2019 & 2032
- Table 18: Belgium Internet Filtering Software Industry Revenue (Million) Forecast, by Application 2019 & 2032
- Table 19: Netherland Internet Filtering Software Industry Revenue (Million) Forecast, by Application 2019 & 2032
- Table 20: Nordics Internet Filtering Software Industry Revenue (Million) Forecast, by Application 2019 & 2032
- Table 21: Rest of Europe Internet Filtering Software Industry Revenue (Million) Forecast, by Application 2019 & 2032
- Table 22: Global Internet Filtering Software Industry Revenue Million Forecast, by Country 2019 & 2032
- Table 23: China Internet Filtering Software Industry Revenue (Million) Forecast, by Application 2019 & 2032
- Table 24: Japan Internet Filtering Software Industry Revenue (Million) Forecast, by Application 2019 & 2032
- Table 25: India Internet Filtering Software Industry Revenue (Million) Forecast, by Application 2019 & 2032
- Table 26: South Korea Internet Filtering Software Industry Revenue (Million) Forecast, by Application 2019 & 2032
- Table 27: Southeast Asia Internet Filtering Software Industry Revenue (Million) Forecast, by Application 2019 & 2032
- Table 28: Australia Internet Filtering Software Industry Revenue (Million) Forecast, by Application 2019 & 2032
- Table 29: Indonesia Internet Filtering Software Industry Revenue (Million) Forecast, by Application 2019 & 2032
- Table 30: Phillipes Internet Filtering Software Industry Revenue (Million) Forecast, by Application 2019 & 2032
- Table 31: Singapore Internet Filtering Software Industry Revenue (Million) Forecast, by Application 2019 & 2032
- Table 32: Thailandc Internet Filtering Software Industry Revenue (Million) Forecast, by Application 2019 & 2032
- Table 33: Rest of Asia Pacific Internet Filtering Software Industry Revenue (Million) Forecast, by Application 2019 & 2032
- Table 34: Global Internet Filtering Software Industry Revenue Million Forecast, by Country 2019 & 2032
- Table 35: Brazil Internet Filtering Software Industry Revenue (Million) Forecast, by Application 2019 & 2032
- Table 36: Argentina Internet Filtering Software Industry Revenue (Million) Forecast, by Application 2019 & 2032
- Table 37: Peru Internet Filtering Software Industry Revenue (Million) Forecast, by Application 2019 & 2032
- Table 38: Chile Internet Filtering Software Industry Revenue (Million) Forecast, by Application 2019 & 2032
- Table 39: Colombia Internet Filtering Software Industry Revenue (Million) Forecast, by Application 2019 & 2032
- Table 40: Ecuador Internet Filtering Software Industry Revenue (Million) Forecast, by Application 2019 & 2032
- Table 41: Venezuela Internet Filtering Software Industry Revenue (Million) Forecast, by Application 2019 & 2032
- Table 42: Rest of South America Internet Filtering Software Industry Revenue (Million) Forecast, by Application 2019 & 2032
- Table 43: Global Internet Filtering Software Industry Revenue Million Forecast, by Country 2019 & 2032
- Table 44: United States Internet Filtering Software Industry Revenue (Million) Forecast, by Application 2019 & 2032
- Table 45: Canada Internet Filtering Software Industry Revenue (Million) Forecast, by Application 2019 & 2032
- Table 46: Mexico Internet Filtering Software Industry Revenue (Million) Forecast, by Application 2019 & 2032
- Table 47: Global Internet Filtering Software Industry Revenue Million Forecast, by Country 2019 & 2032
- Table 48: United Arab Emirates Internet Filtering Software Industry Revenue (Million) Forecast, by Application 2019 & 2032
- Table 49: Saudi Arabia Internet Filtering Software Industry Revenue (Million) Forecast, by Application 2019 & 2032
- Table 50: South Africa Internet Filtering Software Industry Revenue (Million) Forecast, by Application 2019 & 2032
- Table 51: Rest of Middle East and Africa Internet Filtering Software Industry Revenue (Million) Forecast, by Application 2019 & 2032
- Table 52: Global Internet Filtering Software Industry Revenue Million Forecast, by Component 2019 & 2032
- Table 53: Global Internet Filtering Software Industry Revenue Million Forecast, by Deployment Mode 2019 & 2032
- Table 54: Global Internet Filtering Software Industry Revenue Million Forecast, by Filtering Type (Qualitative Study) 2019 & 2032
- Table 55: Global Internet Filtering Software Industry Revenue Million Forecast, by Industry Vertical 2019 & 2032
- Table 56: Global Internet Filtering Software Industry Revenue Million Forecast, by Country 2019 & 2032
- Table 57: Global Internet Filtering Software Industry Revenue Million Forecast, by Component 2019 & 2032
- Table 58: Global Internet Filtering Software Industry Revenue Million Forecast, by Deployment Mode 2019 & 2032
- Table 59: Global Internet Filtering Software Industry Revenue Million Forecast, by Filtering Type (Qualitative Study) 2019 & 2032
- Table 60: Global Internet Filtering Software Industry Revenue Million Forecast, by Industry Vertical 2019 & 2032
- Table 61: Global Internet Filtering Software Industry Revenue Million Forecast, by Country 2019 & 2032
- Table 62: Global Internet Filtering Software Industry Revenue Million Forecast, by Component 2019 & 2032
- Table 63: Global Internet Filtering Software Industry Revenue Million Forecast, by Deployment Mode 2019 & 2032
- Table 64: Global Internet Filtering Software Industry Revenue Million Forecast, by Filtering Type (Qualitative Study) 2019 & 2032
- Table 65: Global Internet Filtering Software Industry Revenue Million Forecast, by Industry Vertical 2019 & 2032
- Table 66: Global Internet Filtering Software Industry Revenue Million Forecast, by Country 2019 & 2032
- Table 67: Global Internet Filtering Software Industry Revenue Million Forecast, by Component 2019 & 2032
- Table 68: Global Internet Filtering Software Industry Revenue Million Forecast, by Deployment Mode 2019 & 2032
- Table 69: Global Internet Filtering Software Industry Revenue Million Forecast, by Filtering Type (Qualitative Study) 2019 & 2032
- Table 70: Global Internet Filtering Software Industry Revenue Million Forecast, by Industry Vertical 2019 & 2032
- Table 71: Global Internet Filtering Software Industry Revenue Million Forecast, by Country 2019 & 2032
- Table 72: Global Internet Filtering Software Industry Revenue Million Forecast, by Component 2019 & 2032
- Table 73: Global Internet Filtering Software Industry Revenue Million Forecast, by Deployment Mode 2019 & 2032
- Table 74: Global Internet Filtering Software Industry Revenue Million Forecast, by Filtering Type (Qualitative Study) 2019 & 2032
- Table 75: Global Internet Filtering Software Industry Revenue Million Forecast, by Industry Vertical 2019 & 2032
- Table 76: Global Internet Filtering Software Industry Revenue Million Forecast, by Country 2019 & 2032
Frequently Asked Questions
1. What is the projected Compound Annual Growth Rate (CAGR) of the Internet Filtering Software Industry?
The projected CAGR is approximately 14.00%.
2. Which companies are prominent players in the Internet Filtering Software Industry?
Key companies in the market include Broadcom Corporation, Barracuda Networks Inc, Trustwave Holdings Inc, Sophos Group Plc, Trend Micro Inc, Zscaler Inc, Fortinet Inc, McAfee Inc, Cisco Systems Inc, Webroot Inc, AO Kaspersky Lab, Forcepoint Inc, Palo Alto Networks Inc.
3. What are the main segments of the Internet Filtering Software Industry?
The market segments include Component, Deployment Mode , Filtering Type (Qualitative Study), Industry Vertical.
4. Can you provide details about the market size?
The market size is estimated to be USD XX Million as of 2022.
5. What are some drivers contributing to market growth?
; Strict Government Regulations and the Need for Compliance; Growing BYOD Trend; Growing Online Malware and the Increasing Refinement Levels of Web Attacks.
6. What are the notable trends driving market growth?
BFSI to Drive the Market Growth.
7. Are there any restraints impacting market growth?
; Absence of Technical Capabilities and Skills in Handling Complex and Changing Environments.
8. Can you provide examples of recent developments in the market?
N/A
9. What pricing options are available for accessing the report?
Pricing options include single-user, multi-user, and enterprise licenses priced at USD 4750, USD 5250, and USD 8750 respectively.
10. Is the market size provided in terms of value or volume?
The market size is provided in terms of value, measured in Million.
11. Are there any specific market keywords associated with the report?
Yes, the market keyword associated with the report is "Internet Filtering Software Industry," which aids in identifying and referencing the specific market segment covered.
12. How do I determine which pricing option suits my needs best?
The pricing options vary based on user requirements and access needs. Individual users may opt for single-user licenses, while businesses requiring broader access may choose multi-user or enterprise licenses for cost-effective access to the report.
13. Are there any additional resources or data provided in the Internet Filtering Software Industry report?
While the report offers comprehensive insights, it's advisable to review the specific contents or supplementary materials provided to ascertain if additional resources or data are available.
14. How can I stay updated on further developments or reports in the Internet Filtering Software Industry?
To stay informed about further developments, trends, and reports in the Internet Filtering Software Industry, consider subscribing to industry newsletters, following relevant companies and organizations, or regularly checking reputable industry news sources and publications.
Methodology
Step 1 - Identification of Relevant Samples Size from Population Database


Step 2 - Approaches for Defining Global Market Size (Value, Volume* & Price*)

Note*: In applicable scenarios
Step 3 - Data Sources
Primary Research
- Web Analytics
- Survey Reports
- Research Institute
- Latest Research Reports
- Opinion Leaders
Secondary Research
- Annual Reports
- White Paper
- Latest Press Release
- Industry Association
- Paid Database
- Investor Presentations

Step 4 - Data Triangulation
Involves using different sources of information in order to increase the validity of a study
These sources are likely to be stakeholders in a program - participants, other researchers, program staff, other community members, and so on.
Then we put all data in single framework & apply various statistical tools to find out the dynamic on the market.
During the analysis stage, feedback from the stakeholder groups would be compared to determine areas of agreement as well as areas of divergence


