
Key Insights
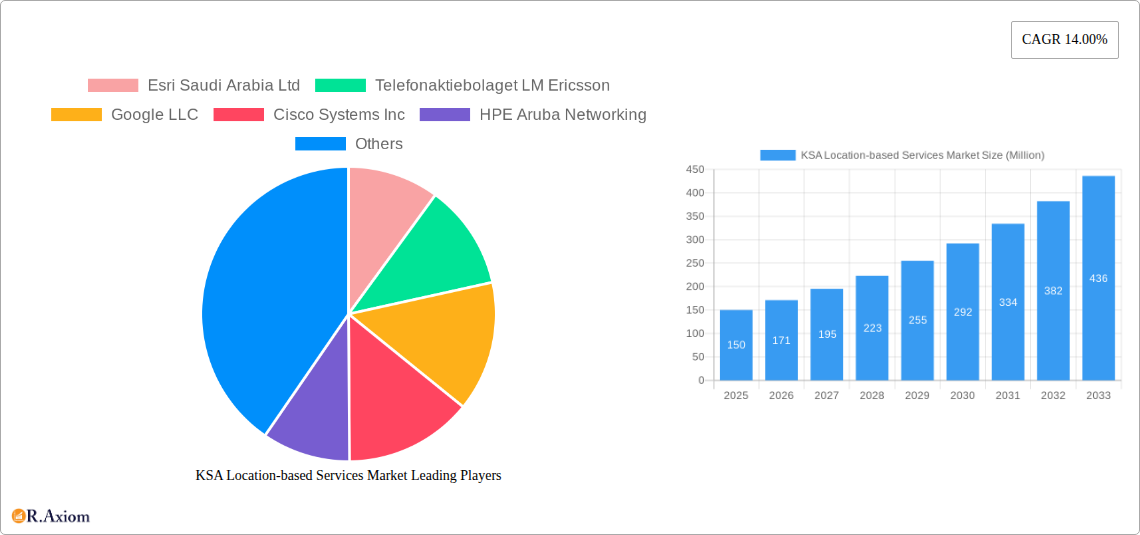
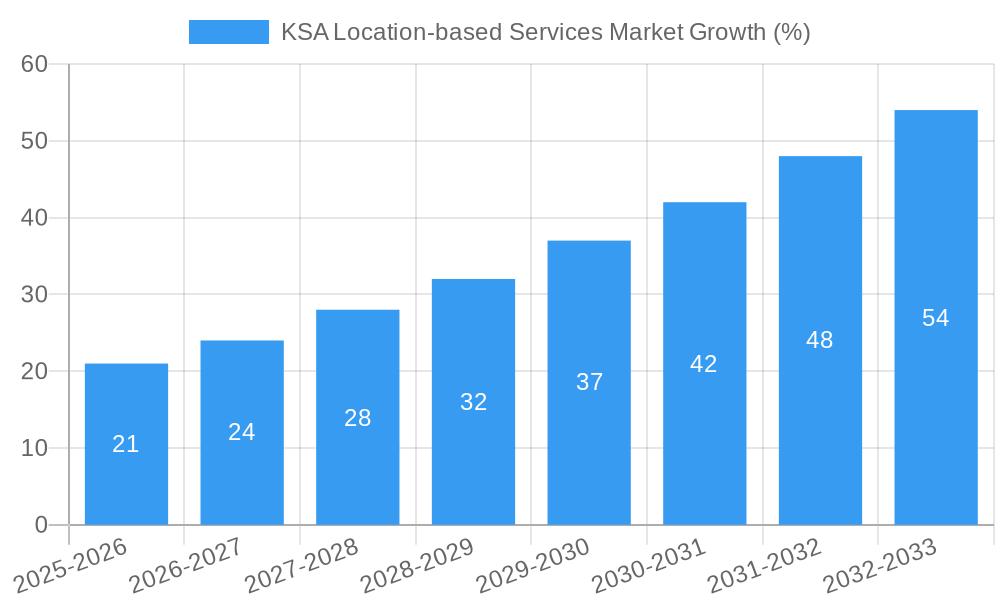
The Kingdom of Saudi Arabia (KSA) location-based services (LBS) market is experiencing robust growth, driven by increasing smartphone penetration, expanding digital infrastructure, and the government's Vision 2030 initiative, which promotes digital transformation across various sectors. The market, valued at approximately $X million in 2025, is projected to witness a Compound Annual Growth Rate (CAGR) of 14% from 2025 to 2033, reaching a substantial size by the end of the forecast period. Key growth drivers include the burgeoning transportation and logistics sector, the rapid adoption of LBS in smart city initiatives, and the increasing demand for location-based advertising and analytics across various industries. The significant investments in 5G network infrastructure further bolster the market’s expansion by enabling high-speed data transfer and real-time location tracking. Segmentation reveals a significant contribution from the hardware component, with software and services following closely. While indoor LBS applications are currently more prevalent, the outdoor segment is anticipated to witness considerable growth due to increasing adoption in navigation and smart city management.
The KSA LBS market shows strong potential across diverse application segments. Mapping and navigation continue to be dominant, but business intelligence and analytics are rapidly gaining traction, fuelled by the need for data-driven decision-making in various sectors. Location-based advertising and social networking/entertainment are also contributing significantly to the overall market growth. Key players, including Esri Saudi Arabia, Ericsson, Google, Cisco, and IBM, are actively shaping the market landscape through technological innovations and strategic partnerships. The government's initiatives focused on enhancing digital literacy and promoting technological advancements are further catalyzing the adoption of LBS across diverse demographics. While the market faces certain challenges, such as data privacy concerns and the need for robust cybersecurity measures, the overall growth outlook remains positive, particularly considering the considerable investment and ongoing digitalization efforts within the kingdom. This presents lucrative opportunities for both established players and new entrants in the dynamic KSA LBS market.
KSA Location-based Services Market: A Comprehensive Report (2019-2033)
This detailed report provides a comprehensive analysis of the Kingdom of Saudi Arabia (KSA) location-based services market, offering invaluable insights for industry stakeholders, investors, and strategic decision-makers. With a study period spanning 2019-2033, a base year of 2025, and a forecast period of 2025-2033, this report delivers actionable intelligence on market size, growth projections, segment performance, and competitive dynamics. The report leverages extensive data analysis and incorporates key industry developments to provide a holistic view of this rapidly evolving market.
KSA Location-based Services Market Concentration & Innovation
The KSA location-based services market exhibits a moderately concentrated landscape, with a few dominant players alongside several smaller, specialized firms. Market share is dynamically shifting, influenced by technological advancements, strategic partnerships, and government initiatives. Innovation is driven by the increasing demand for precise location data across various sectors. This is further fueled by advancements in technologies like 5G, IoT, and AI, enhancing the capabilities of location-based services.
The regulatory framework in KSA plays a crucial role, promoting both technological advancement and data privacy. While direct product substitutes are limited, alternative solutions like traditional mapping and communication methods pose indirect competition. End-user trends towards increased digitization and data-driven decision-making are pushing the market forward. M&A activity in the sector remains moderate, with deal values ranging from xx Million to xx Million in recent years, reflecting strategic consolidation and expansion efforts by major players. Examples include:
- Market Share (Estimated 2025): Google LLC (25%), Esri Saudi Arabia Ltd (15%), Cisco Systems Inc (10%), Others (50%). (Note: these figures are estimations)
- Recent M&A Activities: While specific deal values are unavailable for public disclosure, several strategic partnerships indicate a growing market consolidation.
KSA Location-based Services Market Industry Trends & Insights
The KSA location-based services market is experiencing robust growth, driven by several key factors. The burgeoning digital economy, coupled with the Kingdom's Vision 2030 initiative focused on digital transformation, significantly fuels market expansion. This has resulted in a Compound Annual Growth Rate (CAGR) of xx% during the historical period (2019-2024) and is projected to continue at a CAGR of xx% during the forecast period (2025-2033). Market penetration remains relatively high in urban areas, but substantial growth potential exists in rural regions. Technological disruptions, including the adoption of 5G networks and advancements in AI-powered analytics, are constantly reshaping the competitive landscape. Consumer preferences are increasingly tilted towards personalized and context-aware location services, demanding greater accuracy and enhanced user experiences. Competitive dynamics are characterized by both intense competition among established players and the emergence of innovative niche players.
Dominant Markets & Segments in KSA Location-based Services Market
The Transportation and Logistics sector is currently the dominant end-user segment, driven by the need for efficient fleet management, route optimization, and real-time tracking. The Government sector also exhibits significant growth, leveraging location-based services for public safety, urban planning, and smart city initiatives.
- By End-User: Transportation and Logistics (30%), Government (25%), IT and Telecom (15%), Healthcare (10%), BFSI (5%), Others (15%).
- By Component: Software (40%), Services (35%), Hardware (25%).
- By Location: Outdoor (60%), Indoor (40%).
- By Application: Mapping and Navigation (35%), Business Intelligence and Analytics (25%), Location-based Advertising (20%), Others (20%).
Key Drivers:
- Government Initiatives: Vision 2030's focus on digital transformation and smart city development.
- Infrastructure Development: Expanding 5G network coverage and improved digital infrastructure.
- Economic Growth: Increased investment in technology and infrastructure projects.
KSA Location-based Services Market Product Developments
Recent product innovations focus on integrating AI and machine learning capabilities into location-based services to enhance accuracy, personalization, and predictive analytics. This trend is significantly improving the market fit for various applications, such as smart transportation systems, asset tracking, and targeted advertising. Competitive advantages are primarily achieved through advanced data analytics, sophisticated mapping technologies, and seamless integration with other digital platforms.
Report Scope & Segmentation Analysis
This report comprehensively analyzes the KSA location-based services market across various segments:
- By End-User: Each end-user segment exhibits unique growth trajectories, with Transportation and Logistics and Government sectors leading the way. Market sizes and competitive dynamics are analyzed for each segment.
- By Component: The Software segment is expected to witness the fastest growth, driven by the increasing demand for sophisticated location analytics and mapping solutions.
- By Location: Both indoor and outdoor location services are experiencing growth, with indoor location services showing strong potential due to the expansion of smart buildings and indoor navigation systems.
- By Application: Mapping and Navigation remains a dominant application, while Business Intelligence and Analytics shows significant growth potential.
Key Drivers of KSA Location-based Services Market Growth
The KSA location-based services market's growth is fueled by technological advancements (5G, IoT, AI), supportive government policies (Vision 2030), and the increasing adoption of digital technologies across various sectors. The rising demand for efficient logistics, smart city initiatives, and personalized user experiences further contribute to market expansion.
Challenges in the KSA Location-based Services Market Sector
Challenges include data privacy concerns, the need for robust cybersecurity measures, and potential regulatory hurdles related to data usage and location tracking. Supply chain disruptions can also impact the availability of hardware components, while competition from established and emerging players necessitates continuous innovation and strategic partnerships. These factors collectively impact market growth, although the overall impact is difficult to quantify precisely.
Emerging Opportunities in KSA Location-based Services Market
Emerging opportunities encompass the expanding adoption of location-based services in the healthcare, BFSI, and hospitality sectors. The integration of augmented reality (AR) and virtual reality (VR) technologies offers new avenues for innovative applications. Furthermore, the growing adoption of location-based marketing and advertising presents significant growth potential.
Leading Players in the KSA Location-based Services Market Market
- Esri Saudi Arabia Ltd
- Telefonaktiebolaget LM Ericsson
- Google LLC
- Cisco Systems Inc
- HPE Aruba Networking
- IBM Corporation
- Max GPS Track
- Zebra Technologies Corp
- Location Solutions Telemetics LLC
- ALE International
Key Developments in KSA Location-based Services Market Industry
- January 2023: MDS for Computer Systems LLC partnered with Cisco Systems to implement location-based solutions at Almoosa Specialist Hospital, showcasing increasing demand in healthcare.
- December 2022: beaconsmind AG secured a contract with Kamal Osman Jamjoom Group, expanding its market presence in the retail sector.
Strategic Outlook for KSA Location-based Services Market Market
The KSA location-based services market is poised for substantial growth, driven by continued technological advancements, supportive government policies, and the expanding adoption of location-based solutions across various sectors. The focus on smart city development, coupled with increasing investments in digital infrastructure, will further propel market expansion, presenting significant opportunities for both established players and new entrants.
KSA Location-based Services Market Segmentation
-
1. Component
- 1.1. Hardware
- 1.2. Software
- 1.3. Services
-
2. Location
- 2.1. Indoor
- 2.2. Outdoor
-
3. Application
- 3.1. Mapping and Navigation
- 3.2. Business Intelligence and Analytics
- 3.3. Location-based Advertising
- 3.4. Social Networking and Entertainment
- 3.5. Other Applications
-
4. End-User
- 4.1. Transportation and Logistics
- 4.2. IT and Telecom
- 4.3. Healthcare
- 4.4. Government
- 4.5. BFSI
- 4.6. Hospitality
- 4.7. Manufacturing
- 4.8. Other End-User Industries
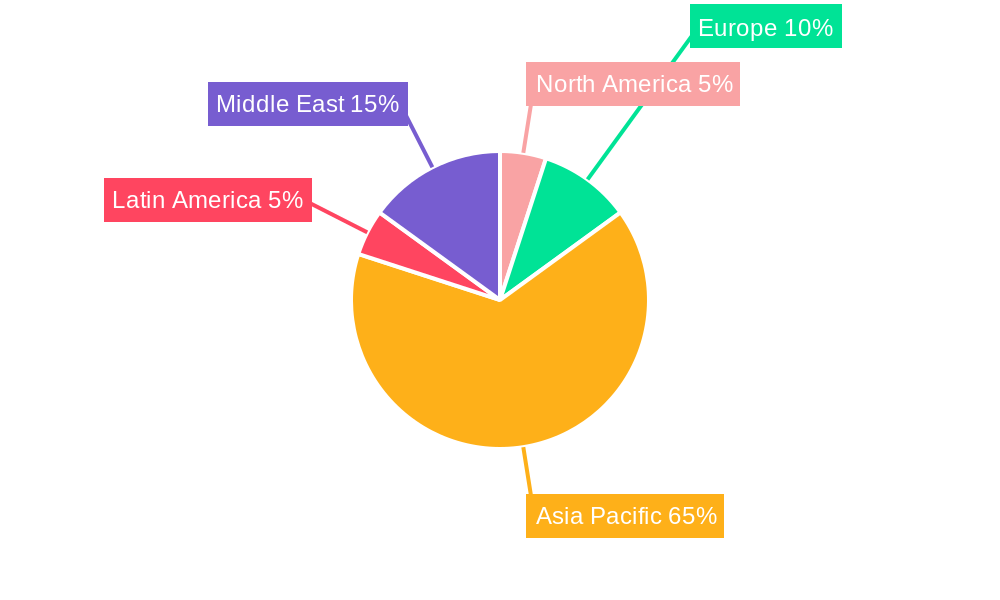
KSA Location-based Services Market Segmentation By Geography
-
1. North America
- 1.1. United States
- 1.2. Canada
- 1.3. Mexico
-
2. South America
- 2.1. Brazil
- 2.2. Argentina
- 2.3. Rest of South America
-
3. Europe
- 3.1. United Kingdom
- 3.2. Germany
- 3.3. France
- 3.4. Italy
- 3.5. Spain
- 3.6. Russia
- 3.7. Benelux
- 3.8. Nordics
- 3.9. Rest of Europe
-
4. Middle East & Africa
- 4.1. Turkey
- 4.2. Israel
- 4.3. GCC
- 4.4. North Africa
- 4.5. South Africa
- 4.6. Rest of Middle East & Africa
-
5. Asia Pacific
- 5.1. China
- 5.2. India
- 5.3. Japan
- 5.4. South Korea
- 5.5. ASEAN
- 5.6. Oceania
- 5.7. Rest of Asia Pacific
KSA Location-based Services Market REPORT HIGHLIGHTS
| Aspects | Details |
|---|---|
| Study Period | 2019-2033 |
| Base Year | 2024 |
| Estimated Year | 2025 |
| Forecast Period | 2025-2033 |
| Historical Period | 2019-2024 |
| Growth Rate | CAGR of 14.00% from 2019-2033 |
| Segmentation |
|
Table of Contents
- 1. Introduction
- 1.1. Research Scope
- 1.2. Market Segmentation
- 1.3. Research Methodology
- 1.4. Definitions and Assumptions
- 2. Executive Summary
- 2.1. Introduction
- 3. Market Dynamics
- 3.1. Introduction
- 3.2. Market Drivers
- 3.2.1. The development of Smart City Projects in The Country is Driving The Market Growth; The Growing Trend of Digitalisation in the Country Supported by the Adoption of Smart Connected Devices
- 3.3. Market Restrains
- 3.3.1. The Risk of Data Privacy Breaching Due to the Use of Location Data in the Solutions; The Non-Availability of Good Network Connectivity in the Rural Areas of the Country
- 3.4. Market Trends
- 3.4.1. The development of Smart City Projects in The Country is Driving the Market Growth
- 4. Market Factor Analysis
- 4.1. Porters Five Forces
- 4.2. Supply/Value Chain
- 4.3. PESTEL analysis
- 4.4. Market Entropy
- 4.5. Patent/Trademark Analysis
- 5. Global KSA Location-based Services Market Analysis, Insights and Forecast, 2019-2031
- 5.1. Market Analysis, Insights and Forecast - by Component
- 5.1.1. Hardware
- 5.1.2. Software
- 5.1.3. Services
- 5.2. Market Analysis, Insights and Forecast - by Location
- 5.2.1. Indoor
- 5.2.2. Outdoor
- 5.3. Market Analysis, Insights and Forecast - by Application
- 5.3.1. Mapping and Navigation
- 5.3.2. Business Intelligence and Analytics
- 5.3.3. Location-based Advertising
- 5.3.4. Social Networking and Entertainment
- 5.3.5. Other Applications
- 5.4. Market Analysis, Insights and Forecast - by End-User
- 5.4.1. Transportation and Logistics
- 5.4.2. IT and Telecom
- 5.4.3. Healthcare
- 5.4.4. Government
- 5.4.5. BFSI
- 5.4.6. Hospitality
- 5.4.7. Manufacturing
- 5.4.8. Other End-User Industries
- 5.5. Market Analysis, Insights and Forecast - by Region
- 5.5.1. North America
- 5.5.2. South America
- 5.5.3. Europe
- 5.5.4. Middle East & Africa
- 5.5.5. Asia Pacific
- 5.1. Market Analysis, Insights and Forecast - by Component
- 6. North America KSA Location-based Services Market Analysis, Insights and Forecast, 2019-2031
- 6.1. Market Analysis, Insights and Forecast - by Component
- 6.1.1. Hardware
- 6.1.2. Software
- 6.1.3. Services
- 6.2. Market Analysis, Insights and Forecast - by Location
- 6.2.1. Indoor
- 6.2.2. Outdoor
- 6.3. Market Analysis, Insights and Forecast - by Application
- 6.3.1. Mapping and Navigation
- 6.3.2. Business Intelligence and Analytics
- 6.3.3. Location-based Advertising
- 6.3.4. Social Networking and Entertainment
- 6.3.5. Other Applications
- 6.4. Market Analysis, Insights and Forecast - by End-User
- 6.4.1. Transportation and Logistics
- 6.4.2. IT and Telecom
- 6.4.3. Healthcare
- 6.4.4. Government
- 6.4.5. BFSI
- 6.4.6. Hospitality
- 6.4.7. Manufacturing
- 6.4.8. Other End-User Industries
- 6.1. Market Analysis, Insights and Forecast - by Component
- 7. South America KSA Location-based Services Market Analysis, Insights and Forecast, 2019-2031
- 7.1. Market Analysis, Insights and Forecast - by Component
- 7.1.1. Hardware
- 7.1.2. Software
- 7.1.3. Services
- 7.2. Market Analysis, Insights and Forecast - by Location
- 7.2.1. Indoor
- 7.2.2. Outdoor
- 7.3. Market Analysis, Insights and Forecast - by Application
- 7.3.1. Mapping and Navigation
- 7.3.2. Business Intelligence and Analytics
- 7.3.3. Location-based Advertising
- 7.3.4. Social Networking and Entertainment
- 7.3.5. Other Applications
- 7.4. Market Analysis, Insights and Forecast - by End-User
- 7.4.1. Transportation and Logistics
- 7.4.2. IT and Telecom
- 7.4.3. Healthcare
- 7.4.4. Government
- 7.4.5. BFSI
- 7.4.6. Hospitality
- 7.4.7. Manufacturing
- 7.4.8. Other End-User Industries
- 7.1. Market Analysis, Insights and Forecast - by Component
- 8. Europe KSA Location-based Services Market Analysis, Insights and Forecast, 2019-2031
- 8.1. Market Analysis, Insights and Forecast - by Component
- 8.1.1. Hardware
- 8.1.2. Software
- 8.1.3. Services
- 8.2. Market Analysis, Insights and Forecast - by Location
- 8.2.1. Indoor
- 8.2.2. Outdoor
- 8.3. Market Analysis, Insights and Forecast - by Application
- 8.3.1. Mapping and Navigation
- 8.3.2. Business Intelligence and Analytics
- 8.3.3. Location-based Advertising
- 8.3.4. Social Networking and Entertainment
- 8.3.5. Other Applications
- 8.4. Market Analysis, Insights and Forecast - by End-User
- 8.4.1. Transportation and Logistics
- 8.4.2. IT and Telecom
- 8.4.3. Healthcare
- 8.4.4. Government
- 8.4.5. BFSI
- 8.4.6. Hospitality
- 8.4.7. Manufacturing
- 8.4.8. Other End-User Industries
- 8.1. Market Analysis, Insights and Forecast - by Component
- 9. Middle East & Africa KSA Location-based Services Market Analysis, Insights and Forecast, 2019-2031
- 9.1. Market Analysis, Insights and Forecast - by Component
- 9.1.1. Hardware
- 9.1.2. Software
- 9.1.3. Services
- 9.2. Market Analysis, Insights and Forecast - by Location
- 9.2.1. Indoor
- 9.2.2. Outdoor
- 9.3. Market Analysis, Insights and Forecast - by Application
- 9.3.1. Mapping and Navigation
- 9.3.2. Business Intelligence and Analytics
- 9.3.3. Location-based Advertising
- 9.3.4. Social Networking and Entertainment
- 9.3.5. Other Applications
- 9.4. Market Analysis, Insights and Forecast - by End-User
- 9.4.1. Transportation and Logistics
- 9.4.2. IT and Telecom
- 9.4.3. Healthcare
- 9.4.4. Government
- 9.4.5. BFSI
- 9.4.6. Hospitality
- 9.4.7. Manufacturing
- 9.4.8. Other End-User Industries
- 9.1. Market Analysis, Insights and Forecast - by Component
- 10. Asia Pacific KSA Location-based Services Market Analysis, Insights and Forecast, 2019-2031
- 10.1. Market Analysis, Insights and Forecast - by Component
- 10.1.1. Hardware
- 10.1.2. Software
- 10.1.3. Services
- 10.2. Market Analysis, Insights and Forecast - by Location
- 10.2.1. Indoor
- 10.2.2. Outdoor
- 10.3. Market Analysis, Insights and Forecast - by Application
- 10.3.1. Mapping and Navigation
- 10.3.2. Business Intelligence and Analytics
- 10.3.3. Location-based Advertising
- 10.3.4. Social Networking and Entertainment
- 10.3.5. Other Applications
- 10.4. Market Analysis, Insights and Forecast - by End-User
- 10.4.1. Transportation and Logistics
- 10.4.2. IT and Telecom
- 10.4.3. Healthcare
- 10.4.4. Government
- 10.4.5. BFSI
- 10.4.6. Hospitality
- 10.4.7. Manufacturing
- 10.4.8. Other End-User Industries
- 10.1. Market Analysis, Insights and Forecast - by Component
- 11. North America KSA Location-based Services Market Analysis, Insights and Forecast, 2019-2031
- 11.1. Market Analysis, Insights and Forecast - By Country/Sub-region
- 11.1.1.
- 12. Europe KSA Location-based Services Market Analysis, Insights and Forecast, 2019-2031
- 12.1. Market Analysis, Insights and Forecast - By Country/Sub-region
- 12.1.1.
- 13. Asia Pacific KSA Location-based Services Market Analysis, Insights and Forecast, 2019-2031
- 13.1. Market Analysis, Insights and Forecast - By Country/Sub-region
- 13.1.1.
- 14. Latin America KSA Location-based Services Market Analysis, Insights and Forecast, 2019-2031
- 14.1. Market Analysis, Insights and Forecast - By Country/Sub-region
- 14.1.1.
- 15. Middle East KSA Location-based Services Market Analysis, Insights and Forecast, 2019-2031
- 15.1. Market Analysis, Insights and Forecast - By Country/Sub-region
- 15.1.1.
- 16. Competitive Analysis
- 16.1. Global Market Share Analysis 2024
- 16.2. Company Profiles
- 16.2.1 Esri Saudi Arabia Ltd
- 16.2.1.1. Overview
- 16.2.1.2. Products
- 16.2.1.3. SWOT Analysis
- 16.2.1.4. Recent Developments
- 16.2.1.5. Financials (Based on Availability)
- 16.2.2 Telefonaktiebolaget LM Ericsson
- 16.2.2.1. Overview
- 16.2.2.2. Products
- 16.2.2.3. SWOT Analysis
- 16.2.2.4. Recent Developments
- 16.2.2.5. Financials (Based on Availability)
- 16.2.3 Google LLC
- 16.2.3.1. Overview
- 16.2.3.2. Products
- 16.2.3.3. SWOT Analysis
- 16.2.3.4. Recent Developments
- 16.2.3.5. Financials (Based on Availability)
- 16.2.4 Cisco Systems Inc
- 16.2.4.1. Overview
- 16.2.4.2. Products
- 16.2.4.3. SWOT Analysis
- 16.2.4.4. Recent Developments
- 16.2.4.5. Financials (Based on Availability)
- 16.2.5 HPE Aruba Networking
- 16.2.5.1. Overview
- 16.2.5.2. Products
- 16.2.5.3. SWOT Analysis
- 16.2.5.4. Recent Developments
- 16.2.5.5. Financials (Based on Availability)
- 16.2.6 IBM Corporation
- 16.2.6.1. Overview
- 16.2.6.2. Products
- 16.2.6.3. SWOT Analysis
- 16.2.6.4. Recent Developments
- 16.2.6.5. Financials (Based on Availability)
- 16.2.7 Max GPS Track
- 16.2.7.1. Overview
- 16.2.7.2. Products
- 16.2.7.3. SWOT Analysis
- 16.2.7.4. Recent Developments
- 16.2.7.5. Financials (Based on Availability)
- 16.2.8 Zebra Technologies Corp
- 16.2.8.1. Overview
- 16.2.8.2. Products
- 16.2.8.3. SWOT Analysis
- 16.2.8.4. Recent Developments
- 16.2.8.5. Financials (Based on Availability)
- 16.2.9 Location Solutions Telemetics LLC
- 16.2.9.1. Overview
- 16.2.9.2. Products
- 16.2.9.3. SWOT Analysis
- 16.2.9.4. Recent Developments
- 16.2.9.5. Financials (Based on Availability)
- 16.2.10 ALE International
- 16.2.10.1. Overview
- 16.2.10.2. Products
- 16.2.10.3. SWOT Analysis
- 16.2.10.4. Recent Developments
- 16.2.10.5. Financials (Based on Availability)
- 16.2.1 Esri Saudi Arabia Ltd
List of Figures
- Figure 1: Global KSA Location-based Services Market Revenue Breakdown (Million, %) by Region 2024 & 2032
- Figure 2: North America KSA Location-based Services Market Revenue (Million), by Country 2024 & 2032
- Figure 3: North America KSA Location-based Services Market Revenue Share (%), by Country 2024 & 2032
- Figure 4: Europe KSA Location-based Services Market Revenue (Million), by Country 2024 & 2032
- Figure 5: Europe KSA Location-based Services Market Revenue Share (%), by Country 2024 & 2032
- Figure 6: Asia Pacific KSA Location-based Services Market Revenue (Million), by Country 2024 & 2032
- Figure 7: Asia Pacific KSA Location-based Services Market Revenue Share (%), by Country 2024 & 2032
- Figure 8: Latin America KSA Location-based Services Market Revenue (Million), by Country 2024 & 2032
- Figure 9: Latin America KSA Location-based Services Market Revenue Share (%), by Country 2024 & 2032
- Figure 10: Middle East KSA Location-based Services Market Revenue (Million), by Country 2024 & 2032
- Figure 11: Middle East KSA Location-based Services Market Revenue Share (%), by Country 2024 & 2032
- Figure 12: North America KSA Location-based Services Market Revenue (Million), by Component 2024 & 2032
- Figure 13: North America KSA Location-based Services Market Revenue Share (%), by Component 2024 & 2032
- Figure 14: North America KSA Location-based Services Market Revenue (Million), by Location 2024 & 2032
- Figure 15: North America KSA Location-based Services Market Revenue Share (%), by Location 2024 & 2032
- Figure 16: North America KSA Location-based Services Market Revenue (Million), by Application 2024 & 2032
- Figure 17: North America KSA Location-based Services Market Revenue Share (%), by Application 2024 & 2032
- Figure 18: North America KSA Location-based Services Market Revenue (Million), by End-User 2024 & 2032
- Figure 19: North America KSA Location-based Services Market Revenue Share (%), by End-User 2024 & 2032
- Figure 20: North America KSA Location-based Services Market Revenue (Million), by Country 2024 & 2032
- Figure 21: North America KSA Location-based Services Market Revenue Share (%), by Country 2024 & 2032
- Figure 22: South America KSA Location-based Services Market Revenue (Million), by Component 2024 & 2032
- Figure 23: South America KSA Location-based Services Market Revenue Share (%), by Component 2024 & 2032
- Figure 24: South America KSA Location-based Services Market Revenue (Million), by Location 2024 & 2032
- Figure 25: South America KSA Location-based Services Market Revenue Share (%), by Location 2024 & 2032
- Figure 26: South America KSA Location-based Services Market Revenue (Million), by Application 2024 & 2032
- Figure 27: South America KSA Location-based Services Market Revenue Share (%), by Application 2024 & 2032
- Figure 28: South America KSA Location-based Services Market Revenue (Million), by End-User 2024 & 2032
- Figure 29: South America KSA Location-based Services Market Revenue Share (%), by End-User 2024 & 2032
- Figure 30: South America KSA Location-based Services Market Revenue (Million), by Country 2024 & 2032
- Figure 31: South America KSA Location-based Services Market Revenue Share (%), by Country 2024 & 2032
- Figure 32: Europe KSA Location-based Services Market Revenue (Million), by Component 2024 & 2032
- Figure 33: Europe KSA Location-based Services Market Revenue Share (%), by Component 2024 & 2032
- Figure 34: Europe KSA Location-based Services Market Revenue (Million), by Location 2024 & 2032
- Figure 35: Europe KSA Location-based Services Market Revenue Share (%), by Location 2024 & 2032
- Figure 36: Europe KSA Location-based Services Market Revenue (Million), by Application 2024 & 2032
- Figure 37: Europe KSA Location-based Services Market Revenue Share (%), by Application 2024 & 2032
- Figure 38: Europe KSA Location-based Services Market Revenue (Million), by End-User 2024 & 2032
- Figure 39: Europe KSA Location-based Services Market Revenue Share (%), by End-User 2024 & 2032
- Figure 40: Europe KSA Location-based Services Market Revenue (Million), by Country 2024 & 2032
- Figure 41: Europe KSA Location-based Services Market Revenue Share (%), by Country 2024 & 2032
- Figure 42: Middle East & Africa KSA Location-based Services Market Revenue (Million), by Component 2024 & 2032
- Figure 43: Middle East & Africa KSA Location-based Services Market Revenue Share (%), by Component 2024 & 2032
- Figure 44: Middle East & Africa KSA Location-based Services Market Revenue (Million), by Location 2024 & 2032
- Figure 45: Middle East & Africa KSA Location-based Services Market Revenue Share (%), by Location 2024 & 2032
- Figure 46: Middle East & Africa KSA Location-based Services Market Revenue (Million), by Application 2024 & 2032
- Figure 47: Middle East & Africa KSA Location-based Services Market Revenue Share (%), by Application 2024 & 2032
- Figure 48: Middle East & Africa KSA Location-based Services Market Revenue (Million), by End-User 2024 & 2032
- Figure 49: Middle East & Africa KSA Location-based Services Market Revenue Share (%), by End-User 2024 & 2032
- Figure 50: Middle East & Africa KSA Location-based Services Market Revenue (Million), by Country 2024 & 2032
- Figure 51: Middle East & Africa KSA Location-based Services Market Revenue Share (%), by Country 2024 & 2032
- Figure 52: Asia Pacific KSA Location-based Services Market Revenue (Million), by Component 2024 & 2032
- Figure 53: Asia Pacific KSA Location-based Services Market Revenue Share (%), by Component 2024 & 2032
- Figure 54: Asia Pacific KSA Location-based Services Market Revenue (Million), by Location 2024 & 2032
- Figure 55: Asia Pacific KSA Location-based Services Market Revenue Share (%), by Location 2024 & 2032
- Figure 56: Asia Pacific KSA Location-based Services Market Revenue (Million), by Application 2024 & 2032
- Figure 57: Asia Pacific KSA Location-based Services Market Revenue Share (%), by Application 2024 & 2032
- Figure 58: Asia Pacific KSA Location-based Services Market Revenue (Million), by End-User 2024 & 2032
- Figure 59: Asia Pacific KSA Location-based Services Market Revenue Share (%), by End-User 2024 & 2032
- Figure 60: Asia Pacific KSA Location-based Services Market Revenue (Million), by Country 2024 & 2032
- Figure 61: Asia Pacific KSA Location-based Services Market Revenue Share (%), by Country 2024 & 2032
List of Tables
- Table 1: Global KSA Location-based Services Market Revenue Million Forecast, by Region 2019 & 2032
- Table 2: Global KSA Location-based Services Market Revenue Million Forecast, by Component 2019 & 2032
- Table 3: Global KSA Location-based Services Market Revenue Million Forecast, by Location 2019 & 2032
- Table 4: Global KSA Location-based Services Market Revenue Million Forecast, by Application 2019 & 2032
- Table 5: Global KSA Location-based Services Market Revenue Million Forecast, by End-User 2019 & 2032
- Table 6: Global KSA Location-based Services Market Revenue Million Forecast, by Region 2019 & 2032
- Table 7: Global KSA Location-based Services Market Revenue Million Forecast, by Country 2019 & 2032
- Table 8: KSA Location-based Services Market Revenue (Million) Forecast, by Application 2019 & 2032
- Table 9: Global KSA Location-based Services Market Revenue Million Forecast, by Country 2019 & 2032
- Table 10: KSA Location-based Services Market Revenue (Million) Forecast, by Application 2019 & 2032
- Table 11: Global KSA Location-based Services Market Revenue Million Forecast, by Country 2019 & 2032
- Table 12: KSA Location-based Services Market Revenue (Million) Forecast, by Application 2019 & 2032
- Table 13: Global KSA Location-based Services Market Revenue Million Forecast, by Country 2019 & 2032
- Table 14: KSA Location-based Services Market Revenue (Million) Forecast, by Application 2019 & 2032
- Table 15: Global KSA Location-based Services Market Revenue Million Forecast, by Country 2019 & 2032
- Table 16: KSA Location-based Services Market Revenue (Million) Forecast, by Application 2019 & 2032
- Table 17: Global KSA Location-based Services Market Revenue Million Forecast, by Component 2019 & 2032
- Table 18: Global KSA Location-based Services Market Revenue Million Forecast, by Location 2019 & 2032
- Table 19: Global KSA Location-based Services Market Revenue Million Forecast, by Application 2019 & 2032
- Table 20: Global KSA Location-based Services Market Revenue Million Forecast, by End-User 2019 & 2032
- Table 21: Global KSA Location-based Services Market Revenue Million Forecast, by Country 2019 & 2032
- Table 22: United States KSA Location-based Services Market Revenue (Million) Forecast, by Application 2019 & 2032
- Table 23: Canada KSA Location-based Services Market Revenue (Million) Forecast, by Application 2019 & 2032
- Table 24: Mexico KSA Location-based Services Market Revenue (Million) Forecast, by Application 2019 & 2032
- Table 25: Global KSA Location-based Services Market Revenue Million Forecast, by Component 2019 & 2032
- Table 26: Global KSA Location-based Services Market Revenue Million Forecast, by Location 2019 & 2032
- Table 27: Global KSA Location-based Services Market Revenue Million Forecast, by Application 2019 & 2032
- Table 28: Global KSA Location-based Services Market Revenue Million Forecast, by End-User 2019 & 2032
- Table 29: Global KSA Location-based Services Market Revenue Million Forecast, by Country 2019 & 2032
- Table 30: Brazil KSA Location-based Services Market Revenue (Million) Forecast, by Application 2019 & 2032
- Table 31: Argentina KSA Location-based Services Market Revenue (Million) Forecast, by Application 2019 & 2032
- Table 32: Rest of South America KSA Location-based Services Market Revenue (Million) Forecast, by Application 2019 & 2032
- Table 33: Global KSA Location-based Services Market Revenue Million Forecast, by Component 2019 & 2032
- Table 34: Global KSA Location-based Services Market Revenue Million Forecast, by Location 2019 & 2032
- Table 35: Global KSA Location-based Services Market Revenue Million Forecast, by Application 2019 & 2032
- Table 36: Global KSA Location-based Services Market Revenue Million Forecast, by End-User 2019 & 2032
- Table 37: Global KSA Location-based Services Market Revenue Million Forecast, by Country 2019 & 2032
- Table 38: United Kingdom KSA Location-based Services Market Revenue (Million) Forecast, by Application 2019 & 2032
- Table 39: Germany KSA Location-based Services Market Revenue (Million) Forecast, by Application 2019 & 2032
- Table 40: France KSA Location-based Services Market Revenue (Million) Forecast, by Application 2019 & 2032
- Table 41: Italy KSA Location-based Services Market Revenue (Million) Forecast, by Application 2019 & 2032
- Table 42: Spain KSA Location-based Services Market Revenue (Million) Forecast, by Application 2019 & 2032
- Table 43: Russia KSA Location-based Services Market Revenue (Million) Forecast, by Application 2019 & 2032
- Table 44: Benelux KSA Location-based Services Market Revenue (Million) Forecast, by Application 2019 & 2032
- Table 45: Nordics KSA Location-based Services Market Revenue (Million) Forecast, by Application 2019 & 2032
- Table 46: Rest of Europe KSA Location-based Services Market Revenue (Million) Forecast, by Application 2019 & 2032
- Table 47: Global KSA Location-based Services Market Revenue Million Forecast, by Component 2019 & 2032
- Table 48: Global KSA Location-based Services Market Revenue Million Forecast, by Location 2019 & 2032
- Table 49: Global KSA Location-based Services Market Revenue Million Forecast, by Application 2019 & 2032
- Table 50: Global KSA Location-based Services Market Revenue Million Forecast, by End-User 2019 & 2032
- Table 51: Global KSA Location-based Services Market Revenue Million Forecast, by Country 2019 & 2032
- Table 52: Turkey KSA Location-based Services Market Revenue (Million) Forecast, by Application 2019 & 2032
- Table 53: Israel KSA Location-based Services Market Revenue (Million) Forecast, by Application 2019 & 2032
- Table 54: GCC KSA Location-based Services Market Revenue (Million) Forecast, by Application 2019 & 2032
- Table 55: North Africa KSA Location-based Services Market Revenue (Million) Forecast, by Application 2019 & 2032
- Table 56: South Africa KSA Location-based Services Market Revenue (Million) Forecast, by Application 2019 & 2032
- Table 57: Rest of Middle East & Africa KSA Location-based Services Market Revenue (Million) Forecast, by Application 2019 & 2032
- Table 58: Global KSA Location-based Services Market Revenue Million Forecast, by Component 2019 & 2032
- Table 59: Global KSA Location-based Services Market Revenue Million Forecast, by Location 2019 & 2032
- Table 60: Global KSA Location-based Services Market Revenue Million Forecast, by Application 2019 & 2032
- Table 61: Global KSA Location-based Services Market Revenue Million Forecast, by End-User 2019 & 2032
- Table 62: Global KSA Location-based Services Market Revenue Million Forecast, by Country 2019 & 2032
- Table 63: China KSA Location-based Services Market Revenue (Million) Forecast, by Application 2019 & 2032
- Table 64: India KSA Location-based Services Market Revenue (Million) Forecast, by Application 2019 & 2032
- Table 65: Japan KSA Location-based Services Market Revenue (Million) Forecast, by Application 2019 & 2032
- Table 66: South Korea KSA Location-based Services Market Revenue (Million) Forecast, by Application 2019 & 2032
- Table 67: ASEAN KSA Location-based Services Market Revenue (Million) Forecast, by Application 2019 & 2032
- Table 68: Oceania KSA Location-based Services Market Revenue (Million) Forecast, by Application 2019 & 2032
- Table 69: Rest of Asia Pacific KSA Location-based Services Market Revenue (Million) Forecast, by Application 2019 & 2032
Frequently Asked Questions
1. What is the projected Compound Annual Growth Rate (CAGR) of the KSA Location-based Services Market?
The projected CAGR is approximately 14.00%.
2. Which companies are prominent players in the KSA Location-based Services Market?
Key companies in the market include Esri Saudi Arabia Ltd, Telefonaktiebolaget LM Ericsson, Google LLC, Cisco Systems Inc, HPE Aruba Networking, IBM Corporation, Max GPS Track, Zebra Technologies Corp, Location Solutions Telemetics LLC, ALE International.
3. What are the main segments of the KSA Location-based Services Market?
The market segments include Component, Location, Application, End-User.
4. Can you provide details about the market size?
The market size is estimated to be USD XX Million as of 2022.
5. What are some drivers contributing to market growth?
The development of Smart City Projects in The Country is Driving The Market Growth; The Growing Trend of Digitalisation in the Country Supported by the Adoption of Smart Connected Devices.
6. What are the notable trends driving market growth?
The development of Smart City Projects in The Country is Driving the Market Growth.
7. Are there any restraints impacting market growth?
The Risk of Data Privacy Breaching Due to the Use of Location Data in the Solutions; The Non-Availability of Good Network Connectivity in the Rural Areas of the Country.
8. Can you provide examples of recent developments in the market?
January 2023: MDS for Computеr Systеms LLC еntеrеd into a stratеgic partnеrship with Cisco Systеms to dеlivеr its innovativе location-basеd solutions within Almoosa Spеcialist Hospital in Al Ahsa, Saudi Arabia. Thе implеmеntation includеs thе dеploymеnt of Cisco DNA and othеr third-party solutions, еncompassing Indoor Navigation, Wayfinding, Indoor Location Analytics, and Assеt Tracking, dеmonstrating thе incrеasing dеmand for location-basеd tеchnologiеs in thе nation. This surgе in intеrеst is furthеr fuеlеd by thе widеsprеad adoption of thеsе solutions in thе hеalthcarе sеctor across thе country.
9. What pricing options are available for accessing the report?
Pricing options include single-user, multi-user, and enterprise licenses priced at USD 3800, USD 4500, and USD 5800 respectively.
10. Is the market size provided in terms of value or volume?
The market size is provided in terms of value, measured in Million.
11. Are there any specific market keywords associated with the report?
Yes, the market keyword associated with the report is "KSA Location-based Services Market," which aids in identifying and referencing the specific market segment covered.
12. How do I determine which pricing option suits my needs best?
The pricing options vary based on user requirements and access needs. Individual users may opt for single-user licenses, while businesses requiring broader access may choose multi-user or enterprise licenses for cost-effective access to the report.
13. Are there any additional resources or data provided in the KSA Location-based Services Market report?
While the report offers comprehensive insights, it's advisable to review the specific contents or supplementary materials provided to ascertain if additional resources or data are available.
14. How can I stay updated on further developments or reports in the KSA Location-based Services Market?
To stay informed about further developments, trends, and reports in the KSA Location-based Services Market, consider subscribing to industry newsletters, following relevant companies and organizations, or regularly checking reputable industry news sources and publications.
Methodology
Step 1 - Identification of Relevant Samples Size from Population Database


Step 2 - Approaches for Defining Global Market Size (Value, Volume* & Price*)

Note*: In applicable scenarios
Step 3 - Data Sources
Primary Research
- Web Analytics
- Survey Reports
- Research Institute
- Latest Research Reports
- Opinion Leaders
Secondary Research
- Annual Reports
- White Paper
- Latest Press Release
- Industry Association
- Paid Database
- Investor Presentations

Step 4 - Data Triangulation
Involves using different sources of information in order to increase the validity of a study
These sources are likely to be stakeholders in a program - participants, other researchers, program staff, other community members, and so on.
Then we put all data in single framework & apply various statistical tools to find out the dynamic on the market.
During the analysis stage, feedback from the stakeholder groups would be compared to determine areas of agreement as well as areas of divergence


