
Key Insights
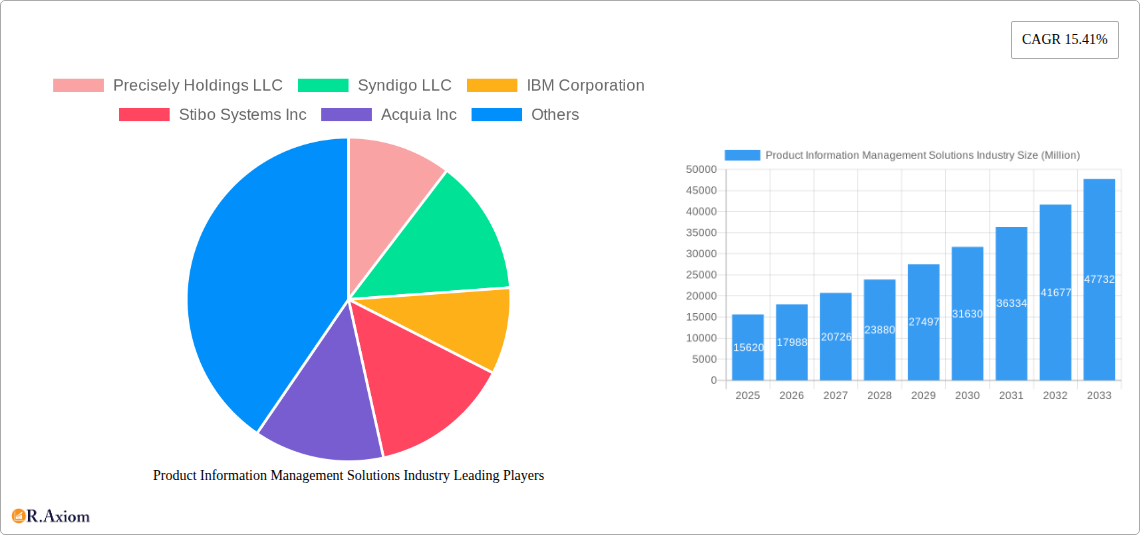
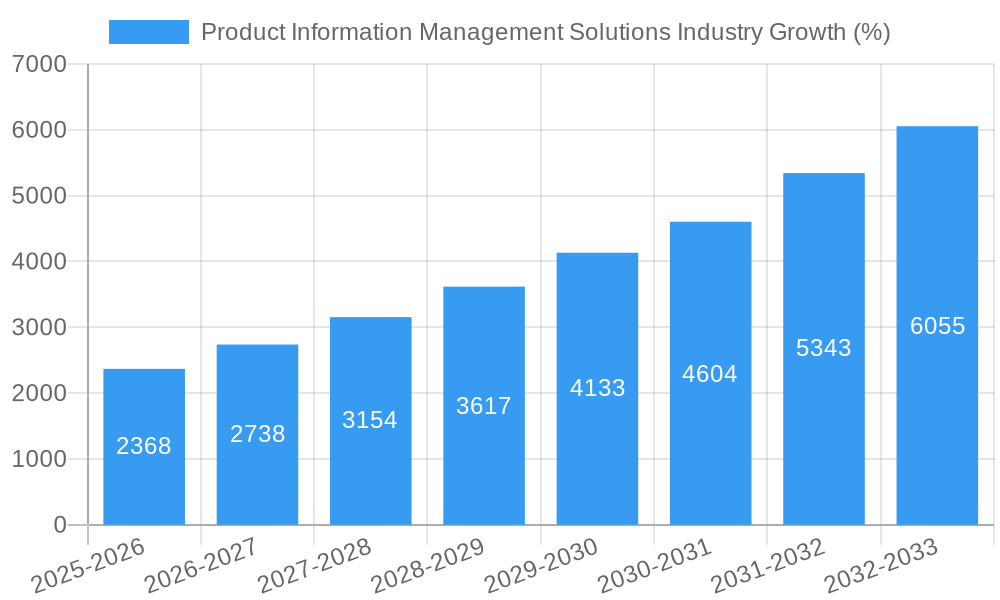
The Product Information Management (PIM) solutions market is experiencing robust growth, projected to reach \$15.62 billion in 2025 and maintain a Compound Annual Growth Rate (CAGR) of 15.41% from 2025 to 2033. This expansion is driven by several key factors. The increasing need for businesses to manage and distribute accurate, consistent product information across multiple channels (e-commerce, marketplaces, physical stores) is a primary driver. The rise of omnichannel commerce necessitates a centralized PIM system to ensure brand consistency and customer satisfaction. Furthermore, the growing complexity of product catalogs, especially in industries like retail and consumer goods, fuels demand for sophisticated PIM solutions capable of handling large volumes of data and multiple languages. Finally, the increasing adoption of cloud-based PIM solutions offers scalability, flexibility, and reduced IT infrastructure costs, further accelerating market growth.
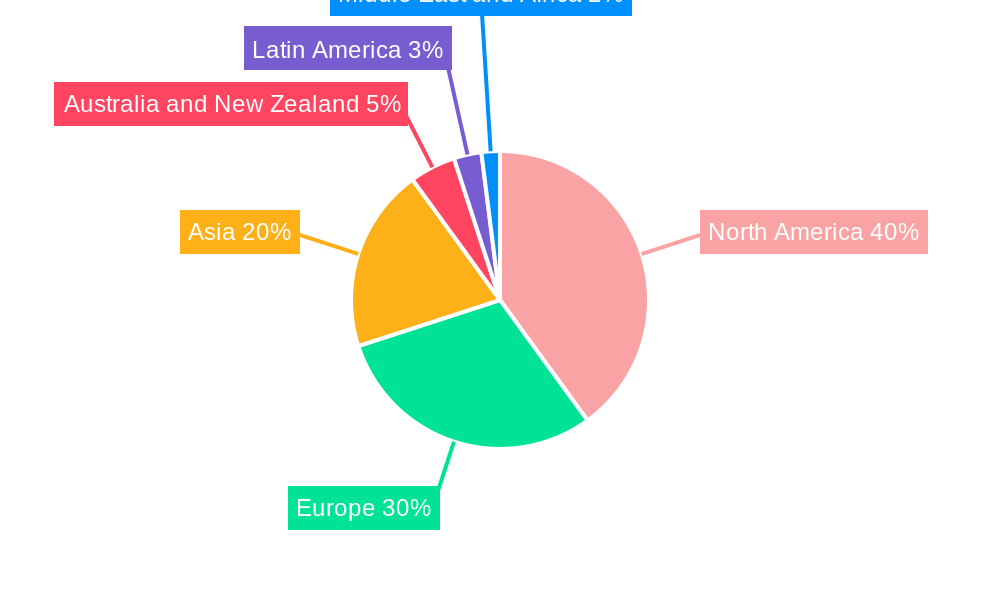
The market segmentation highlights significant opportunities across various deployment models (cloud leading the way), offering types (solutions enjoying higher demand than services initially but with services catching up over time due to increased need for integration and maintenance), and end-user industries. The BFSI (Banking, Financial Services, and Insurance), Media & Entertainment, and Retail sectors currently dominate the market, but significant growth potential exists in sectors like Energy & Utilities, Healthcare, and Transportation & Logistics as they increasingly prioritize digital transformation and customer experience. Competitive landscape analysis reveals a mix of established players (IBM, SAP) and emerging niche vendors, indicating a dynamic and innovative market. Geographic distribution shows North America and Europe currently holding larger market shares, but Asia-Pacific is expected to witness significant growth in the coming years due to increased digitalization and e-commerce penetration in developing economies. The forecast period (2025-2033) suggests continued strong growth, influenced by ongoing technological advancements in PIM capabilities, such as AI-powered product information enrichment and improved integration with other enterprise systems.
Product Information Management (PIM) Solutions Market Report: 2019-2033
This comprehensive report provides a detailed analysis of the Product Information Management (PIM) Solutions market, offering actionable insights for industry stakeholders. The study covers the period 2019-2033, with a focus on the forecast period 2025-2033 and a base year of 2025. The report analyzes market dynamics, including market size, growth drivers, challenges, and opportunities. It also profiles key players and examines significant industry developments. The global market is projected to reach xx Million by 2033.
Product Information Management Solutions Industry Market Concentration & Innovation
The Product Information Management (PIM) solutions market exhibits a moderately concentrated landscape, with a few major players holding significant market share. Precisely Holdings LLC, Syndigo LLC, IBM Corporation, and Stibo Systems Inc. are among the leading companies, collectively accounting for an estimated xx% of the global market in 2024. However, the market is also characterized by the presence of several smaller, specialized players and emerging vendors offering niche solutions.
Innovation within the PIM space is driven by several factors, including:
- Advancements in cloud technologies: Cloud-based PIM solutions are gaining popularity due to their scalability, cost-effectiveness, and accessibility.
- Integration with other enterprise systems: PIM solutions are increasingly being integrated with other enterprise systems, such as ERP, CRM, and e-commerce platforms, to improve data consistency and streamline business processes.
- AI and machine learning: The adoption of AI and machine learning technologies is enhancing PIM capabilities, enabling automated data enrichment, improved product categorization, and more accurate product recommendations.
The regulatory landscape plays a significant role, particularly concerning data privacy and security regulations like GDPR and CCPA. These regulations are driving the adoption of robust security features and compliance functionalities within PIM solutions. Product substitutes include manual data management processes, which are less efficient and prone to errors. However, the increasing volume and complexity of product information make PIM solutions increasingly indispensable. The market also witnesses frequent mergers and acquisitions (M&A) activities, with deal values reaching xx Million in recent years, reflecting the consolidation and expansion strategies of key players.
Product Information Management Solutions Industry Industry Trends & Insights
The Product Information Management (PIM) solutions market is experiencing robust growth, driven by several factors. The increasing need for consistent and accurate product information across multiple sales channels is a key driver. Businesses are realizing the importance of providing a seamless and consistent omnichannel customer experience, which requires centralized and well-managed product data. Technological disruptions, such as the rise of cloud computing and AI, are also fueling market expansion, enabling businesses to deploy and manage PIM solutions more effectively. The growing adoption of e-commerce and the increasing complexity of product catalogs further contribute to market expansion. Consumer preferences for personalized experiences and detailed product information are also creating a strong demand for robust PIM solutions. The market is expected to exhibit a Compound Annual Growth Rate (CAGR) of xx% during the forecast period (2025-2033), with market penetration projected to reach xx% by 2033. Competitive dynamics are marked by innovation, strategic partnerships, and mergers & acquisitions, leading to a more mature and diversified market.
Dominant Markets & Segments in Product Information Management Solutions Industry
The retail sector remains the dominant end-user industry for PIM solutions, accounting for the largest market share globally. This is driven by the need for managing vast product catalogs across multiple channels, ensuring consistent product information and enhancing customer experience. Other significant segments include:
- By Deployment: Cloud-based PIM solutions are the dominant segment due to flexibility, scalability, and cost efficiency.
- By Offering: PIM solutions are the primary offering, but services like implementation, integration, and support are also substantial revenue generators.
Key Drivers:
- Retail: High demand for efficient product information management across multiple channels (e.g., online, retail stores).
- Cloud Deployment: Cost-effectiveness, scalability, and accessibility.
- Solution Offerings: Comprehensive product information management capabilities.
Dominance Analysis:
The dominance of the Retail segment is primarily due to the massive volumes of product data handled and the consequent need for efficient management. The growth of e-commerce and omnichannel strategies is further fueling the high demand for PIM solutions in this sector. Similarly, the preference for Cloud-based deployments reflects the benefits of flexibility, scalability, and ease of access. The strong focus on Solutions over Services reflects the inherent value businesses place on having a robust PIM platform at their core.
Other key end-user industries such as BFSI, Media and Entertainment, Healthcare and IT and Telecommunications are also adopting PIM solutions for managing increasingly complex product portfolios. The geographic dominance lies with North America followed by Europe and Asia-Pacific, driven by higher levels of digitalization and the presence of major players.
Product Information Management Solutions Industry Product Developments
Recent product developments in the PIM space highlight a strong focus on enhancing user experience, improving data integration capabilities, and leveraging AI and machine learning. Many vendors are offering more intuitive user interfaces, enhanced data visualization tools, and automated workflows to simplify product information management. The integration capabilities of PIM systems are also expanding to include seamless connectivity with various enterprise applications and e-commerce platforms, streamlining data flows and eliminating data silos. Key competitive advantages lie in offering robust features, ease of use, scalability, and superior data integration capabilities. The current trend favors cloud-based solutions that offer flexibility and cost-effectiveness.
Report Scope & Segmentation Analysis
This report comprehensively analyzes the Product Information Management (PIM) Solutions market based on various segments:
By Deployment: Cloud, On-premise. The cloud segment is projected to exhibit a faster growth rate due to its inherent advantages.
By Offering: Solution, Services. The Solutions segment holds a larger market share, but the Services segment is expected to see growth driven by the complexity of PIM implementations.
By End-user Industry: BFSI, Media and Entertainment, Retail, Energy and Utilities, Healthcare, IT and Telecommunications, Transportation and Logistics, Other End-user Industries. Retail and other industries with significant product catalogs are the largest segments. Growth projections vary across segments, reflecting the varying adoption rates and specific needs of each industry. The competitive dynamics within each segment are shaped by factors such as vendor specialization, solution offerings, and pricing strategies.
Key Drivers of Product Information Management Solutions Industry Growth
The growth of the PIM solutions market is primarily driven by the increasing need for consistent and accurate product information across all sales channels, the rise of e-commerce and omnichannel retailing, and the increasing complexity of product catalogs. Technological advancements such as cloud computing, AI, and machine learning are also contributing significantly to this growth. Favorable regulatory environments that support data privacy and security also contribute. These factors combined are creating a compelling case for businesses to invest in robust PIM solutions.
Challenges in the Product Information Management Solutions Industry Sector
Challenges faced by the PIM solutions market include the high initial investment costs for implementation, the complexity of integrating PIM solutions with existing enterprise systems, and the need for specialized expertise to manage and maintain these systems. Competition from established players and new entrants is intense, demanding constant innovation and improvement. Data security and compliance with evolving data privacy regulations present further challenges. These factors can impact market growth rates and profitability for vendors and businesses alike.
Emerging Opportunities in Product Information Management Solutions Industry
Emerging opportunities include the growing demand for PIM solutions in new and expanding industries, such as the rapidly growing e-commerce sector and the need for better data management in the BFSI sector, The rising adoption of AI and machine learning to automate and enhance PIM functionalities offers significant opportunities. Expanding global reach into emerging markets with growing digital economies presents another avenue for growth. These opportunities reflect the continuous evolution of business needs and technological advancements within the PIM space.
Leading Players in the Product Information Management Solutions Industry Market
- Precisely Holdings LLC
- Syndigo LLC
- IBM Corporation
- Stibo Systems Inc
- Acquia Inc
- Pimcore GMBH
- Salsify Inc
- Akeneo SAS
- InRiver AB
- Informatica LLC
- Plytix Limited
- SAP SE
- Insight Software
Key Developments in Product Information Management Solutions Industry Industry
- March 2024: Akeneo launched the Akeneo PIM App for Salesforce on Salesforce AppExchange, enhancing product information management within the Salesforce ecosystem.
- February 2024: Salsify announced the general availability of Salsify PXM Advance, a new platform version enhancing product experience management capabilities.
Strategic Outlook for Product Information Management Solutions Industry Market
The PIM solutions market is poised for continued growth, driven by the ongoing digital transformation of businesses across various industries. The increasing demand for consistent and accurate product information, coupled with the adoption of advanced technologies like AI and machine learning, will continue to fuel market expansion. Opportunities exist in expanding into new geographic markets, integrating with emerging technologies, and developing specialized solutions for niche industries. Vendors who can offer innovative solutions, robust integration capabilities, and superior customer support will be best positioned for success in this dynamic market.
Product Information Management Solutions Industry Segmentation
-
1. Deployment
- 1.1. Cloud
- 1.2. On-premise
-
2. Offering
- 2.1. Solution
- 2.2. Services
-
3. End-user Industry
- 3.1. BFSI
- 3.2. Media and Entertainment
- 3.3. Retail
- 3.4. Energy and Utilities
- 3.5. Healthcare
- 3.6. IT and Telecommunications
- 3.7. Transportation and Logistics
- 3.8. Other End-user Industries
Product Information Management Solutions Industry Segmentation By Geography
- 1. North America
- 2. Europe
- 3. Asia
- 4. Australia and New Zealand
- 5. Latin America
- 6. Middle East and Africa
Product Information Management Solutions Industry REPORT HIGHLIGHTS
| Aspects | Details |
|---|---|
| Study Period | 2019-2033 |
| Base Year | 2024 |
| Estimated Year | 2025 |
| Forecast Period | 2025-2033 |
| Historical Period | 2019-2024 |
| Growth Rate | CAGR of 15.41% from 2019-2033 |
| Segmentation |
|
Table of Contents
- 1. Introduction
- 1.1. Research Scope
- 1.2. Market Segmentation
- 1.3. Research Methodology
- 1.4. Definitions and Assumptions
- 2. Executive Summary
- 2.1. Introduction
- 3. Market Dynamics
- 3.1. Introduction
- 3.2. Market Drivers
- 3.2.1. Growing Demand for Better Customer Service; Growing Demand for Centralized Data Management Tools
- 3.3. Market Restrains
- 3.3.1. Increasing Data Breaching Cases
- 3.4. Market Trends
- 3.4.1. Retail Sector to Witness Growth
- 4. Market Factor Analysis
- 4.1. Porters Five Forces
- 4.2. Supply/Value Chain
- 4.3. PESTEL analysis
- 4.4. Market Entropy
- 4.5. Patent/Trademark Analysis
- 5. Global Product Information Management Solutions Industry Analysis, Insights and Forecast, 2019-2031
- 5.1. Market Analysis, Insights and Forecast - by Deployment
- 5.1.1. Cloud
- 5.1.2. On-premise
- 5.2. Market Analysis, Insights and Forecast - by Offering
- 5.2.1. Solution
- 5.2.2. Services
- 5.3. Market Analysis, Insights and Forecast - by End-user Industry
- 5.3.1. BFSI
- 5.3.2. Media and Entertainment
- 5.3.3. Retail
- 5.3.4. Energy and Utilities
- 5.3.5. Healthcare
- 5.3.6. IT and Telecommunications
- 5.3.7. Transportation and Logistics
- 5.3.8. Other End-user Industries
- 5.4. Market Analysis, Insights and Forecast - by Region
- 5.4.1. North America
- 5.4.2. Europe
- 5.4.3. Asia
- 5.4.4. Australia and New Zealand
- 5.4.5. Latin America
- 5.4.6. Middle East and Africa
- 5.1. Market Analysis, Insights and Forecast - by Deployment
- 6. North America Product Information Management Solutions Industry Analysis, Insights and Forecast, 2019-2031
- 6.1. Market Analysis, Insights and Forecast - by Deployment
- 6.1.1. Cloud
- 6.1.2. On-premise
- 6.2. Market Analysis, Insights and Forecast - by Offering
- 6.2.1. Solution
- 6.2.2. Services
- 6.3. Market Analysis, Insights and Forecast - by End-user Industry
- 6.3.1. BFSI
- 6.3.2. Media and Entertainment
- 6.3.3. Retail
- 6.3.4. Energy and Utilities
- 6.3.5. Healthcare
- 6.3.6. IT and Telecommunications
- 6.3.7. Transportation and Logistics
- 6.3.8. Other End-user Industries
- 6.1. Market Analysis, Insights and Forecast - by Deployment
- 7. Europe Product Information Management Solutions Industry Analysis, Insights and Forecast, 2019-2031
- 7.1. Market Analysis, Insights and Forecast - by Deployment
- 7.1.1. Cloud
- 7.1.2. On-premise
- 7.2. Market Analysis, Insights and Forecast - by Offering
- 7.2.1. Solution
- 7.2.2. Services
- 7.3. Market Analysis, Insights and Forecast - by End-user Industry
- 7.3.1. BFSI
- 7.3.2. Media and Entertainment
- 7.3.3. Retail
- 7.3.4. Energy and Utilities
- 7.3.5. Healthcare
- 7.3.6. IT and Telecommunications
- 7.3.7. Transportation and Logistics
- 7.3.8. Other End-user Industries
- 7.1. Market Analysis, Insights and Forecast - by Deployment
- 8. Asia Product Information Management Solutions Industry Analysis, Insights and Forecast, 2019-2031
- 8.1. Market Analysis, Insights and Forecast - by Deployment
- 8.1.1. Cloud
- 8.1.2. On-premise
- 8.2. Market Analysis, Insights and Forecast - by Offering
- 8.2.1. Solution
- 8.2.2. Services
- 8.3. Market Analysis, Insights and Forecast - by End-user Industry
- 8.3.1. BFSI
- 8.3.2. Media and Entertainment
- 8.3.3. Retail
- 8.3.4. Energy and Utilities
- 8.3.5. Healthcare
- 8.3.6. IT and Telecommunications
- 8.3.7. Transportation and Logistics
- 8.3.8. Other End-user Industries
- 8.1. Market Analysis, Insights and Forecast - by Deployment
- 9. Australia and New Zealand Product Information Management Solutions Industry Analysis, Insights and Forecast, 2019-2031
- 9.1. Market Analysis, Insights and Forecast - by Deployment
- 9.1.1. Cloud
- 9.1.2. On-premise
- 9.2. Market Analysis, Insights and Forecast - by Offering
- 9.2.1. Solution
- 9.2.2. Services
- 9.3. Market Analysis, Insights and Forecast - by End-user Industry
- 9.3.1. BFSI
- 9.3.2. Media and Entertainment
- 9.3.3. Retail
- 9.3.4. Energy and Utilities
- 9.3.5. Healthcare
- 9.3.6. IT and Telecommunications
- 9.3.7. Transportation and Logistics
- 9.3.8. Other End-user Industries
- 9.1. Market Analysis, Insights and Forecast - by Deployment
- 10. Latin America Product Information Management Solutions Industry Analysis, Insights and Forecast, 2019-2031
- 10.1. Market Analysis, Insights and Forecast - by Deployment
- 10.1.1. Cloud
- 10.1.2. On-premise
- 10.2. Market Analysis, Insights and Forecast - by Offering
- 10.2.1. Solution
- 10.2.2. Services
- 10.3. Market Analysis, Insights and Forecast - by End-user Industry
- 10.3.1. BFSI
- 10.3.2. Media and Entertainment
- 10.3.3. Retail
- 10.3.4. Energy and Utilities
- 10.3.5. Healthcare
- 10.3.6. IT and Telecommunications
- 10.3.7. Transportation and Logistics
- 10.3.8. Other End-user Industries
- 10.1. Market Analysis, Insights and Forecast - by Deployment
- 11. Middle East and Africa Product Information Management Solutions Industry Analysis, Insights and Forecast, 2019-2031
- 11.1. Market Analysis, Insights and Forecast - by Deployment
- 11.1.1. Cloud
- 11.1.2. On-premise
- 11.2. Market Analysis, Insights and Forecast - by Offering
- 11.2.1. Solution
- 11.2.2. Services
- 11.3. Market Analysis, Insights and Forecast - by End-user Industry
- 11.3.1. BFSI
- 11.3.2. Media and Entertainment
- 11.3.3. Retail
- 11.3.4. Energy and Utilities
- 11.3.5. Healthcare
- 11.3.6. IT and Telecommunications
- 11.3.7. Transportation and Logistics
- 11.3.8. Other End-user Industries
- 11.1. Market Analysis, Insights and Forecast - by Deployment
- 12. North America Product Information Management Solutions Industry Analysis, Insights and Forecast, 2019-2031
- 12.1. Market Analysis, Insights and Forecast - By Country/Sub-region
- 12.1.1.
- 13. Europe Product Information Management Solutions Industry Analysis, Insights and Forecast, 2019-2031
- 13.1. Market Analysis, Insights and Forecast - By Country/Sub-region
- 13.1.1.
- 14. Asia Product Information Management Solutions Industry Analysis, Insights and Forecast, 2019-2031
- 14.1. Market Analysis, Insights and Forecast - By Country/Sub-region
- 14.1.1.
- 15. Australia and New Zealand Product Information Management Solutions Industry Analysis, Insights and Forecast, 2019-2031
- 15.1. Market Analysis, Insights and Forecast - By Country/Sub-region
- 15.1.1.
- 16. Latin America Product Information Management Solutions Industry Analysis, Insights and Forecast, 2019-2031
- 16.1. Market Analysis, Insights and Forecast - By Country/Sub-region
- 16.1.1.
- 17. Middle East and Africa Product Information Management Solutions Industry Analysis, Insights and Forecast, 2019-2031
- 17.1. Market Analysis, Insights and Forecast - By Country/Sub-region
- 17.1.1.
- 18. Competitive Analysis
- 18.1. Global Market Share Analysis 2024
- 18.2. Company Profiles
- 18.2.1 Precisely Holdings LLC
- 18.2.1.1. Overview
- 18.2.1.2. Products
- 18.2.1.3. SWOT Analysis
- 18.2.1.4. Recent Developments
- 18.2.1.5. Financials (Based on Availability)
- 18.2.2 Syndigo LLC
- 18.2.2.1. Overview
- 18.2.2.2. Products
- 18.2.2.3. SWOT Analysis
- 18.2.2.4. Recent Developments
- 18.2.2.5. Financials (Based on Availability)
- 18.2.3 IBM Corporation
- 18.2.3.1. Overview
- 18.2.3.2. Products
- 18.2.3.3. SWOT Analysis
- 18.2.3.4. Recent Developments
- 18.2.3.5. Financials (Based on Availability)
- 18.2.4 Stibo Systems Inc
- 18.2.4.1. Overview
- 18.2.4.2. Products
- 18.2.4.3. SWOT Analysis
- 18.2.4.4. Recent Developments
- 18.2.4.5. Financials (Based on Availability)
- 18.2.5 Acquia Inc
- 18.2.5.1. Overview
- 18.2.5.2. Products
- 18.2.5.3. SWOT Analysis
- 18.2.5.4. Recent Developments
- 18.2.5.5. Financials (Based on Availability)
- 18.2.6 Pimcore GMBH
- 18.2.6.1. Overview
- 18.2.6.2. Products
- 18.2.6.3. SWOT Analysis
- 18.2.6.4. Recent Developments
- 18.2.6.5. Financials (Based on Availability)
- 18.2.7 Salsify Inc
- 18.2.7.1. Overview
- 18.2.7.2. Products
- 18.2.7.3. SWOT Analysis
- 18.2.7.4. Recent Developments
- 18.2.7.5. Financials (Based on Availability)
- 18.2.8 Akeneo SAS
- 18.2.8.1. Overview
- 18.2.8.2. Products
- 18.2.8.3. SWOT Analysis
- 18.2.8.4. Recent Developments
- 18.2.8.5. Financials (Based on Availability)
- 18.2.9 InRiver AB
- 18.2.9.1. Overview
- 18.2.9.2. Products
- 18.2.9.3. SWOT Analysis
- 18.2.9.4. Recent Developments
- 18.2.9.5. Financials (Based on Availability)
- 18.2.10 Informatica LLC
- 18.2.10.1. Overview
- 18.2.10.2. Products
- 18.2.10.3. SWOT Analysis
- 18.2.10.4. Recent Developments
- 18.2.10.5. Financials (Based on Availability)
- 18.2.11 Plytix Limited
- 18.2.11.1. Overview
- 18.2.11.2. Products
- 18.2.11.3. SWOT Analysis
- 18.2.11.4. Recent Developments
- 18.2.11.5. Financials (Based on Availability)
- 18.2.12 SAP SE
- 18.2.12.1. Overview
- 18.2.12.2. Products
- 18.2.12.3. SWOT Analysis
- 18.2.12.4. Recent Developments
- 18.2.12.5. Financials (Based on Availability)
- 18.2.13 Insight Software
- 18.2.13.1. Overview
- 18.2.13.2. Products
- 18.2.13.3. SWOT Analysis
- 18.2.13.4. Recent Developments
- 18.2.13.5. Financials (Based on Availability)
- 18.2.1 Precisely Holdings LLC
List of Figures
- Figure 1: Global Product Information Management Solutions Industry Revenue Breakdown (Million, %) by Region 2024 & 2032
- Figure 2: North America Product Information Management Solutions Industry Revenue (Million), by Country 2024 & 2032
- Figure 3: North America Product Information Management Solutions Industry Revenue Share (%), by Country 2024 & 2032
- Figure 4: Europe Product Information Management Solutions Industry Revenue (Million), by Country 2024 & 2032
- Figure 5: Europe Product Information Management Solutions Industry Revenue Share (%), by Country 2024 & 2032
- Figure 6: Asia Product Information Management Solutions Industry Revenue (Million), by Country 2024 & 2032
- Figure 7: Asia Product Information Management Solutions Industry Revenue Share (%), by Country 2024 & 2032
- Figure 8: Australia and New Zealand Product Information Management Solutions Industry Revenue (Million), by Country 2024 & 2032
- Figure 9: Australia and New Zealand Product Information Management Solutions Industry Revenue Share (%), by Country 2024 & 2032
- Figure 10: Latin America Product Information Management Solutions Industry Revenue (Million), by Country 2024 & 2032
- Figure 11: Latin America Product Information Management Solutions Industry Revenue Share (%), by Country 2024 & 2032
- Figure 12: Middle East and Africa Product Information Management Solutions Industry Revenue (Million), by Country 2024 & 2032
- Figure 13: Middle East and Africa Product Information Management Solutions Industry Revenue Share (%), by Country 2024 & 2032
- Figure 14: North America Product Information Management Solutions Industry Revenue (Million), by Deployment 2024 & 2032
- Figure 15: North America Product Information Management Solutions Industry Revenue Share (%), by Deployment 2024 & 2032
- Figure 16: North America Product Information Management Solutions Industry Revenue (Million), by Offering 2024 & 2032
- Figure 17: North America Product Information Management Solutions Industry Revenue Share (%), by Offering 2024 & 2032
- Figure 18: North America Product Information Management Solutions Industry Revenue (Million), by End-user Industry 2024 & 2032
- Figure 19: North America Product Information Management Solutions Industry Revenue Share (%), by End-user Industry 2024 & 2032
- Figure 20: North America Product Information Management Solutions Industry Revenue (Million), by Country 2024 & 2032
- Figure 21: North America Product Information Management Solutions Industry Revenue Share (%), by Country 2024 & 2032
- Figure 22: Europe Product Information Management Solutions Industry Revenue (Million), by Deployment 2024 & 2032
- Figure 23: Europe Product Information Management Solutions Industry Revenue Share (%), by Deployment 2024 & 2032
- Figure 24: Europe Product Information Management Solutions Industry Revenue (Million), by Offering 2024 & 2032
- Figure 25: Europe Product Information Management Solutions Industry Revenue Share (%), by Offering 2024 & 2032
- Figure 26: Europe Product Information Management Solutions Industry Revenue (Million), by End-user Industry 2024 & 2032
- Figure 27: Europe Product Information Management Solutions Industry Revenue Share (%), by End-user Industry 2024 & 2032
- Figure 28: Europe Product Information Management Solutions Industry Revenue (Million), by Country 2024 & 2032
- Figure 29: Europe Product Information Management Solutions Industry Revenue Share (%), by Country 2024 & 2032
- Figure 30: Asia Product Information Management Solutions Industry Revenue (Million), by Deployment 2024 & 2032
- Figure 31: Asia Product Information Management Solutions Industry Revenue Share (%), by Deployment 2024 & 2032
- Figure 32: Asia Product Information Management Solutions Industry Revenue (Million), by Offering 2024 & 2032
- Figure 33: Asia Product Information Management Solutions Industry Revenue Share (%), by Offering 2024 & 2032
- Figure 34: Asia Product Information Management Solutions Industry Revenue (Million), by End-user Industry 2024 & 2032
- Figure 35: Asia Product Information Management Solutions Industry Revenue Share (%), by End-user Industry 2024 & 2032
- Figure 36: Asia Product Information Management Solutions Industry Revenue (Million), by Country 2024 & 2032
- Figure 37: Asia Product Information Management Solutions Industry Revenue Share (%), by Country 2024 & 2032
- Figure 38: Australia and New Zealand Product Information Management Solutions Industry Revenue (Million), by Deployment 2024 & 2032
- Figure 39: Australia and New Zealand Product Information Management Solutions Industry Revenue Share (%), by Deployment 2024 & 2032
- Figure 40: Australia and New Zealand Product Information Management Solutions Industry Revenue (Million), by Offering 2024 & 2032
- Figure 41: Australia and New Zealand Product Information Management Solutions Industry Revenue Share (%), by Offering 2024 & 2032
- Figure 42: Australia and New Zealand Product Information Management Solutions Industry Revenue (Million), by End-user Industry 2024 & 2032
- Figure 43: Australia and New Zealand Product Information Management Solutions Industry Revenue Share (%), by End-user Industry 2024 & 2032
- Figure 44: Australia and New Zealand Product Information Management Solutions Industry Revenue (Million), by Country 2024 & 2032
- Figure 45: Australia and New Zealand Product Information Management Solutions Industry Revenue Share (%), by Country 2024 & 2032
- Figure 46: Latin America Product Information Management Solutions Industry Revenue (Million), by Deployment 2024 & 2032
- Figure 47: Latin America Product Information Management Solutions Industry Revenue Share (%), by Deployment 2024 & 2032
- Figure 48: Latin America Product Information Management Solutions Industry Revenue (Million), by Offering 2024 & 2032
- Figure 49: Latin America Product Information Management Solutions Industry Revenue Share (%), by Offering 2024 & 2032
- Figure 50: Latin America Product Information Management Solutions Industry Revenue (Million), by End-user Industry 2024 & 2032
- Figure 51: Latin America Product Information Management Solutions Industry Revenue Share (%), by End-user Industry 2024 & 2032
- Figure 52: Latin America Product Information Management Solutions Industry Revenue (Million), by Country 2024 & 2032
- Figure 53: Latin America Product Information Management Solutions Industry Revenue Share (%), by Country 2024 & 2032
- Figure 54: Middle East and Africa Product Information Management Solutions Industry Revenue (Million), by Deployment 2024 & 2032
- Figure 55: Middle East and Africa Product Information Management Solutions Industry Revenue Share (%), by Deployment 2024 & 2032
- Figure 56: Middle East and Africa Product Information Management Solutions Industry Revenue (Million), by Offering 2024 & 2032
- Figure 57: Middle East and Africa Product Information Management Solutions Industry Revenue Share (%), by Offering 2024 & 2032
- Figure 58: Middle East and Africa Product Information Management Solutions Industry Revenue (Million), by End-user Industry 2024 & 2032
- Figure 59: Middle East and Africa Product Information Management Solutions Industry Revenue Share (%), by End-user Industry 2024 & 2032
- Figure 60: Middle East and Africa Product Information Management Solutions Industry Revenue (Million), by Country 2024 & 2032
- Figure 61: Middle East and Africa Product Information Management Solutions Industry Revenue Share (%), by Country 2024 & 2032
List of Tables
- Table 1: Global Product Information Management Solutions Industry Revenue Million Forecast, by Region 2019 & 2032
- Table 2: Global Product Information Management Solutions Industry Revenue Million Forecast, by Deployment 2019 & 2032
- Table 3: Global Product Information Management Solutions Industry Revenue Million Forecast, by Offering 2019 & 2032
- Table 4: Global Product Information Management Solutions Industry Revenue Million Forecast, by End-user Industry 2019 & 2032
- Table 5: Global Product Information Management Solutions Industry Revenue Million Forecast, by Region 2019 & 2032
- Table 6: Global Product Information Management Solutions Industry Revenue Million Forecast, by Country 2019 & 2032
- Table 7: Product Information Management Solutions Industry Revenue (Million) Forecast, by Application 2019 & 2032
- Table 8: Global Product Information Management Solutions Industry Revenue Million Forecast, by Country 2019 & 2032
- Table 9: Product Information Management Solutions Industry Revenue (Million) Forecast, by Application 2019 & 2032
- Table 10: Global Product Information Management Solutions Industry Revenue Million Forecast, by Country 2019 & 2032
- Table 11: Product Information Management Solutions Industry Revenue (Million) Forecast, by Application 2019 & 2032
- Table 12: Global Product Information Management Solutions Industry Revenue Million Forecast, by Country 2019 & 2032
- Table 13: Product Information Management Solutions Industry Revenue (Million) Forecast, by Application 2019 & 2032
- Table 14: Global Product Information Management Solutions Industry Revenue Million Forecast, by Country 2019 & 2032
- Table 15: Product Information Management Solutions Industry Revenue (Million) Forecast, by Application 2019 & 2032
- Table 16: Global Product Information Management Solutions Industry Revenue Million Forecast, by Country 2019 & 2032
- Table 17: Product Information Management Solutions Industry Revenue (Million) Forecast, by Application 2019 & 2032
- Table 18: Global Product Information Management Solutions Industry Revenue Million Forecast, by Deployment 2019 & 2032
- Table 19: Global Product Information Management Solutions Industry Revenue Million Forecast, by Offering 2019 & 2032
- Table 20: Global Product Information Management Solutions Industry Revenue Million Forecast, by End-user Industry 2019 & 2032
- Table 21: Global Product Information Management Solutions Industry Revenue Million Forecast, by Country 2019 & 2032
- Table 22: Global Product Information Management Solutions Industry Revenue Million Forecast, by Deployment 2019 & 2032
- Table 23: Global Product Information Management Solutions Industry Revenue Million Forecast, by Offering 2019 & 2032
- Table 24: Global Product Information Management Solutions Industry Revenue Million Forecast, by End-user Industry 2019 & 2032
- Table 25: Global Product Information Management Solutions Industry Revenue Million Forecast, by Country 2019 & 2032
- Table 26: Global Product Information Management Solutions Industry Revenue Million Forecast, by Deployment 2019 & 2032
- Table 27: Global Product Information Management Solutions Industry Revenue Million Forecast, by Offering 2019 & 2032
- Table 28: Global Product Information Management Solutions Industry Revenue Million Forecast, by End-user Industry 2019 & 2032
- Table 29: Global Product Information Management Solutions Industry Revenue Million Forecast, by Country 2019 & 2032
- Table 30: Global Product Information Management Solutions Industry Revenue Million Forecast, by Deployment 2019 & 2032
- Table 31: Global Product Information Management Solutions Industry Revenue Million Forecast, by Offering 2019 & 2032
- Table 32: Global Product Information Management Solutions Industry Revenue Million Forecast, by End-user Industry 2019 & 2032
- Table 33: Global Product Information Management Solutions Industry Revenue Million Forecast, by Country 2019 & 2032
- Table 34: Global Product Information Management Solutions Industry Revenue Million Forecast, by Deployment 2019 & 2032
- Table 35: Global Product Information Management Solutions Industry Revenue Million Forecast, by Offering 2019 & 2032
- Table 36: Global Product Information Management Solutions Industry Revenue Million Forecast, by End-user Industry 2019 & 2032
- Table 37: Global Product Information Management Solutions Industry Revenue Million Forecast, by Country 2019 & 2032
- Table 38: Global Product Information Management Solutions Industry Revenue Million Forecast, by Deployment 2019 & 2032
- Table 39: Global Product Information Management Solutions Industry Revenue Million Forecast, by Offering 2019 & 2032
- Table 40: Global Product Information Management Solutions Industry Revenue Million Forecast, by End-user Industry 2019 & 2032
- Table 41: Global Product Information Management Solutions Industry Revenue Million Forecast, by Country 2019 & 2032
Frequently Asked Questions
1. What is the projected Compound Annual Growth Rate (CAGR) of the Product Information Management Solutions Industry?
The projected CAGR is approximately 15.41%.
2. Which companies are prominent players in the Product Information Management Solutions Industry?
Key companies in the market include Precisely Holdings LLC, Syndigo LLC, IBM Corporation, Stibo Systems Inc, Acquia Inc, Pimcore GMBH, Salsify Inc, Akeneo SAS, InRiver AB, Informatica LLC, Plytix Limited, SAP SE, Insight Software.
3. What are the main segments of the Product Information Management Solutions Industry?
The market segments include Deployment, Offering, End-user Industry.
4. Can you provide details about the market size?
The market size is estimated to be USD 15.62 Million as of 2022.
5. What are some drivers contributing to market growth?
Growing Demand for Better Customer Service; Growing Demand for Centralized Data Management Tools.
6. What are the notable trends driving market growth?
Retail Sector to Witness Growth.
7. Are there any restraints impacting market growth?
Increasing Data Breaching Cases.
8. Can you provide examples of recent developments in the market?
March 2024 - Akeneo announced it had launched the Akeneo PIM App for Salesforce on Salesforce AppExchange, an enterprise marketplace for partner apps and experts. The Akeneo App for Salesforce empowers customers to leverage complete, compelling, and consistent product information to unlock the full potential of Salesforce. Akeneo’s Product Cloud enables businesses to ingest, normalize, enrich, and centralize product information through enterprise-grade data modeling, governance, and workflows.
9. What pricing options are available for accessing the report?
Pricing options include single-user, multi-user, and enterprise licenses priced at USD 4750, USD 5250, and USD 8750 respectively.
10. Is the market size provided in terms of value or volume?
The market size is provided in terms of value, measured in Million.
11. Are there any specific market keywords associated with the report?
Yes, the market keyword associated with the report is "Product Information Management Solutions Industry," which aids in identifying and referencing the specific market segment covered.
12. How do I determine which pricing option suits my needs best?
The pricing options vary based on user requirements and access needs. Individual users may opt for single-user licenses, while businesses requiring broader access may choose multi-user or enterprise licenses for cost-effective access to the report.
13. Are there any additional resources or data provided in the Product Information Management Solutions Industry report?
While the report offers comprehensive insights, it's advisable to review the specific contents or supplementary materials provided to ascertain if additional resources or data are available.
14. How can I stay updated on further developments or reports in the Product Information Management Solutions Industry?
To stay informed about further developments, trends, and reports in the Product Information Management Solutions Industry, consider subscribing to industry newsletters, following relevant companies and organizations, or regularly checking reputable industry news sources and publications.
Methodology
Step 1 - Identification of Relevant Samples Size from Population Database


Step 2 - Approaches for Defining Global Market Size (Value, Volume* & Price*)

Note*: In applicable scenarios
Step 3 - Data Sources
Primary Research
- Web Analytics
- Survey Reports
- Research Institute
- Latest Research Reports
- Opinion Leaders
Secondary Research
- Annual Reports
- White Paper
- Latest Press Release
- Industry Association
- Paid Database
- Investor Presentations

Step 4 - Data Triangulation
Involves using different sources of information in order to increase the validity of a study
These sources are likely to be stakeholders in a program - participants, other researchers, program staff, other community members, and so on.
Then we put all data in single framework & apply various statistical tools to find out the dynamic on the market.
During the analysis stage, feedback from the stakeholder groups would be compared to determine areas of agreement as well as areas of divergence


