
Key Insights
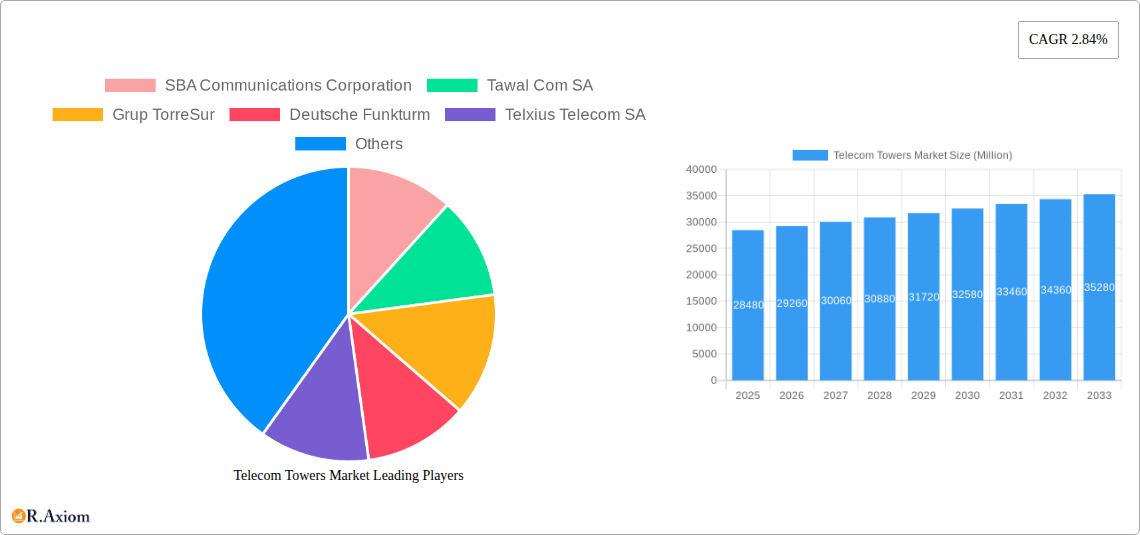
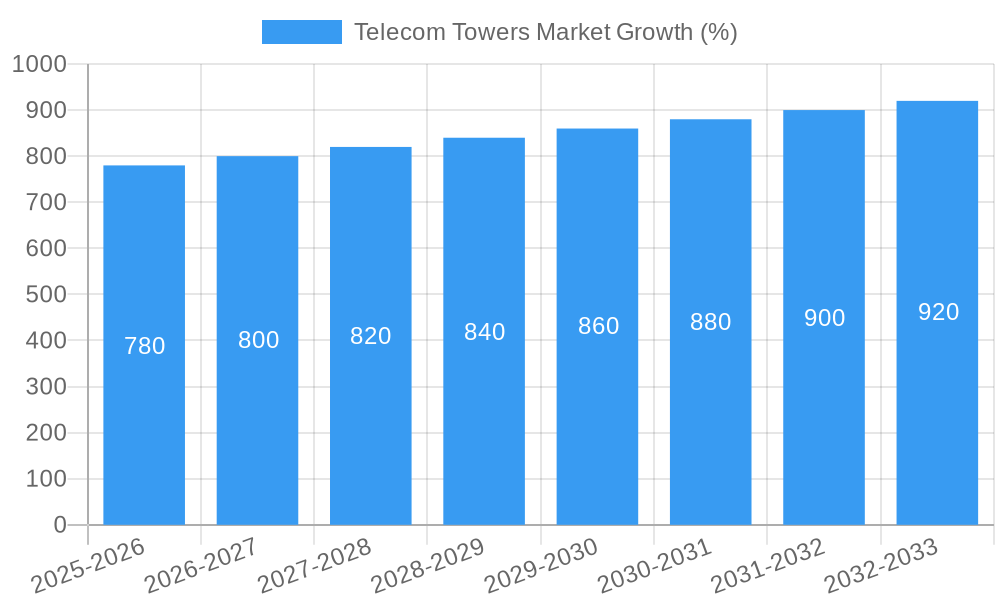
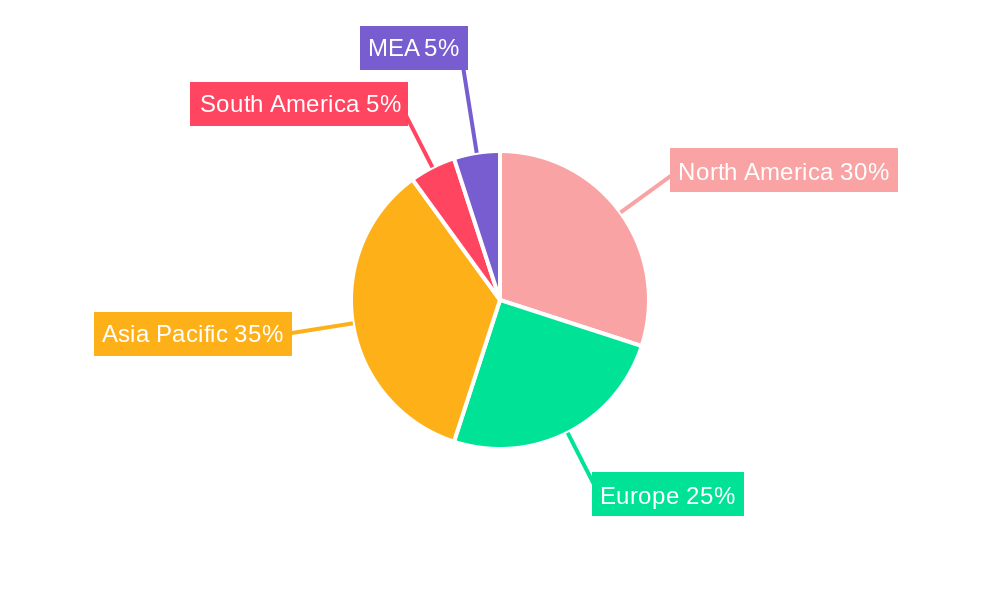
The global telecom towers market, valued at $28.48 billion in 2025, is projected to experience steady growth, driven by the expanding mobile network infrastructure, increasing demand for 5G deployment, and the rising adoption of IoT devices. A Compound Annual Growth Rate (CAGR) of 2.84% from 2025 to 2033 indicates a consistent, albeit moderate, expansion. Key growth drivers include the ongoing need for increased network capacity to support data-intensive applications, the strategic shift towards densification of networks in urban areas, and the deployment of small cells and distributed antenna systems (DAS) to improve coverage and capacity. The market is segmented by fuel type (renewable and non-renewable), tower type (lattice, guyed, monopole, stealth), installation (rooftop, ground-based), and ownership (operator-owned, joint venture, private-owned, MNO captive). While the renewable energy segment is poised for growth due to increasing environmental concerns and sustainability initiatives, the non-renewable segment currently dominates due to established infrastructure and cost-effectiveness. The competitive landscape is characterized by a mix of large multinational corporations and regional players, with key players like American Tower Corporation, SBA Communications, and Cellnex Telecom actively shaping market dynamics through strategic acquisitions and expansions. Regional variations in market growth are expected, with North America and Asia Pacific anticipated to lead due to higher levels of 5G adoption and technological advancements. However, regulatory hurdles, high initial investment costs, and competition from alternative infrastructure solutions could present challenges to market growth.
The market's growth trajectory depends significantly on the speed of 5G rollouts globally, the adoption of new technologies such as private 5G networks, and the evolving regulatory environment. Factors such as the availability of suitable locations for tower installations, land acquisition costs, and the increasing focus on shared infrastructure models also play critical roles. The strategic partnerships and mergers & acquisitions observed in the industry suggest a consolidation trend, leading to the emergence of fewer, larger players in the coming years. Furthermore, the growing importance of energy efficiency and sustainability in the telecom sector will likely drive the demand for renewable energy solutions within telecom towers, representing a significant long-term growth opportunity. Overall, the telecom towers market presents a stable and moderately growing opportunity, driven by the insatiable demand for improved mobile connectivity across the globe.
Telecom Towers Market: A Comprehensive Report (2019-2033)
This in-depth report provides a comprehensive analysis of the global Telecom Towers Market, covering the period from 2019 to 2033. It offers actionable insights for industry stakeholders, investors, and strategic decision-makers, encompassing market size estimations, segment-wise growth projections, competitive landscape analysis, and future outlook. The report leverages extensive primary and secondary research, incorporating data from leading market players, industry publications, and government reports.
Telecom Towers Market Concentration & Innovation
The global telecom towers market is characterized by a moderately concentrated structure, with a few major players holding significant market share. American Tower Corporation, Crown Castle International Corporation, and SBA Communications Corporation are among the leading global players, each controlling substantial portions of the market. However, regional variations exist, with significant presence of local players in emerging markets. Market concentration is expected to remain relatively stable over the forecast period although mergers and acquisitions (M&A) will continue to reshape the landscape.
Innovation Drivers: The market is driven by continuous innovation in tower technology, including the deployment of 5G infrastructure, small cells, and the integration of renewable energy sources. The demand for higher bandwidth and improved network coverage fuels the need for enhanced tower infrastructure.
Regulatory Frameworks: Stringent regulations related to tower construction, safety standards, and environmental impact assessments significantly influence market dynamics. Varied regulatory landscapes across different regions necessitate a tailored approach for tower deployment and operations.
Product Substitutes: While traditional macrocell towers remain the dominant infrastructure, alternative technologies like small cells and distributed antenna systems (DAS) are emerging as substitutes for specific applications. These substitutes are driven by the need for improved capacity and coverage in high-density areas.
End-User Trends: The increasing demand for high-speed data and improved network coverage from both consumers and enterprises drives the demand for additional towers. The expansion of 5G networks globally is a key end-user trend accelerating tower installations.
M&A Activities: The telecom towers sector has witnessed considerable M&A activity in recent years. The acquisition of United Group's infrastructure by Tawal in April 2023 for USD 1.34 Billion exemplifies this trend, highlighting a focus on expanding geographic reach and consolidating market power. These transactions significantly influence market share and competitive dynamics. Deal values are in the billions of USD, with larger companies strategically acquiring smaller firms to strengthen their positions.
Telecom Towers Market Industry Trends & Insights
The global telecom towers market is experiencing robust growth, driven by the exponential rise in mobile data consumption, rapid 5G network deployments, and increasing demand for reliable connectivity in both urban and rural areas. The market is estimated to be worth xx Million in 2025 and is projected to reach xx Million by 2033, exhibiting a Compound Annual Growth Rate (CAGR) of xx% during the forecast period (2025-2033). Market penetration is also increasing as mobile network operators (MNOs) strive to enhance network infrastructure to meet the ever-growing user demands for faster data speeds and broader network coverage.
Technological disruptions, such as the transition to 5G and the adoption of innovative tower designs (stealth towers), are shaping the market landscape. Consumer preference for seamless connectivity and high-quality mobile experiences is driving investment in network modernization, thereby boosting demand for advanced telecom tower infrastructure. The competitive dynamics are intense, with a mix of large multinational companies and smaller, regional players vying for market share. Companies are adopting various strategies like mergers and acquisitions, technological innovation, and strategic partnerships to maintain a competitive edge.
Dominant Markets & Segments in Telecom Towers Market
The Asia-Pacific region is currently the dominant market for telecom towers, driven by factors such as a large and growing mobile subscriber base, rapid economic development, and significant investments in network infrastructure expansion. Within the region, India and China are leading national markets.
- Key Drivers in Asia-Pacific:
- High mobile penetration rates
- Rapid urbanization and increasing smartphone usage
- Government initiatives promoting digital inclusion and broadband penetration
- Favorable regulatory environment encouraging private sector investment
Segment Dominance Analysis:
- By Fuel Type: Non-renewable sources currently dominate, but renewable energy integration is increasing due to sustainability concerns and cost efficiency.
- By Type of Tower: Monopole towers currently hold the largest market share due to their cost-effectiveness and adaptability. However, stealth towers are gaining traction due to aesthetic considerations and ease of deployment.
- By Installation: Ground-based installations account for the largest segment.
- By Ownership: Operator-owned towers currently dominate, followed by private-owned. However, joint ventures and MNO captive models are also prominent.
The dominance of each segment is influenced by factors like technological advancements, cost considerations, and regulatory frameworks. The demand for efficient, sustainable, and aesthetically pleasing tower solutions will continue to shape the market.
Telecom Towers Market Product Developments
Recent product innovations focus on optimizing tower design for 5G deployment, enhancing energy efficiency through renewable energy integration, and improving tower aesthetics for better community acceptance. The integration of smart sensors and IoT capabilities is also gaining momentum, enabling remote monitoring and predictive maintenance. These developments reflect a shift towards more sustainable, efficient, and intelligent tower solutions, enhancing their overall value proposition.
Report Scope & Segmentation Analysis
This report analyzes the telecom towers market across various segments:
By Fuel Type: Renewable (solar, wind) and Non-renewable (diesel, grid electricity). Growth is expected to be faster in renewable energy sources due to environmental concerns and policy initiatives.
By Type of Tower: Lattice Tower, Guyed Tower, Monopole Towers, and Stealth Towers. Market size varies based on the specific application and geographic location. Monopole towers dominate due to cost efficiency and flexibility.
By Installation: Rooftop and Ground-based. Ground-based installations are predominantly larger in scale and dominate.
By Ownership: Operator-owned, Joint Venture, Private-owned, and MNO Captive. Operator-owned towers maintain a major market share, but joint ventures are increasingly common.
Each segment presents unique growth opportunities and competitive dynamics, reflecting specific technological and economic drivers.
Key Drivers of Telecom Towers Market Growth
Several factors drive growth in the telecom towers market:
- The proliferation of mobile devices and escalating data consumption.
- Extensive 5G network rollouts globally.
- Increasing demand for improved network coverage and capacity in both urban and rural areas.
- Government initiatives promoting infrastructure development and digital inclusion.
- Continuous innovation in tower technology, leading to more efficient and sustainable solutions.
Challenges in the Telecom Towers Market Sector
Challenges impacting the telecom towers market include:
- Stringent regulatory approvals and environmental concerns related to tower construction.
- Supply chain disruptions, impacting the availability and cost of materials.
- Intense competition from established players and new entrants.
- Finding suitable locations for tower installations, especially in densely populated areas.
- The increasing cost of land acquisition and related permits.
Emerging Opportunities in Telecom Towers Market
Emerging opportunities include:
- The growing adoption of small cells and distributed antenna systems (DAS) to enhance network capacity in high-density areas.
- The integration of renewable energy sources to reduce operational costs and improve environmental sustainability.
- Expanding into underserved rural markets with improved network connectivity.
- The potential for tower infrastructure to support other applications, such as smart city initiatives and IoT deployments.
- The emergence of tower colocation to boost efficiency and reduce the environmental impact.
Leading Players in the Telecom Towers Market Market
- SBA Communications Corporation
- Tawal Com SA
- Grup TorreSur
- Deutsche Funkturm
- Telxius Telecom SA
- Cellnex Telecom
- Telesites SAB de CV
- IHS Towers (IHS Holding Limited)
- Zong Pakistan
- Telkom Indonesia
- Helios Towers Africa
- American Tower Corporation
- China Tower Corporation
- Orange
- Indus Towers Limited (Bharti Infratel)
- First Tower Company
- Telenor ASA
- GTL Infrastructure Limited
- Crown Castle International Corporation
- AT&T Inc
- T-Mobile USA Inc
Key Developments in Telecom Towers Market Industry
April 2023: The Government of India launched 254 4G mobile towers in Arunachal Pradesh, providing 4G coverage to 336 villages. This initiative aims to improve connectivity in border areas and enhance digital inclusion.
April 2023: Tawal, a subsidiary of Saudi Telecom Company (STC), acquired United Group's tower infrastructure for USD 1.34 billion, expanding its international presence.
Strategic Outlook for Telecom Towers Market Market
The future of the telecom towers market is bright, driven by continued growth in mobile data consumption, ongoing 5G network deployments, and the increasing adoption of advanced tower technologies. Opportunities exist in expanding into new markets, developing innovative tower designs, and integrating renewable energy solutions. Companies that can adapt to changing market dynamics, embrace technological advancements, and prioritize sustainability will be well-positioned for success in this dynamic sector.
Telecom Towers Market Segmentation
-
1. Fuel Type
- 1.1. Renewable
- 1.2. Non-renewable
-
2. Type of Tower
- 2.1. Lattice Tower
- 2.2. Guyed Tower
- 2.3. Monopole Towers
- 2.4. Stealth Towers
-
3. Installation
- 3.1. Rooftop
- 3.2. Ground-based
-
4. Ownership
- 4.1. Operator-owned
- 4.2. Joint Venture
- 4.3. Private-owned
- 4.4. MNO Captive
Telecom Towers Market Segmentation By Geography
-
1. North America
- 1.1. United States
- 1.2. Canada
-
2. Europe
- 2.1. United Kingdom
- 2.2. Germany
- 2.3. France
- 2.4. Italy
- 2.5. Spain
- 2.6. Netherlands
- 2.7. Sweden
- 2.8. Switzerland
- 2.9. Rest of Europe
-
3. Asia Pacific
- 3.1. China
- 3.2. India
- 3.3. Japan
- 3.4. South Korea
- 3.5. Indonesia
- 3.6. Vietnam
- 3.7. Malaysia
- 3.8. Philippines
- 3.9. Australia and New Zealand
- 3.10. Rest of Asia Pacific
-
4. Latin America
- 4.1. Brazil
- 4.2. Mexico
- 4.3. Argentina
- 4.4. Rest of Latin America
-
5. Middle East and Africa
- 5.1. Saudi Arabia
- 5.2. Egypt
- 5.3. Algeria
- 5.4. Nigeria
- 5.5. South Africa
- 5.6. Tanzania
- 5.7. Morocco
- 5.8. Rest of Middle East and Africa
Telecom Towers Market REPORT HIGHLIGHTS
| Aspects | Details |
|---|---|
| Study Period | 2019-2033 |
| Base Year | 2024 |
| Estimated Year | 2025 |
| Forecast Period | 2025-2033 |
| Historical Period | 2019-2024 |
| Growth Rate | CAGR of 2.84% from 2019-2033 |
| Segmentation |
|
Table of Contents
- 1. Introduction
- 1.1. Research Scope
- 1.2. Market Segmentation
- 1.3. Research Methodology
- 1.4. Definitions and Assumptions
- 2. Executive Summary
- 2.1. Introduction
- 3. Market Dynamics
- 3.1. Introduction
- 3.2. Market Drivers
- 3.2.1. Connecting/Improving Connectivity to Rural Areas; Improving and Catering to Increasing Data Needs
- 3.3. Market Restrains
- 3.3.1. ; High Initial Investment and Cost of Maintenance
- 3.4. Market Trends
- 3.4.1. Operator-owned Tower is Expected to Register a Significant Growth
- 4. Market Factor Analysis
- 4.1. Porters Five Forces
- 4.2. Supply/Value Chain
- 4.3. PESTEL analysis
- 4.4. Market Entropy
- 4.5. Patent/Trademark Analysis
- 5. Global Telecom Towers Market Analysis, Insights and Forecast, 2019-2031
- 5.1. Market Analysis, Insights and Forecast - by Fuel Type
- 5.1.1. Renewable
- 5.1.2. Non-renewable
- 5.2. Market Analysis, Insights and Forecast - by Type of Tower
- 5.2.1. Lattice Tower
- 5.2.2. Guyed Tower
- 5.2.3. Monopole Towers
- 5.2.4. Stealth Towers
- 5.3. Market Analysis, Insights and Forecast - by Installation
- 5.3.1. Rooftop
- 5.3.2. Ground-based
- 5.4. Market Analysis, Insights and Forecast - by Ownership
- 5.4.1. Operator-owned
- 5.4.2. Joint Venture
- 5.4.3. Private-owned
- 5.4.4. MNO Captive
- 5.5. Market Analysis, Insights and Forecast - by Region
- 5.5.1. North America
- 5.5.2. Europe
- 5.5.3. Asia Pacific
- 5.5.4. Latin America
- 5.5.5. Middle East and Africa
- 5.1. Market Analysis, Insights and Forecast - by Fuel Type
- 6. North America Telecom Towers Market Analysis, Insights and Forecast, 2019-2031
- 6.1. Market Analysis, Insights and Forecast - by Fuel Type
- 6.1.1. Renewable
- 6.1.2. Non-renewable
- 6.2. Market Analysis, Insights and Forecast - by Type of Tower
- 6.2.1. Lattice Tower
- 6.2.2. Guyed Tower
- 6.2.3. Monopole Towers
- 6.2.4. Stealth Towers
- 6.3. Market Analysis, Insights and Forecast - by Installation
- 6.3.1. Rooftop
- 6.3.2. Ground-based
- 6.4. Market Analysis, Insights and Forecast - by Ownership
- 6.4.1. Operator-owned
- 6.4.2. Joint Venture
- 6.4.3. Private-owned
- 6.4.4. MNO Captive
- 6.1. Market Analysis, Insights and Forecast - by Fuel Type
- 7. Europe Telecom Towers Market Analysis, Insights and Forecast, 2019-2031
- 7.1. Market Analysis, Insights and Forecast - by Fuel Type
- 7.1.1. Renewable
- 7.1.2. Non-renewable
- 7.2. Market Analysis, Insights and Forecast - by Type of Tower
- 7.2.1. Lattice Tower
- 7.2.2. Guyed Tower
- 7.2.3. Monopole Towers
- 7.2.4. Stealth Towers
- 7.3. Market Analysis, Insights and Forecast - by Installation
- 7.3.1. Rooftop
- 7.3.2. Ground-based
- 7.4. Market Analysis, Insights and Forecast - by Ownership
- 7.4.1. Operator-owned
- 7.4.2. Joint Venture
- 7.4.3. Private-owned
- 7.4.4. MNO Captive
- 7.1. Market Analysis, Insights and Forecast - by Fuel Type
- 8. Asia Pacific Telecom Towers Market Analysis, Insights and Forecast, 2019-2031
- 8.1. Market Analysis, Insights and Forecast - by Fuel Type
- 8.1.1. Renewable
- 8.1.2. Non-renewable
- 8.2. Market Analysis, Insights and Forecast - by Type of Tower
- 8.2.1. Lattice Tower
- 8.2.2. Guyed Tower
- 8.2.3. Monopole Towers
- 8.2.4. Stealth Towers
- 8.3. Market Analysis, Insights and Forecast - by Installation
- 8.3.1. Rooftop
- 8.3.2. Ground-based
- 8.4. Market Analysis, Insights and Forecast - by Ownership
- 8.4.1. Operator-owned
- 8.4.2. Joint Venture
- 8.4.3. Private-owned
- 8.4.4. MNO Captive
- 8.1. Market Analysis, Insights and Forecast - by Fuel Type
- 9. Latin America Telecom Towers Market Analysis, Insights and Forecast, 2019-2031
- 9.1. Market Analysis, Insights and Forecast - by Fuel Type
- 9.1.1. Renewable
- 9.1.2. Non-renewable
- 9.2. Market Analysis, Insights and Forecast - by Type of Tower
- 9.2.1. Lattice Tower
- 9.2.2. Guyed Tower
- 9.2.3. Monopole Towers
- 9.2.4. Stealth Towers
- 9.3. Market Analysis, Insights and Forecast - by Installation
- 9.3.1. Rooftop
- 9.3.2. Ground-based
- 9.4. Market Analysis, Insights and Forecast - by Ownership
- 9.4.1. Operator-owned
- 9.4.2. Joint Venture
- 9.4.3. Private-owned
- 9.4.4. MNO Captive
- 9.1. Market Analysis, Insights and Forecast - by Fuel Type
- 10. Middle East and Africa Telecom Towers Market Analysis, Insights and Forecast, 2019-2031
- 10.1. Market Analysis, Insights and Forecast - by Fuel Type
- 10.1.1. Renewable
- 10.1.2. Non-renewable
- 10.2. Market Analysis, Insights and Forecast - by Type of Tower
- 10.2.1. Lattice Tower
- 10.2.2. Guyed Tower
- 10.2.3. Monopole Towers
- 10.2.4. Stealth Towers
- 10.3. Market Analysis, Insights and Forecast - by Installation
- 10.3.1. Rooftop
- 10.3.2. Ground-based
- 10.4. Market Analysis, Insights and Forecast - by Ownership
- 10.4.1. Operator-owned
- 10.4.2. Joint Venture
- 10.4.3. Private-owned
- 10.4.4. MNO Captive
- 10.1. Market Analysis, Insights and Forecast - by Fuel Type
- 11. North America Telecom Towers Market Analysis, Insights and Forecast, 2019-2031
- 11.1. Market Analysis, Insights and Forecast - By Country/Sub-region
- 11.1.1 United States
- 11.1.2 Canada
- 11.1.3 Mexico
- 12. Europe Telecom Towers Market Analysis, Insights and Forecast, 2019-2031
- 12.1. Market Analysis, Insights and Forecast - By Country/Sub-region
- 12.1.1 Germany
- 12.1.2 United Kingdom
- 12.1.3 France
- 12.1.4 Spain
- 12.1.5 Italy
- 12.1.6 Spain
- 12.1.7 Belgium
- 12.1.8 Netherland
- 12.1.9 Nordics
- 12.1.10 Rest of Europe
- 13. Asia Pacific Telecom Towers Market Analysis, Insights and Forecast, 2019-2031
- 13.1. Market Analysis, Insights and Forecast - By Country/Sub-region
- 13.1.1 China
- 13.1.2 Japan
- 13.1.3 India
- 13.1.4 South Korea
- 13.1.5 Southeast Asia
- 13.1.6 Australia
- 13.1.7 Indonesia
- 13.1.8 Phillipes
- 13.1.9 Singapore
- 13.1.10 Thailandc
- 13.1.11 Rest of Asia Pacific
- 14. South America Telecom Towers Market Analysis, Insights and Forecast, 2019-2031
- 14.1. Market Analysis, Insights and Forecast - By Country/Sub-region
- 14.1.1 Brazil
- 14.1.2 Argentina
- 14.1.3 Peru
- 14.1.4 Chile
- 14.1.5 Colombia
- 14.1.6 Ecuador
- 14.1.7 Venezuela
- 14.1.8 Rest of South America
- 15. North America Telecom Towers Market Analysis, Insights and Forecast, 2019-2031
- 15.1. Market Analysis, Insights and Forecast - By Country/Sub-region
- 15.1.1 United States
- 15.1.2 Canada
- 15.1.3 Mexico
- 16. MEA Telecom Towers Market Analysis, Insights and Forecast, 2019-2031
- 16.1. Market Analysis, Insights and Forecast - By Country/Sub-region
- 16.1.1 United Arab Emirates
- 16.1.2 Saudi Arabia
- 16.1.3 South Africa
- 16.1.4 Rest of Middle East and Africa
- 17. Competitive Analysis
- 17.1. Global Market Share Analysis 2024
- 17.2. Company Profiles
- 17.2.1 SBA Communications Corporation
- 17.2.1.1. Overview
- 17.2.1.2. Products
- 17.2.1.3. SWOT Analysis
- 17.2.1.4. Recent Developments
- 17.2.1.5. Financials (Based on Availability)
- 17.2.2 Tawal Com SA
- 17.2.2.1. Overview
- 17.2.2.2. Products
- 17.2.2.3. SWOT Analysis
- 17.2.2.4. Recent Developments
- 17.2.2.5. Financials (Based on Availability)
- 17.2.3 Grup TorreSur
- 17.2.3.1. Overview
- 17.2.3.2. Products
- 17.2.3.3. SWOT Analysis
- 17.2.3.4. Recent Developments
- 17.2.3.5. Financials (Based on Availability)
- 17.2.4 Deutsche Funkturm
- 17.2.4.1. Overview
- 17.2.4.2. Products
- 17.2.4.3. SWOT Analysis
- 17.2.4.4. Recent Developments
- 17.2.4.5. Financials (Based on Availability)
- 17.2.5 Telxius Telecom SA
- 17.2.5.1. Overview
- 17.2.5.2. Products
- 17.2.5.3. SWOT Analysis
- 17.2.5.4. Recent Developments
- 17.2.5.5. Financials (Based on Availability)
- 17.2.6 CellnexTelecom
- 17.2.6.1. Overview
- 17.2.6.2. Products
- 17.2.6.3. SWOT Analysis
- 17.2.6.4. Recent Developments
- 17.2.6.5. Financials (Based on Availability)
- 17.2.7 Telesites SAB de CV
- 17.2.7.1. Overview
- 17.2.7.2. Products
- 17.2.7.3. SWOT Analysis
- 17.2.7.4. Recent Developments
- 17.2.7.5. Financials (Based on Availability)
- 17.2.8 IHS Towers (IHS Holding Limited)
- 17.2.8.1. Overview
- 17.2.8.2. Products
- 17.2.8.3. SWOT Analysis
- 17.2.8.4. Recent Developments
- 17.2.8.5. Financials (Based on Availability)
- 17.2.9 Zong Pakistan
- 17.2.9.1. Overview
- 17.2.9.2. Products
- 17.2.9.3. SWOT Analysis
- 17.2.9.4. Recent Developments
- 17.2.9.5. Financials (Based on Availability)
- 17.2.10 Telkom Indonesia
- 17.2.10.1. Overview
- 17.2.10.2. Products
- 17.2.10.3. SWOT Analysis
- 17.2.10.4. Recent Developments
- 17.2.10.5. Financials (Based on Availability)
- 17.2.11 Helios Towers Africa
- 17.2.11.1. Overview
- 17.2.11.2. Products
- 17.2.11.3. SWOT Analysis
- 17.2.11.4. Recent Developments
- 17.2.11.5. Financials (Based on Availability)
- 17.2.12 American Tower Corporation
- 17.2.12.1. Overview
- 17.2.12.2. Products
- 17.2.12.3. SWOT Analysis
- 17.2.12.4. Recent Developments
- 17.2.12.5. Financials (Based on Availability)
- 17.2.13 China Tower Corporation
- 17.2.13.1. Overview
- 17.2.13.2. Products
- 17.2.13.3. SWOT Analysis
- 17.2.13.4. Recent Developments
- 17.2.13.5. Financials (Based on Availability)
- 17.2.14 Orange
- 17.2.14.1. Overview
- 17.2.14.2. Products
- 17.2.14.3. SWOT Analysis
- 17.2.14.4. Recent Developments
- 17.2.14.5. Financials (Based on Availability)
- 17.2.15 Indus Towers Limited (Bharti Infratel)
- 17.2.15.1. Overview
- 17.2.15.2. Products
- 17.2.15.3. SWOT Analysis
- 17.2.15.4. Recent Developments
- 17.2.15.5. Financials (Based on Availability)
- 17.2.16 First Tower Company
- 17.2.16.1. Overview
- 17.2.16.2. Products
- 17.2.16.3. SWOT Analysis
- 17.2.16.4. Recent Developments
- 17.2.16.5. Financials (Based on Availability)
- 17.2.17 Telenor ASA
- 17.2.17.1. Overview
- 17.2.17.2. Products
- 17.2.17.3. SWOT Analysis
- 17.2.17.4. Recent Developments
- 17.2.17.5. Financials (Based on Availability)
- 17.2.18 GTL Infrastructure Limited
- 17.2.18.1. Overview
- 17.2.18.2. Products
- 17.2.18.3. SWOT Analysis
- 17.2.18.4. Recent Developments
- 17.2.18.5. Financials (Based on Availability)
- 17.2.19 Crown Castle International Corporation
- 17.2.19.1. Overview
- 17.2.19.2. Products
- 17.2.19.3. SWOT Analysis
- 17.2.19.4. Recent Developments
- 17.2.19.5. Financials (Based on Availability)
- 17.2.20 AT&T Inc
- 17.2.20.1. Overview
- 17.2.20.2. Products
- 17.2.20.3. SWOT Analysis
- 17.2.20.4. Recent Developments
- 17.2.20.5. Financials (Based on Availability)
- 17.2.21 T-Mobile USA Inc
- 17.2.21.1. Overview
- 17.2.21.2. Products
- 17.2.21.3. SWOT Analysis
- 17.2.21.4. Recent Developments
- 17.2.21.5. Financials (Based on Availability)
- 17.2.1 SBA Communications Corporation
List of Figures
- Figure 1: Global Telecom Towers Market Revenue Breakdown (Million, %) by Region 2024 & 2032
- Figure 2: Global Telecom Towers Market Volume Breakdown (K Unit, %) by Region 2024 & 2032
- Figure 3: North America Telecom Towers Market Revenue (Million), by Country 2024 & 2032
- Figure 4: North America Telecom Towers Market Volume (K Unit), by Country 2024 & 2032
- Figure 5: North America Telecom Towers Market Revenue Share (%), by Country 2024 & 2032
- Figure 6: North America Telecom Towers Market Volume Share (%), by Country 2024 & 2032
- Figure 7: Europe Telecom Towers Market Revenue (Million), by Country 2024 & 2032
- Figure 8: Europe Telecom Towers Market Volume (K Unit), by Country 2024 & 2032
- Figure 9: Europe Telecom Towers Market Revenue Share (%), by Country 2024 & 2032
- Figure 10: Europe Telecom Towers Market Volume Share (%), by Country 2024 & 2032
- Figure 11: Asia Pacific Telecom Towers Market Revenue (Million), by Country 2024 & 2032
- Figure 12: Asia Pacific Telecom Towers Market Volume (K Unit), by Country 2024 & 2032
- Figure 13: Asia Pacific Telecom Towers Market Revenue Share (%), by Country 2024 & 2032
- Figure 14: Asia Pacific Telecom Towers Market Volume Share (%), by Country 2024 & 2032
- Figure 15: South America Telecom Towers Market Revenue (Million), by Country 2024 & 2032
- Figure 16: South America Telecom Towers Market Volume (K Unit), by Country 2024 & 2032
- Figure 17: South America Telecom Towers Market Revenue Share (%), by Country 2024 & 2032
- Figure 18: South America Telecom Towers Market Volume Share (%), by Country 2024 & 2032
- Figure 19: North America Telecom Towers Market Revenue (Million), by Country 2024 & 2032
- Figure 20: North America Telecom Towers Market Volume (K Unit), by Country 2024 & 2032
- Figure 21: North America Telecom Towers Market Revenue Share (%), by Country 2024 & 2032
- Figure 22: North America Telecom Towers Market Volume Share (%), by Country 2024 & 2032
- Figure 23: MEA Telecom Towers Market Revenue (Million), by Country 2024 & 2032
- Figure 24: MEA Telecom Towers Market Volume (K Unit), by Country 2024 & 2032
- Figure 25: MEA Telecom Towers Market Revenue Share (%), by Country 2024 & 2032
- Figure 26: MEA Telecom Towers Market Volume Share (%), by Country 2024 & 2032
- Figure 27: North America Telecom Towers Market Revenue (Million), by Fuel Type 2024 & 2032
- Figure 28: North America Telecom Towers Market Volume (K Unit), by Fuel Type 2024 & 2032
- Figure 29: North America Telecom Towers Market Revenue Share (%), by Fuel Type 2024 & 2032
- Figure 30: North America Telecom Towers Market Volume Share (%), by Fuel Type 2024 & 2032
- Figure 31: North America Telecom Towers Market Revenue (Million), by Type of Tower 2024 & 2032
- Figure 32: North America Telecom Towers Market Volume (K Unit), by Type of Tower 2024 & 2032
- Figure 33: North America Telecom Towers Market Revenue Share (%), by Type of Tower 2024 & 2032
- Figure 34: North America Telecom Towers Market Volume Share (%), by Type of Tower 2024 & 2032
- Figure 35: North America Telecom Towers Market Revenue (Million), by Installation 2024 & 2032
- Figure 36: North America Telecom Towers Market Volume (K Unit), by Installation 2024 & 2032
- Figure 37: North America Telecom Towers Market Revenue Share (%), by Installation 2024 & 2032
- Figure 38: North America Telecom Towers Market Volume Share (%), by Installation 2024 & 2032
- Figure 39: North America Telecom Towers Market Revenue (Million), by Ownership 2024 & 2032
- Figure 40: North America Telecom Towers Market Volume (K Unit), by Ownership 2024 & 2032
- Figure 41: North America Telecom Towers Market Revenue Share (%), by Ownership 2024 & 2032
- Figure 42: North America Telecom Towers Market Volume Share (%), by Ownership 2024 & 2032
- Figure 43: North America Telecom Towers Market Revenue (Million), by Country 2024 & 2032
- Figure 44: North America Telecom Towers Market Volume (K Unit), by Country 2024 & 2032
- Figure 45: North America Telecom Towers Market Revenue Share (%), by Country 2024 & 2032
- Figure 46: North America Telecom Towers Market Volume Share (%), by Country 2024 & 2032
- Figure 47: Europe Telecom Towers Market Revenue (Million), by Fuel Type 2024 & 2032
- Figure 48: Europe Telecom Towers Market Volume (K Unit), by Fuel Type 2024 & 2032
- Figure 49: Europe Telecom Towers Market Revenue Share (%), by Fuel Type 2024 & 2032
- Figure 50: Europe Telecom Towers Market Volume Share (%), by Fuel Type 2024 & 2032
- Figure 51: Europe Telecom Towers Market Revenue (Million), by Type of Tower 2024 & 2032
- Figure 52: Europe Telecom Towers Market Volume (K Unit), by Type of Tower 2024 & 2032
- Figure 53: Europe Telecom Towers Market Revenue Share (%), by Type of Tower 2024 & 2032
- Figure 54: Europe Telecom Towers Market Volume Share (%), by Type of Tower 2024 & 2032
- Figure 55: Europe Telecom Towers Market Revenue (Million), by Installation 2024 & 2032
- Figure 56: Europe Telecom Towers Market Volume (K Unit), by Installation 2024 & 2032
- Figure 57: Europe Telecom Towers Market Revenue Share (%), by Installation 2024 & 2032
- Figure 58: Europe Telecom Towers Market Volume Share (%), by Installation 2024 & 2032
- Figure 59: Europe Telecom Towers Market Revenue (Million), by Ownership 2024 & 2032
- Figure 60: Europe Telecom Towers Market Volume (K Unit), by Ownership 2024 & 2032
- Figure 61: Europe Telecom Towers Market Revenue Share (%), by Ownership 2024 & 2032
- Figure 62: Europe Telecom Towers Market Volume Share (%), by Ownership 2024 & 2032
- Figure 63: Europe Telecom Towers Market Revenue (Million), by Country 2024 & 2032
- Figure 64: Europe Telecom Towers Market Volume (K Unit), by Country 2024 & 2032
- Figure 65: Europe Telecom Towers Market Revenue Share (%), by Country 2024 & 2032
- Figure 66: Europe Telecom Towers Market Volume Share (%), by Country 2024 & 2032
- Figure 67: Asia Pacific Telecom Towers Market Revenue (Million), by Fuel Type 2024 & 2032
- Figure 68: Asia Pacific Telecom Towers Market Volume (K Unit), by Fuel Type 2024 & 2032
- Figure 69: Asia Pacific Telecom Towers Market Revenue Share (%), by Fuel Type 2024 & 2032
- Figure 70: Asia Pacific Telecom Towers Market Volume Share (%), by Fuel Type 2024 & 2032
- Figure 71: Asia Pacific Telecom Towers Market Revenue (Million), by Type of Tower 2024 & 2032
- Figure 72: Asia Pacific Telecom Towers Market Volume (K Unit), by Type of Tower 2024 & 2032
- Figure 73: Asia Pacific Telecom Towers Market Revenue Share (%), by Type of Tower 2024 & 2032
- Figure 74: Asia Pacific Telecom Towers Market Volume Share (%), by Type of Tower 2024 & 2032
- Figure 75: Asia Pacific Telecom Towers Market Revenue (Million), by Installation 2024 & 2032
- Figure 76: Asia Pacific Telecom Towers Market Volume (K Unit), by Installation 2024 & 2032
- Figure 77: Asia Pacific Telecom Towers Market Revenue Share (%), by Installation 2024 & 2032
- Figure 78: Asia Pacific Telecom Towers Market Volume Share (%), by Installation 2024 & 2032
- Figure 79: Asia Pacific Telecom Towers Market Revenue (Million), by Ownership 2024 & 2032
- Figure 80: Asia Pacific Telecom Towers Market Volume (K Unit), by Ownership 2024 & 2032
- Figure 81: Asia Pacific Telecom Towers Market Revenue Share (%), by Ownership 2024 & 2032
- Figure 82: Asia Pacific Telecom Towers Market Volume Share (%), by Ownership 2024 & 2032
- Figure 83: Asia Pacific Telecom Towers Market Revenue (Million), by Country 2024 & 2032
- Figure 84: Asia Pacific Telecom Towers Market Volume (K Unit), by Country 2024 & 2032
- Figure 85: Asia Pacific Telecom Towers Market Revenue Share (%), by Country 2024 & 2032
- Figure 86: Asia Pacific Telecom Towers Market Volume Share (%), by Country 2024 & 2032
- Figure 87: Latin America Telecom Towers Market Revenue (Million), by Fuel Type 2024 & 2032
- Figure 88: Latin America Telecom Towers Market Volume (K Unit), by Fuel Type 2024 & 2032
- Figure 89: Latin America Telecom Towers Market Revenue Share (%), by Fuel Type 2024 & 2032
- Figure 90: Latin America Telecom Towers Market Volume Share (%), by Fuel Type 2024 & 2032
- Figure 91: Latin America Telecom Towers Market Revenue (Million), by Type of Tower 2024 & 2032
- Figure 92: Latin America Telecom Towers Market Volume (K Unit), by Type of Tower 2024 & 2032
- Figure 93: Latin America Telecom Towers Market Revenue Share (%), by Type of Tower 2024 & 2032
- Figure 94: Latin America Telecom Towers Market Volume Share (%), by Type of Tower 2024 & 2032
- Figure 95: Latin America Telecom Towers Market Revenue (Million), by Installation 2024 & 2032
- Figure 96: Latin America Telecom Towers Market Volume (K Unit), by Installation 2024 & 2032
- Figure 97: Latin America Telecom Towers Market Revenue Share (%), by Installation 2024 & 2032
- Figure 98: Latin America Telecom Towers Market Volume Share (%), by Installation 2024 & 2032
- Figure 99: Latin America Telecom Towers Market Revenue (Million), by Ownership 2024 & 2032
- Figure 100: Latin America Telecom Towers Market Volume (K Unit), by Ownership 2024 & 2032
- Figure 101: Latin America Telecom Towers Market Revenue Share (%), by Ownership 2024 & 2032
- Figure 102: Latin America Telecom Towers Market Volume Share (%), by Ownership 2024 & 2032
- Figure 103: Latin America Telecom Towers Market Revenue (Million), by Country 2024 & 2032
- Figure 104: Latin America Telecom Towers Market Volume (K Unit), by Country 2024 & 2032
- Figure 105: Latin America Telecom Towers Market Revenue Share (%), by Country 2024 & 2032
- Figure 106: Latin America Telecom Towers Market Volume Share (%), by Country 2024 & 2032
- Figure 107: Middle East and Africa Telecom Towers Market Revenue (Million), by Fuel Type 2024 & 2032
- Figure 108: Middle East and Africa Telecom Towers Market Volume (K Unit), by Fuel Type 2024 & 2032
- Figure 109: Middle East and Africa Telecom Towers Market Revenue Share (%), by Fuel Type 2024 & 2032
- Figure 110: Middle East and Africa Telecom Towers Market Volume Share (%), by Fuel Type 2024 & 2032
- Figure 111: Middle East and Africa Telecom Towers Market Revenue (Million), by Type of Tower 2024 & 2032
- Figure 112: Middle East and Africa Telecom Towers Market Volume (K Unit), by Type of Tower 2024 & 2032
- Figure 113: Middle East and Africa Telecom Towers Market Revenue Share (%), by Type of Tower 2024 & 2032
- Figure 114: Middle East and Africa Telecom Towers Market Volume Share (%), by Type of Tower 2024 & 2032
- Figure 115: Middle East and Africa Telecom Towers Market Revenue (Million), by Installation 2024 & 2032
- Figure 116: Middle East and Africa Telecom Towers Market Volume (K Unit), by Installation 2024 & 2032
- Figure 117: Middle East and Africa Telecom Towers Market Revenue Share (%), by Installation 2024 & 2032
- Figure 118: Middle East and Africa Telecom Towers Market Volume Share (%), by Installation 2024 & 2032
- Figure 119: Middle East and Africa Telecom Towers Market Revenue (Million), by Ownership 2024 & 2032
- Figure 120: Middle East and Africa Telecom Towers Market Volume (K Unit), by Ownership 2024 & 2032
- Figure 121: Middle East and Africa Telecom Towers Market Revenue Share (%), by Ownership 2024 & 2032
- Figure 122: Middle East and Africa Telecom Towers Market Volume Share (%), by Ownership 2024 & 2032
- Figure 123: Middle East and Africa Telecom Towers Market Revenue (Million), by Country 2024 & 2032
- Figure 124: Middle East and Africa Telecom Towers Market Volume (K Unit), by Country 2024 & 2032
- Figure 125: Middle East and Africa Telecom Towers Market Revenue Share (%), by Country 2024 & 2032
- Figure 126: Middle East and Africa Telecom Towers Market Volume Share (%), by Country 2024 & 2032
List of Tables
- Table 1: Global Telecom Towers Market Revenue Million Forecast, by Region 2019 & 2032
- Table 2: Global Telecom Towers Market Volume K Unit Forecast, by Region 2019 & 2032
- Table 3: Global Telecom Towers Market Revenue Million Forecast, by Fuel Type 2019 & 2032
- Table 4: Global Telecom Towers Market Volume K Unit Forecast, by Fuel Type 2019 & 2032
- Table 5: Global Telecom Towers Market Revenue Million Forecast, by Type of Tower 2019 & 2032
- Table 6: Global Telecom Towers Market Volume K Unit Forecast, by Type of Tower 2019 & 2032
- Table 7: Global Telecom Towers Market Revenue Million Forecast, by Installation 2019 & 2032
- Table 8: Global Telecom Towers Market Volume K Unit Forecast, by Installation 2019 & 2032
- Table 9: Global Telecom Towers Market Revenue Million Forecast, by Ownership 2019 & 2032
- Table 10: Global Telecom Towers Market Volume K Unit Forecast, by Ownership 2019 & 2032
- Table 11: Global Telecom Towers Market Revenue Million Forecast, by Region 2019 & 2032
- Table 12: Global Telecom Towers Market Volume K Unit Forecast, by Region 2019 & 2032
- Table 13: Global Telecom Towers Market Revenue Million Forecast, by Country 2019 & 2032
- Table 14: Global Telecom Towers Market Volume K Unit Forecast, by Country 2019 & 2032
- Table 15: United States Telecom Towers Market Revenue (Million) Forecast, by Application 2019 & 2032
- Table 16: United States Telecom Towers Market Volume (K Unit) Forecast, by Application 2019 & 2032
- Table 17: Canada Telecom Towers Market Revenue (Million) Forecast, by Application 2019 & 2032
- Table 18: Canada Telecom Towers Market Volume (K Unit) Forecast, by Application 2019 & 2032
- Table 19: Mexico Telecom Towers Market Revenue (Million) Forecast, by Application 2019 & 2032
- Table 20: Mexico Telecom Towers Market Volume (K Unit) Forecast, by Application 2019 & 2032
- Table 21: Global Telecom Towers Market Revenue Million Forecast, by Country 2019 & 2032
- Table 22: Global Telecom Towers Market Volume K Unit Forecast, by Country 2019 & 2032
- Table 23: Germany Telecom Towers Market Revenue (Million) Forecast, by Application 2019 & 2032
- Table 24: Germany Telecom Towers Market Volume (K Unit) Forecast, by Application 2019 & 2032
- Table 25: United Kingdom Telecom Towers Market Revenue (Million) Forecast, by Application 2019 & 2032
- Table 26: United Kingdom Telecom Towers Market Volume (K Unit) Forecast, by Application 2019 & 2032
- Table 27: France Telecom Towers Market Revenue (Million) Forecast, by Application 2019 & 2032
- Table 28: France Telecom Towers Market Volume (K Unit) Forecast, by Application 2019 & 2032
- Table 29: Spain Telecom Towers Market Revenue (Million) Forecast, by Application 2019 & 2032
- Table 30: Spain Telecom Towers Market Volume (K Unit) Forecast, by Application 2019 & 2032
- Table 31: Italy Telecom Towers Market Revenue (Million) Forecast, by Application 2019 & 2032
- Table 32: Italy Telecom Towers Market Volume (K Unit) Forecast, by Application 2019 & 2032
- Table 33: Spain Telecom Towers Market Revenue (Million) Forecast, by Application 2019 & 2032
- Table 34: Spain Telecom Towers Market Volume (K Unit) Forecast, by Application 2019 & 2032
- Table 35: Belgium Telecom Towers Market Revenue (Million) Forecast, by Application 2019 & 2032
- Table 36: Belgium Telecom Towers Market Volume (K Unit) Forecast, by Application 2019 & 2032
- Table 37: Netherland Telecom Towers Market Revenue (Million) Forecast, by Application 2019 & 2032
- Table 38: Netherland Telecom Towers Market Volume (K Unit) Forecast, by Application 2019 & 2032
- Table 39: Nordics Telecom Towers Market Revenue (Million) Forecast, by Application 2019 & 2032
- Table 40: Nordics Telecom Towers Market Volume (K Unit) Forecast, by Application 2019 & 2032
- Table 41: Rest of Europe Telecom Towers Market Revenue (Million) Forecast, by Application 2019 & 2032
- Table 42: Rest of Europe Telecom Towers Market Volume (K Unit) Forecast, by Application 2019 & 2032
- Table 43: Global Telecom Towers Market Revenue Million Forecast, by Country 2019 & 2032
- Table 44: Global Telecom Towers Market Volume K Unit Forecast, by Country 2019 & 2032
- Table 45: China Telecom Towers Market Revenue (Million) Forecast, by Application 2019 & 2032
- Table 46: China Telecom Towers Market Volume (K Unit) Forecast, by Application 2019 & 2032
- Table 47: Japan Telecom Towers Market Revenue (Million) Forecast, by Application 2019 & 2032
- Table 48: Japan Telecom Towers Market Volume (K Unit) Forecast, by Application 2019 & 2032
- Table 49: India Telecom Towers Market Revenue (Million) Forecast, by Application 2019 & 2032
- Table 50: India Telecom Towers Market Volume (K Unit) Forecast, by Application 2019 & 2032
- Table 51: South Korea Telecom Towers Market Revenue (Million) Forecast, by Application 2019 & 2032
- Table 52: South Korea Telecom Towers Market Volume (K Unit) Forecast, by Application 2019 & 2032
- Table 53: Southeast Asia Telecom Towers Market Revenue (Million) Forecast, by Application 2019 & 2032
- Table 54: Southeast Asia Telecom Towers Market Volume (K Unit) Forecast, by Application 2019 & 2032
- Table 55: Australia Telecom Towers Market Revenue (Million) Forecast, by Application 2019 & 2032
- Table 56: Australia Telecom Towers Market Volume (K Unit) Forecast, by Application 2019 & 2032
- Table 57: Indonesia Telecom Towers Market Revenue (Million) Forecast, by Application 2019 & 2032
- Table 58: Indonesia Telecom Towers Market Volume (K Unit) Forecast, by Application 2019 & 2032
- Table 59: Phillipes Telecom Towers Market Revenue (Million) Forecast, by Application 2019 & 2032
- Table 60: Phillipes Telecom Towers Market Volume (K Unit) Forecast, by Application 2019 & 2032
- Table 61: Singapore Telecom Towers Market Revenue (Million) Forecast, by Application 2019 & 2032
- Table 62: Singapore Telecom Towers Market Volume (K Unit) Forecast, by Application 2019 & 2032
- Table 63: Thailandc Telecom Towers Market Revenue (Million) Forecast, by Application 2019 & 2032
- Table 64: Thailandc Telecom Towers Market Volume (K Unit) Forecast, by Application 2019 & 2032
- Table 65: Rest of Asia Pacific Telecom Towers Market Revenue (Million) Forecast, by Application 2019 & 2032
- Table 66: Rest of Asia Pacific Telecom Towers Market Volume (K Unit) Forecast, by Application 2019 & 2032
- Table 67: Global Telecom Towers Market Revenue Million Forecast, by Country 2019 & 2032
- Table 68: Global Telecom Towers Market Volume K Unit Forecast, by Country 2019 & 2032
- Table 69: Brazil Telecom Towers Market Revenue (Million) Forecast, by Application 2019 & 2032
- Table 70: Brazil Telecom Towers Market Volume (K Unit) Forecast, by Application 2019 & 2032
- Table 71: Argentina Telecom Towers Market Revenue (Million) Forecast, by Application 2019 & 2032
- Table 72: Argentina Telecom Towers Market Volume (K Unit) Forecast, by Application 2019 & 2032
- Table 73: Peru Telecom Towers Market Revenue (Million) Forecast, by Application 2019 & 2032
- Table 74: Peru Telecom Towers Market Volume (K Unit) Forecast, by Application 2019 & 2032
- Table 75: Chile Telecom Towers Market Revenue (Million) Forecast, by Application 2019 & 2032
- Table 76: Chile Telecom Towers Market Volume (K Unit) Forecast, by Application 2019 & 2032
- Table 77: Colombia Telecom Towers Market Revenue (Million) Forecast, by Application 2019 & 2032
- Table 78: Colombia Telecom Towers Market Volume (K Unit) Forecast, by Application 2019 & 2032
- Table 79: Ecuador Telecom Towers Market Revenue (Million) Forecast, by Application 2019 & 2032
- Table 80: Ecuador Telecom Towers Market Volume (K Unit) Forecast, by Application 2019 & 2032
- Table 81: Venezuela Telecom Towers Market Revenue (Million) Forecast, by Application 2019 & 2032
- Table 82: Venezuela Telecom Towers Market Volume (K Unit) Forecast, by Application 2019 & 2032
- Table 83: Rest of South America Telecom Towers Market Revenue (Million) Forecast, by Application 2019 & 2032
- Table 84: Rest of South America Telecom Towers Market Volume (K Unit) Forecast, by Application 2019 & 2032
- Table 85: Global Telecom Towers Market Revenue Million Forecast, by Country 2019 & 2032
- Table 86: Global Telecom Towers Market Volume K Unit Forecast, by Country 2019 & 2032
- Table 87: United States Telecom Towers Market Revenue (Million) Forecast, by Application 2019 & 2032
- Table 88: United States Telecom Towers Market Volume (K Unit) Forecast, by Application 2019 & 2032
- Table 89: Canada Telecom Towers Market Revenue (Million) Forecast, by Application 2019 & 2032
- Table 90: Canada Telecom Towers Market Volume (K Unit) Forecast, by Application 2019 & 2032
- Table 91: Mexico Telecom Towers Market Revenue (Million) Forecast, by Application 2019 & 2032
- Table 92: Mexico Telecom Towers Market Volume (K Unit) Forecast, by Application 2019 & 2032
- Table 93: Global Telecom Towers Market Revenue Million Forecast, by Country 2019 & 2032
- Table 94: Global Telecom Towers Market Volume K Unit Forecast, by Country 2019 & 2032
- Table 95: United Arab Emirates Telecom Towers Market Revenue (Million) Forecast, by Application 2019 & 2032
- Table 96: United Arab Emirates Telecom Towers Market Volume (K Unit) Forecast, by Application 2019 & 2032
- Table 97: Saudi Arabia Telecom Towers Market Revenue (Million) Forecast, by Application 2019 & 2032
- Table 98: Saudi Arabia Telecom Towers Market Volume (K Unit) Forecast, by Application 2019 & 2032
- Table 99: South Africa Telecom Towers Market Revenue (Million) Forecast, by Application 2019 & 2032
- Table 100: South Africa Telecom Towers Market Volume (K Unit) Forecast, by Application 2019 & 2032
- Table 101: Rest of Middle East and Africa Telecom Towers Market Revenue (Million) Forecast, by Application 2019 & 2032
- Table 102: Rest of Middle East and Africa Telecom Towers Market Volume (K Unit) Forecast, by Application 2019 & 2032
- Table 103: Global Telecom Towers Market Revenue Million Forecast, by Fuel Type 2019 & 2032
- Table 104: Global Telecom Towers Market Volume K Unit Forecast, by Fuel Type 2019 & 2032
- Table 105: Global Telecom Towers Market Revenue Million Forecast, by Type of Tower 2019 & 2032
- Table 106: Global Telecom Towers Market Volume K Unit Forecast, by Type of Tower 2019 & 2032
- Table 107: Global Telecom Towers Market Revenue Million Forecast, by Installation 2019 & 2032
- Table 108: Global Telecom Towers Market Volume K Unit Forecast, by Installation 2019 & 2032
- Table 109: Global Telecom Towers Market Revenue Million Forecast, by Ownership 2019 & 2032
- Table 110: Global Telecom Towers Market Volume K Unit Forecast, by Ownership 2019 & 2032
- Table 111: Global Telecom Towers Market Revenue Million Forecast, by Country 2019 & 2032
- Table 112: Global Telecom Towers Market Volume K Unit Forecast, by Country 2019 & 2032
- Table 113: United States Telecom Towers Market Revenue (Million) Forecast, by Application 2019 & 2032
- Table 114: United States Telecom Towers Market Volume (K Unit) Forecast, by Application 2019 & 2032
- Table 115: Canada Telecom Towers Market Revenue (Million) Forecast, by Application 2019 & 2032
- Table 116: Canada Telecom Towers Market Volume (K Unit) Forecast, by Application 2019 & 2032
- Table 117: Global Telecom Towers Market Revenue Million Forecast, by Fuel Type 2019 & 2032
- Table 118: Global Telecom Towers Market Volume K Unit Forecast, by Fuel Type 2019 & 2032
- Table 119: Global Telecom Towers Market Revenue Million Forecast, by Type of Tower 2019 & 2032
- Table 120: Global Telecom Towers Market Volume K Unit Forecast, by Type of Tower 2019 & 2032
- Table 121: Global Telecom Towers Market Revenue Million Forecast, by Installation 2019 & 2032
- Table 122: Global Telecom Towers Market Volume K Unit Forecast, by Installation 2019 & 2032
- Table 123: Global Telecom Towers Market Revenue Million Forecast, by Ownership 2019 & 2032
- Table 124: Global Telecom Towers Market Volume K Unit Forecast, by Ownership 2019 & 2032
- Table 125: Global Telecom Towers Market Revenue Million Forecast, by Country 2019 & 2032
- Table 126: Global Telecom Towers Market Volume K Unit Forecast, by Country 2019 & 2032
- Table 127: United Kingdom Telecom Towers Market Revenue (Million) Forecast, by Application 2019 & 2032
- Table 128: United Kingdom Telecom Towers Market Volume (K Unit) Forecast, by Application 2019 & 2032
- Table 129: Germany Telecom Towers Market Revenue (Million) Forecast, by Application 2019 & 2032
- Table 130: Germany Telecom Towers Market Volume (K Unit) Forecast, by Application 2019 & 2032
- Table 131: France Telecom Towers Market Revenue (Million) Forecast, by Application 2019 & 2032
- Table 132: France Telecom Towers Market Volume (K Unit) Forecast, by Application 2019 & 2032
- Table 133: Italy Telecom Towers Market Revenue (Million) Forecast, by Application 2019 & 2032
- Table 134: Italy Telecom Towers Market Volume (K Unit) Forecast, by Application 2019 & 2032
- Table 135: Spain Telecom Towers Market Revenue (Million) Forecast, by Application 2019 & 2032
- Table 136: Spain Telecom Towers Market Volume (K Unit) Forecast, by Application 2019 & 2032
- Table 137: Netherlands Telecom Towers Market Revenue (Million) Forecast, by Application 2019 & 2032
- Table 138: Netherlands Telecom Towers Market Volume (K Unit) Forecast, by Application 2019 & 2032
- Table 139: Sweden Telecom Towers Market Revenue (Million) Forecast, by Application 2019 & 2032
- Table 140: Sweden Telecom Towers Market Volume (K Unit) Forecast, by Application 2019 & 2032
- Table 141: Switzerland Telecom Towers Market Revenue (Million) Forecast, by Application 2019 & 2032
- Table 142: Switzerland Telecom Towers Market Volume (K Unit) Forecast, by Application 2019 & 2032
- Table 143: Rest of Europe Telecom Towers Market Revenue (Million) Forecast, by Application 2019 & 2032
- Table 144: Rest of Europe Telecom Towers Market Volume (K Unit) Forecast, by Application 2019 & 2032
- Table 145: Global Telecom Towers Market Revenue Million Forecast, by Fuel Type 2019 & 2032
- Table 146: Global Telecom Towers Market Volume K Unit Forecast, by Fuel Type 2019 & 2032
- Table 147: Global Telecom Towers Market Revenue Million Forecast, by Type of Tower 2019 & 2032
- Table 148: Global Telecom Towers Market Volume K Unit Forecast, by Type of Tower 2019 & 2032
- Table 149: Global Telecom Towers Market Revenue Million Forecast, by Installation 2019 & 2032
- Table 150: Global Telecom Towers Market Volume K Unit Forecast, by Installation 2019 & 2032
- Table 151: Global Telecom Towers Market Revenue Million Forecast, by Ownership 2019 & 2032
- Table 152: Global Telecom Towers Market Volume K Unit Forecast, by Ownership 2019 & 2032
- Table 153: Global Telecom Towers Market Revenue Million Forecast, by Country 2019 & 2032
- Table 154: Global Telecom Towers Market Volume K Unit Forecast, by Country 2019 & 2032
- Table 155: China Telecom Towers Market Revenue (Million) Forecast, by Application 2019 & 2032
- Table 156: China Telecom Towers Market Volume (K Unit) Forecast, by Application 2019 & 2032
- Table 157: India Telecom Towers Market Revenue (Million) Forecast, by Application 2019 & 2032
- Table 158: India Telecom Towers Market Volume (K Unit) Forecast, by Application 2019 & 2032
- Table 159: Japan Telecom Towers Market Revenue (Million) Forecast, by Application 2019 & 2032
- Table 160: Japan Telecom Towers Market Volume (K Unit) Forecast, by Application 2019 & 2032
- Table 161: South Korea Telecom Towers Market Revenue (Million) Forecast, by Application 2019 & 2032
- Table 162: South Korea Telecom Towers Market Volume (K Unit) Forecast, by Application 2019 & 2032
- Table 163: Indonesia Telecom Towers Market Revenue (Million) Forecast, by Application 2019 & 2032
- Table 164: Indonesia Telecom Towers Market Volume (K Unit) Forecast, by Application 2019 & 2032
- Table 165: Vietnam Telecom Towers Market Revenue (Million) Forecast, by Application 2019 & 2032
- Table 166: Vietnam Telecom Towers Market Volume (K Unit) Forecast, by Application 2019 & 2032
- Table 167: Malaysia Telecom Towers Market Revenue (Million) Forecast, by Application 2019 & 2032
- Table 168: Malaysia Telecom Towers Market Volume (K Unit) Forecast, by Application 2019 & 2032
- Table 169: Philippines Telecom Towers Market Revenue (Million) Forecast, by Application 2019 & 2032
- Table 170: Philippines Telecom Towers Market Volume (K Unit) Forecast, by Application 2019 & 2032
- Table 171: Australia and New Zealand Telecom Towers Market Revenue (Million) Forecast, by Application 2019 & 2032
- Table 172: Australia and New Zealand Telecom Towers Market Volume (K Unit) Forecast, by Application 2019 & 2032
- Table 173: Rest of Asia Pacific Telecom Towers Market Revenue (Million) Forecast, by Application 2019 & 2032
- Table 174: Rest of Asia Pacific Telecom Towers Market Volume (K Unit) Forecast, by Application 2019 & 2032
- Table 175: Global Telecom Towers Market Revenue Million Forecast, by Fuel Type 2019 & 2032
- Table 176: Global Telecom Towers Market Volume K Unit Forecast, by Fuel Type 2019 & 2032
- Table 177: Global Telecom Towers Market Revenue Million Forecast, by Type of Tower 2019 & 2032
- Table 178: Global Telecom Towers Market Volume K Unit Forecast, by Type of Tower 2019 & 2032
- Table 179: Global Telecom Towers Market Revenue Million Forecast, by Installation 2019 & 2032
- Table 180: Global Telecom Towers Market Volume K Unit Forecast, by Installation 2019 & 2032
- Table 181: Global Telecom Towers Market Revenue Million Forecast, by Ownership 2019 & 2032
- Table 182: Global Telecom Towers Market Volume K Unit Forecast, by Ownership 2019 & 2032
- Table 183: Global Telecom Towers Market Revenue Million Forecast, by Country 2019 & 2032
- Table 184: Global Telecom Towers Market Volume K Unit Forecast, by Country 2019 & 2032
- Table 185: Brazil Telecom Towers Market Revenue (Million) Forecast, by Application 2019 & 2032
- Table 186: Brazil Telecom Towers Market Volume (K Unit) Forecast, by Application 2019 & 2032
- Table 187: Mexico Telecom Towers Market Revenue (Million) Forecast, by Application 2019 & 2032
- Table 188: Mexico Telecom Towers Market Volume (K Unit) Forecast, by Application 2019 & 2032
- Table 189: Argentina Telecom Towers Market Revenue (Million) Forecast, by Application 2019 & 2032
- Table 190: Argentina Telecom Towers Market Volume (K Unit) Forecast, by Application 2019 & 2032
- Table 191: Rest of Latin America Telecom Towers Market Revenue (Million) Forecast, by Application 2019 & 2032
- Table 192: Rest of Latin America Telecom Towers Market Volume (K Unit) Forecast, by Application 2019 & 2032
- Table 193: Global Telecom Towers Market Revenue Million Forecast, by Fuel Type 2019 & 2032
- Table 194: Global Telecom Towers Market Volume K Unit Forecast, by Fuel Type 2019 & 2032
- Table 195: Global Telecom Towers Market Revenue Million Forecast, by Type of Tower 2019 & 2032
- Table 196: Global Telecom Towers Market Volume K Unit Forecast, by Type of Tower 2019 & 2032
- Table 197: Global Telecom Towers Market Revenue Million Forecast, by Installation 2019 & 2032
- Table 198: Global Telecom Towers Market Volume K Unit Forecast, by Installation 2019 & 2032
- Table 199: Global Telecom Towers Market Revenue Million Forecast, by Ownership 2019 & 2032
- Table 200: Global Telecom Towers Market Volume K Unit Forecast, by Ownership 2019 & 2032
- Table 201: Global Telecom Towers Market Revenue Million Forecast, by Country 2019 & 2032
- Table 202: Global Telecom Towers Market Volume K Unit Forecast, by Country 2019 & 2032
- Table 203: Saudi Arabia Telecom Towers Market Revenue (Million) Forecast, by Application 2019 & 2032
- Table 204: Saudi Arabia Telecom Towers Market Volume (K Unit) Forecast, by Application 2019 & 2032
- Table 205: Egypt Telecom Towers Market Revenue (Million) Forecast, by Application 2019 & 2032
- Table 206: Egypt Telecom Towers Market Volume (K Unit) Forecast, by Application 2019 & 2032
- Table 207: Algeria Telecom Towers Market Revenue (Million) Forecast, by Application 2019 & 2032
- Table 208: Algeria Telecom Towers Market Volume (K Unit) Forecast, by Application 2019 & 2032
- Table 209: Nigeria Telecom Towers Market Revenue (Million) Forecast, by Application 2019 & 2032
- Table 210: Nigeria Telecom Towers Market Volume (K Unit) Forecast, by Application 2019 & 2032
- Table 211: South Africa Telecom Towers Market Revenue (Million) Forecast, by Application 2019 & 2032
- Table 212: South Africa Telecom Towers Market Volume (K Unit) Forecast, by Application 2019 & 2032
- Table 213: Tanzania Telecom Towers Market Revenue (Million) Forecast, by Application 2019 & 2032
- Table 214: Tanzania Telecom Towers Market Volume (K Unit) Forecast, by Application 2019 & 2032
- Table 215: Morocco Telecom Towers Market Revenue (Million) Forecast, by Application 2019 & 2032
- Table 216: Morocco Telecom Towers Market Volume (K Unit) Forecast, by Application 2019 & 2032
- Table 217: Rest of Middle East and Africa Telecom Towers Market Revenue (Million) Forecast, by Application 2019 & 2032
- Table 218: Rest of Middle East and Africa Telecom Towers Market Volume (K Unit) Forecast, by Application 2019 & 2032
Frequently Asked Questions
1. What is the projected Compound Annual Growth Rate (CAGR) of the Telecom Towers Market?
The projected CAGR is approximately 2.84%.
2. Which companies are prominent players in the Telecom Towers Market?
Key companies in the market include SBA Communications Corporation, Tawal Com SA, Grup TorreSur, Deutsche Funkturm, Telxius Telecom SA, CellnexTelecom, Telesites SAB de CV, IHS Towers (IHS Holding Limited), Zong Pakistan, Telkom Indonesia, Helios Towers Africa, American Tower Corporation, China Tower Corporation, Orange, Indus Towers Limited (Bharti Infratel), First Tower Company, Telenor ASA, GTL Infrastructure Limited, Crown Castle International Corporation, AT&T Inc, T-Mobile USA Inc.
3. What are the main segments of the Telecom Towers Market?
The market segments include Fuel Type, Type of Tower, Installation, Ownership.
4. Can you provide details about the market size?
The market size is estimated to be USD 28.48 Million as of 2022.
5. What are some drivers contributing to market growth?
Connecting/Improving Connectivity to Rural Areas; Improving and Catering to Increasing Data Needs.
6. What are the notable trends driving market growth?
Operator-owned Tower is Expected to Register a Significant Growth.
7. Are there any restraints impacting market growth?
; High Initial Investment and Cost of Maintenance.
8. Can you provide examples of recent developments in the market?
April 2023: The Government of India has launched 254 '4G mobile towers' in LAC villages in Arunachal Pradesh. Further, these 254 towers will provide 4G coverage in 336 villages, including several areas that have remained unconnected since Independence. Most of these towers are located in the villages bordering China to counter foreign telecom penetration. Furthermore, with the launch of this service, over 70 thousand people are expected to be benefitted.
9. What pricing options are available for accessing the report?
Pricing options include single-user, multi-user, and enterprise licenses priced at USD 4750, USD 5250, and USD 8750 respectively.
10. Is the market size provided in terms of value or volume?
The market size is provided in terms of value, measured in Million and volume, measured in K Unit.
11. Are there any specific market keywords associated with the report?
Yes, the market keyword associated with the report is "Telecom Towers Market," which aids in identifying and referencing the specific market segment covered.
12. How do I determine which pricing option suits my needs best?
The pricing options vary based on user requirements and access needs. Individual users may opt for single-user licenses, while businesses requiring broader access may choose multi-user or enterprise licenses for cost-effective access to the report.
13. Are there any additional resources or data provided in the Telecom Towers Market report?
While the report offers comprehensive insights, it's advisable to review the specific contents or supplementary materials provided to ascertain if additional resources or data are available.
14. How can I stay updated on further developments or reports in the Telecom Towers Market?
To stay informed about further developments, trends, and reports in the Telecom Towers Market, consider subscribing to industry newsletters, following relevant companies and organizations, or regularly checking reputable industry news sources and publications.
Methodology
Step 1 - Identification of Relevant Samples Size from Population Database


Step 2 - Approaches for Defining Global Market Size (Value, Volume* & Price*)

Note*: In applicable scenarios
Step 3 - Data Sources
Primary Research
- Web Analytics
- Survey Reports
- Research Institute
- Latest Research Reports
- Opinion Leaders
Secondary Research
- Annual Reports
- White Paper
- Latest Press Release
- Industry Association
- Paid Database
- Investor Presentations

Step 4 - Data Triangulation
Involves using different sources of information in order to increase the validity of a study
These sources are likely to be stakeholders in a program - participants, other researchers, program staff, other community members, and so on.
Then we put all data in single framework & apply various statistical tools to find out the dynamic on the market.
During the analysis stage, feedback from the stakeholder groups would be compared to determine areas of agreement as well as areas of divergence


