
Key Insights
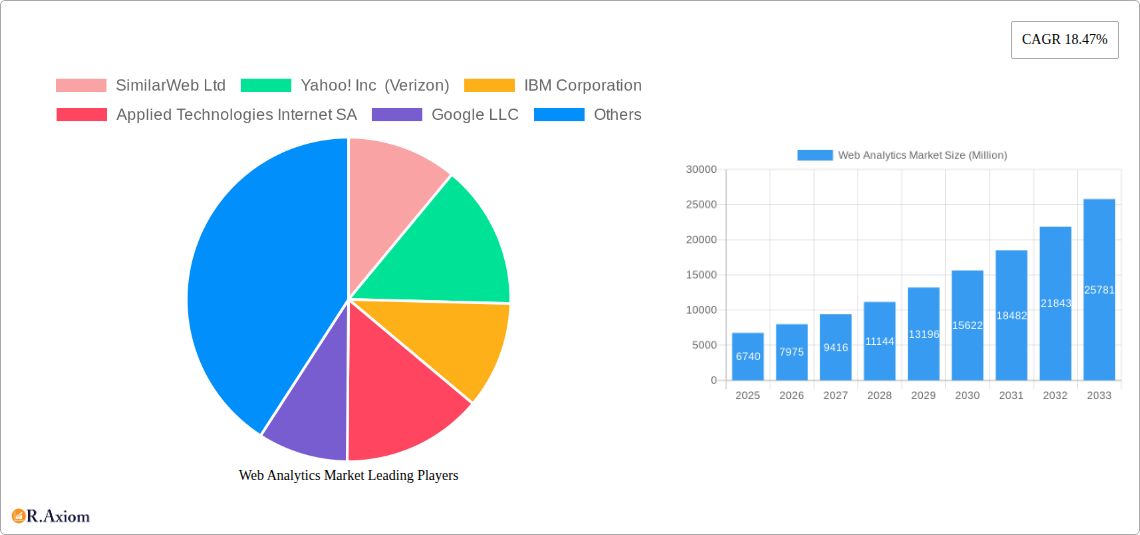
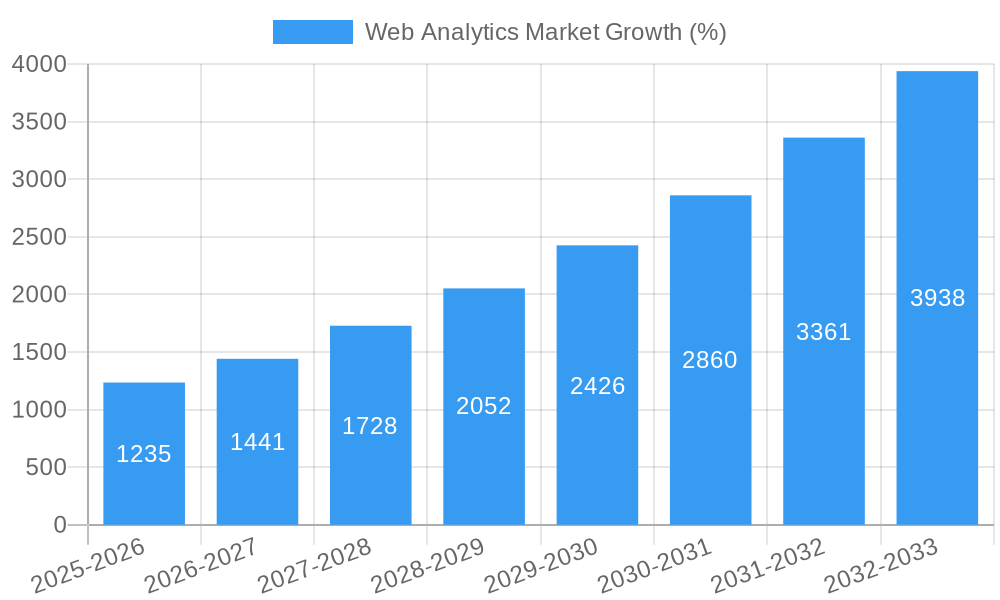
The global web analytics market, valued at $6.74 billion in 2025, is projected to experience robust growth, driven by the increasing adoption of digital marketing strategies across diverse industries. A compound annual growth rate (CAGR) of 18.47% from 2025 to 2033 indicates a significant expansion, fueled by several key factors. The rising need for data-driven decision-making in businesses of all sizes is a primary driver, as web analytics provides crucial insights into customer behavior, website performance, and marketing campaign effectiveness. Growth in e-commerce and the proliferation of mobile devices contribute significantly to the market's expansion, generating massive volumes of data requiring sophisticated analysis. Furthermore, the continuous evolution of web analytics tools and technologies, incorporating artificial intelligence (AI) and machine learning (ML) for advanced data processing and predictive modeling, further accelerates market growth. The adoption of cloud-based solutions enhances accessibility and scalability, making web analytics more affordable and user-friendly for smaller businesses. Segmentation by offering (solutions and services), end-user vertical (retail, manufacturing, IT, BFSI, healthcare, etc.), and application (online marketing, mobile analytics, content marketing, etc.) reveals diverse growth opportunities across various sectors. However, challenges such as data privacy concerns and the complexity of integrating various analytics tools might pose some restraints to market expansion.
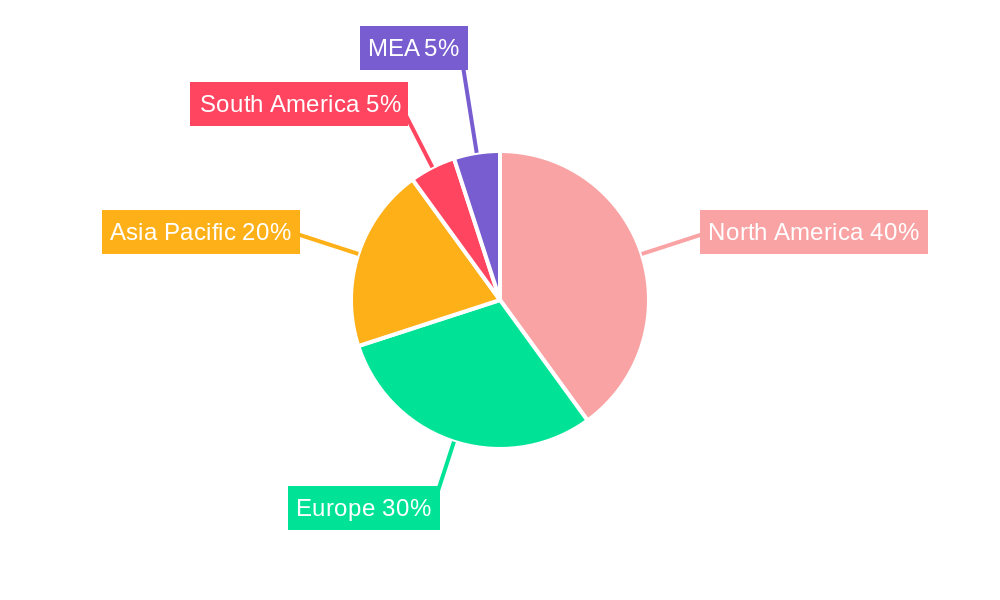
Despite these challenges, the market's strong growth trajectory is expected to continue, driven by the ever-increasing reliance on data for business intelligence. The competitive landscape is characterized by a mix of established players like Google, Adobe, and IBM, alongside emerging innovative technology companies. These companies are constantly striving to improve their offerings through advanced features, seamless integrations, and improved user experience. This competitive environment is likely to drive further innovation and potentially lead to more affordable and accessible solutions for businesses of all sizes, further fueling market expansion in the coming years. The dominance of North America is expected to continue, but the Asia-Pacific region is projected to show strong growth, driven by rising internet penetration and digital adoption in developing economies.
Web Analytics Market: A Comprehensive Report (2019-2033)
This detailed report provides a comprehensive analysis of the Web Analytics Market, covering market size, segmentation, growth drivers, challenges, and key players. The study period spans from 2019 to 2033, with 2025 serving as the base and estimated year. The forecast period is 2025-2033, and the historical period is 2019-2024. The report offers actionable insights for industry stakeholders, investors, and businesses seeking to understand and capitalize on the evolving landscape of web analytics.
Web Analytics Market Concentration & Innovation
The Web Analytics market exhibits a moderately concentrated structure, with a few dominant players holding significant market share. While Google LLC, Adobe Systems Incorporated, and Microsoft Inc. command a substantial portion (estimated at xx Million), a number of other companies, including SimilarWeb Ltd, IBM Corporation, and SAS Institute, contribute significantly to the overall market value. Market share fluctuations are driven by technological innovations, strategic acquisitions, and evolving customer preferences. The market’s innovation landscape is characterized by continuous advancements in AI-powered analytics, real-time data processing, and enhanced visualization tools.
- Market Concentration: Google, Adobe, and Microsoft collectively hold an estimated xx% market share.
- Innovation Drivers: AI-powered analytics, real-time data processing, enhanced data visualization.
- Regulatory Frameworks: GDPR, CCPA, and other data privacy regulations significantly impact market dynamics.
- Product Substitutes: Basic website traffic counters and rudimentary spreadsheet analysis present limited substitutes.
- End-User Trends: Increasing demand for precise, actionable insights drives market growth.
- M&A Activities: The past five years have witnessed xx Million in M&A activity, with deals primarily focused on expanding capabilities and market reach. Examples include [Insert Specific Examples if available, otherwise state "Specific examples are omitted due to data limitations"].
Web Analytics Market Industry Trends & Insights
The global Web Analytics Market is experiencing robust growth, driven by the increasing adoption of digital technologies across diverse industries. The market's Compound Annual Growth Rate (CAGR) from 2025 to 2033 is projected to be xx%, propelled by factors such as the exponential rise in digital marketing, the need for enhanced customer understanding, and the proliferation of mobile devices. Market penetration is expected to reach approximately xx% by 2033, indicating substantial untapped potential. Technological advancements, particularly in AI and machine learning, are fundamentally reshaping the market, enabling more sophisticated analytics and predictive capabilities. Consumer preferences are shifting towards personalized experiences, driving demand for granular, real-time data analysis. Competitive dynamics remain intense, with leading players investing heavily in R&D to maintain a competitive edge.
Dominant Markets & Segments in Web Analytics Market
The North American region currently dominates the Web Analytics Market, driven by factors such as advanced technological infrastructure, high internet penetration, and a thriving digital economy. However, the Asia-Pacific region is poised for significant growth due to rapid digitalization and increasing internet usage.
- By Offering: The Solutions segment holds the largest market share due to its high demand for comprehensive analytics platforms. Services, however, show a higher growth rate due to rising demand for specialized expertise. The combined market value for solutions and services is estimated to be at xx Million in 2025.
- By End-User Vertical: Retail and E-commerce sectors lead with xx Million and xx Million in market value respectively, followed by Banking, Financial Services, and Insurance (BFSI), indicating a high reliance on data-driven decision-making.
- By Application: Online Marketing & Marketing Automation holds the largest market share due to its wide application in enhancing digital marketing strategies.
Key Drivers (Vary by Segment):
- Retail: High online penetration, need for personalized marketing.
- BFSI: Regulatory compliance, fraud detection, customer segmentation.
- Healthcare: Patient engagement, operational efficiency.
- IT: Performance monitoring, customer satisfaction analysis.
Web Analytics Market Product Developments
Recent product developments focus on integrating AI and machine learning to provide advanced predictive analytics, automated reporting, and enhanced data visualization. This enhances the speed and efficiency of data analysis, enabling businesses to extract actionable insights faster. Several vendors offer customized solutions tailored to specific industry needs, emphasizing market fit.
Report Scope & Segmentation Analysis
This report segments the Web Analytics market across three key parameters: Offering (Solution, Services), End-User Vertical (Retail, Manufacturing, IT, BFSI, Healthcare, Transportation & Logistics, Others), and Application (Online Marketing & Marketing Automation, Mobile Analytics, Content Marketing, Social Media Management, Email Marketing, Other Applications). Each segment is analyzed in detail to provide a comprehensive understanding of market size, growth projections, and competitive dynamics. Growth projections vary across segments; for instance, the Mobile Analytics segment is expected to exhibit strong growth due to the increasing use of mobile devices.
Key Drivers of Web Analytics Market Growth
The growth of the Web Analytics market is primarily driven by several factors: the increasing adoption of digital marketing strategies across various industries, the growing need for real-time data analysis for improved decision-making, and the continuous technological advancements leading to more sophisticated analytics tools. Furthermore, stringent data privacy regulations are pushing businesses to adopt advanced analytics for better compliance and risk management.
Challenges in the Web Analytics Market Sector
Significant challenges facing the Web Analytics market include the increasing complexity of data management, the need for skilled professionals to interpret complex data sets, and maintaining data security and privacy in compliance with evolving regulations. These challenges translate to higher operational costs and potential legal liabilities if not addressed properly. The competitive landscape also presents challenges, particularly for smaller players competing against established giants.
Emerging Opportunities in Web Analytics Market
Emerging opportunities lie in the expansion into untapped markets, such as the growing adoption of IoT and the increasing demand for predictive analytics in various industries. Furthermore, the integration of web analytics with other business intelligence tools presents significant potential for growth. The development of advanced AI-powered analytics tools that provide deeper insights into customer behavior and market trends also offers substantial opportunities.
Leading Players in the Web Analytics Market Market
- SimilarWeb Ltd
- Yahoo! Inc (Verizon)
- IBM Corporation
- Applied Technologies Internet SA
- Google LLC
- Teradata Corporation
- MicroStrategy Incorporated
- Adobe Systems Incorporated
- SAS Institute
- Webtrends Inc
- comScore Inc
- Microsoft Inc
- Facebook Inc
- Hootsuite Inc
- Splunk Inc
- Tableau Software (Salesforce com Inc )
Key Developments in Web Analytics Market Industry
- March 2023: Datajoin launched Digital Analytics Integrations for Adobe Analytics and Google Analytics, extending digital analytics beyond website metrics to improve customer acquisition.
- February 2023: das42 achieved Google Cloud Partner Advantage Data Analytics Services Partner specialization, demonstrating expertise in developing data analytics solutions using Google Cloud technology.
Strategic Outlook for Web Analytics Market Market
The Web Analytics market is poised for continued growth, driven by the increasing digitization of businesses and the expanding need for data-driven decision-making. Opportunities for growth are particularly strong in emerging markets and within sectors that are rapidly adopting digital technologies. Innovation in AI, machine learning, and data visualization will continue to shape the market landscape, leading to more sophisticated and user-friendly analytics tools. Companies that adapt to changing technologies and regulatory requirements will be best positioned to succeed in this dynamic market.
Web Analytics Market Segmentation
-
1. Application
- 1.1. Online Marketing & Marketing Automation
- 1.2. Mobile Analytics
- 1.3. Content Marketing
- 1.4. Social Media Management
- 1.5. E-mail Marketing
- 1.6. Other Ap
-
2. Offering
- 2.1. Solution
- 2.2. Services
-
3. End-User Vertical
- 3.1. Retail
- 3.2. Manufacturing
- 3.3. Information Technology
- 3.4. Banking, Financial Services, and Insurance
- 3.5. Healthcare
- 3.6. Transportation and Logistics
- 3.7. Other End-User Verticals
Web Analytics Market Segmentation By Geography
- 1. North America
- 2. Europe
- 3. Asia
- 4. Australia and New Zealand
- 5. Latin America
- 6. Middle East and Africa
Web Analytics Market REPORT HIGHLIGHTS
| Aspects | Details |
|---|---|
| Study Period | 2019-2033 |
| Base Year | 2024 |
| Estimated Year | 2025 |
| Forecast Period | 2025-2033 |
| Historical Period | 2019-2024 |
| Growth Rate | CAGR of 18.47% from 2019-2033 |
| Segmentation |
|
Table of Contents
- 1. Introduction
- 1.1. Research Scope
- 1.2. Market Segmentation
- 1.3. Research Methodology
- 1.4. Definitions and Assumptions
- 2. Executive Summary
- 2.1. Introduction
- 3. Market Dynamics
- 3.1. Introduction
- 3.2. Market Drivers
- 3.2.1. Growing Demand for Online Shopping Trends; Growing Importance of Mobile Analytics Solutions
- 3.3. Market Restrains
- 3.3.1. Rigid Government Regulations and Data Privacy Regulations Compliance
- 3.4. Market Trends
- 3.4.1. Growing Demand for Online Shopping Trends is Expected to Drives the Market Growth
- 4. Market Factor Analysis
- 4.1. Porters Five Forces
- 4.2. Supply/Value Chain
- 4.3. PESTEL analysis
- 4.4. Market Entropy
- 4.5. Patent/Trademark Analysis
- 5. Global Web Analytics Market Analysis, Insights and Forecast, 2019-2031
- 5.1. Market Analysis, Insights and Forecast - by Application
- 5.1.1. Online Marketing & Marketing Automation
- 5.1.2. Mobile Analytics
- 5.1.3. Content Marketing
- 5.1.4. Social Media Management
- 5.1.5. E-mail Marketing
- 5.1.6. Other Ap
- 5.2. Market Analysis, Insights and Forecast - by Offering
- 5.2.1. Solution
- 5.2.2. Services
- 5.3. Market Analysis, Insights and Forecast - by End-User Vertical
- 5.3.1. Retail
- 5.3.2. Manufacturing
- 5.3.3. Information Technology
- 5.3.4. Banking, Financial Services, and Insurance
- 5.3.5. Healthcare
- 5.3.6. Transportation and Logistics
- 5.3.7. Other End-User Verticals
- 5.4. Market Analysis, Insights and Forecast - by Region
- 5.4.1. North America
- 5.4.2. Europe
- 5.4.3. Asia
- 5.4.4. Australia and New Zealand
- 5.4.5. Latin America
- 5.4.6. Middle East and Africa
- 5.1. Market Analysis, Insights and Forecast - by Application
- 6. North America Web Analytics Market Analysis, Insights and Forecast, 2019-2031
- 6.1. Market Analysis, Insights and Forecast - by Application
- 6.1.1. Online Marketing & Marketing Automation
- 6.1.2. Mobile Analytics
- 6.1.3. Content Marketing
- 6.1.4. Social Media Management
- 6.1.5. E-mail Marketing
- 6.1.6. Other Ap
- 6.2. Market Analysis, Insights and Forecast - by Offering
- 6.2.1. Solution
- 6.2.2. Services
- 6.3. Market Analysis, Insights and Forecast - by End-User Vertical
- 6.3.1. Retail
- 6.3.2. Manufacturing
- 6.3.3. Information Technology
- 6.3.4. Banking, Financial Services, and Insurance
- 6.3.5. Healthcare
- 6.3.6. Transportation and Logistics
- 6.3.7. Other End-User Verticals
- 6.1. Market Analysis, Insights and Forecast - by Application
- 7. Europe Web Analytics Market Analysis, Insights and Forecast, 2019-2031
- 7.1. Market Analysis, Insights and Forecast - by Application
- 7.1.1. Online Marketing & Marketing Automation
- 7.1.2. Mobile Analytics
- 7.1.3. Content Marketing
- 7.1.4. Social Media Management
- 7.1.5. E-mail Marketing
- 7.1.6. Other Ap
- 7.2. Market Analysis, Insights and Forecast - by Offering
- 7.2.1. Solution
- 7.2.2. Services
- 7.3. Market Analysis, Insights and Forecast - by End-User Vertical
- 7.3.1. Retail
- 7.3.2. Manufacturing
- 7.3.3. Information Technology
- 7.3.4. Banking, Financial Services, and Insurance
- 7.3.5. Healthcare
- 7.3.6. Transportation and Logistics
- 7.3.7. Other End-User Verticals
- 7.1. Market Analysis, Insights and Forecast - by Application
- 8. Asia Web Analytics Market Analysis, Insights and Forecast, 2019-2031
- 8.1. Market Analysis, Insights and Forecast - by Application
- 8.1.1. Online Marketing & Marketing Automation
- 8.1.2. Mobile Analytics
- 8.1.3. Content Marketing
- 8.1.4. Social Media Management
- 8.1.5. E-mail Marketing
- 8.1.6. Other Ap
- 8.2. Market Analysis, Insights and Forecast - by Offering
- 8.2.1. Solution
- 8.2.2. Services
- 8.3. Market Analysis, Insights and Forecast - by End-User Vertical
- 8.3.1. Retail
- 8.3.2. Manufacturing
- 8.3.3. Information Technology
- 8.3.4. Banking, Financial Services, and Insurance
- 8.3.5. Healthcare
- 8.3.6. Transportation and Logistics
- 8.3.7. Other End-User Verticals
- 8.1. Market Analysis, Insights and Forecast - by Application
- 9. Australia and New Zealand Web Analytics Market Analysis, Insights and Forecast, 2019-2031
- 9.1. Market Analysis, Insights and Forecast - by Application
- 9.1.1. Online Marketing & Marketing Automation
- 9.1.2. Mobile Analytics
- 9.1.3. Content Marketing
- 9.1.4. Social Media Management
- 9.1.5. E-mail Marketing
- 9.1.6. Other Ap
- 9.2. Market Analysis, Insights and Forecast - by Offering
- 9.2.1. Solution
- 9.2.2. Services
- 9.3. Market Analysis, Insights and Forecast - by End-User Vertical
- 9.3.1. Retail
- 9.3.2. Manufacturing
- 9.3.3. Information Technology
- 9.3.4. Banking, Financial Services, and Insurance
- 9.3.5. Healthcare
- 9.3.6. Transportation and Logistics
- 9.3.7. Other End-User Verticals
- 9.1. Market Analysis, Insights and Forecast - by Application
- 10. Latin America Web Analytics Market Analysis, Insights and Forecast, 2019-2031
- 10.1. Market Analysis, Insights and Forecast - by Application
- 10.1.1. Online Marketing & Marketing Automation
- 10.1.2. Mobile Analytics
- 10.1.3. Content Marketing
- 10.1.4. Social Media Management
- 10.1.5. E-mail Marketing
- 10.1.6. Other Ap
- 10.2. Market Analysis, Insights and Forecast - by Offering
- 10.2.1. Solution
- 10.2.2. Services
- 10.3. Market Analysis, Insights and Forecast - by End-User Vertical
- 10.3.1. Retail
- 10.3.2. Manufacturing
- 10.3.3. Information Technology
- 10.3.4. Banking, Financial Services, and Insurance
- 10.3.5. Healthcare
- 10.3.6. Transportation and Logistics
- 10.3.7. Other End-User Verticals
- 10.1. Market Analysis, Insights and Forecast - by Application
- 11. Middle East and Africa Web Analytics Market Analysis, Insights and Forecast, 2019-2031
- 11.1. Market Analysis, Insights and Forecast - by Application
- 11.1.1. Online Marketing & Marketing Automation
- 11.1.2. Mobile Analytics
- 11.1.3. Content Marketing
- 11.1.4. Social Media Management
- 11.1.5. E-mail Marketing
- 11.1.6. Other Ap
- 11.2. Market Analysis, Insights and Forecast - by Offering
- 11.2.1. Solution
- 11.2.2. Services
- 11.3. Market Analysis, Insights and Forecast - by End-User Vertical
- 11.3.1. Retail
- 11.3.2. Manufacturing
- 11.3.3. Information Technology
- 11.3.4. Banking, Financial Services, and Insurance
- 11.3.5. Healthcare
- 11.3.6. Transportation and Logistics
- 11.3.7. Other End-User Verticals
- 11.1. Market Analysis, Insights and Forecast - by Application
- 12. North America Web Analytics Market Analysis, Insights and Forecast, 2019-2031
- 12.1. Market Analysis, Insights and Forecast - By Country/Sub-region
- 12.1.1 United States
- 12.1.2 Canada
- 12.1.3 Mexico
- 13. Europe Web Analytics Market Analysis, Insights and Forecast, 2019-2031
- 13.1. Market Analysis, Insights and Forecast - By Country/Sub-region
- 13.1.1 Germany
- 13.1.2 United Kingdom
- 13.1.3 France
- 13.1.4 Spain
- 13.1.5 Italy
- 13.1.6 Spain
- 13.1.7 Belgium
- 13.1.8 Netherland
- 13.1.9 Nordics
- 13.1.10 Rest of Europe
- 14. Asia Pacific Web Analytics Market Analysis, Insights and Forecast, 2019-2031
- 14.1. Market Analysis, Insights and Forecast - By Country/Sub-region
- 14.1.1 China
- 14.1.2 Japan
- 14.1.3 India
- 14.1.4 South Korea
- 14.1.5 Southeast Asia
- 14.1.6 Australia
- 14.1.7 Indonesia
- 14.1.8 Phillipes
- 14.1.9 Singapore
- 14.1.10 Thailandc
- 14.1.11 Rest of Asia Pacific
- 15. South America Web Analytics Market Analysis, Insights and Forecast, 2019-2031
- 15.1. Market Analysis, Insights and Forecast - By Country/Sub-region
- 15.1.1 Brazil
- 15.1.2 Argentina
- 15.1.3 Peru
- 15.1.4 Chile
- 15.1.5 Colombia
- 15.1.6 Ecuador
- 15.1.7 Venezuela
- 15.1.8 Rest of South America
- 16. North America Web Analytics Market Analysis, Insights and Forecast, 2019-2031
- 16.1. Market Analysis, Insights and Forecast - By Country/Sub-region
- 16.1.1 United States
- 16.1.2 Canada
- 16.1.3 Mexico
- 17. MEA Web Analytics Market Analysis, Insights and Forecast, 2019-2031
- 17.1. Market Analysis, Insights and Forecast - By Country/Sub-region
- 17.1.1 United Arab Emirates
- 17.1.2 Saudi Arabia
- 17.1.3 South Africa
- 17.1.4 Rest of Middle East and Africa
- 18. Competitive Analysis
- 18.1. Global Market Share Analysis 2024
- 18.2. Company Profiles
- 18.2.1 SimilarWeb Ltd
- 18.2.1.1. Overview
- 18.2.1.2. Products
- 18.2.1.3. SWOT Analysis
- 18.2.1.4. Recent Developments
- 18.2.1.5. Financials (Based on Availability)
- 18.2.2 Yahoo! Inc (Verizon)
- 18.2.2.1. Overview
- 18.2.2.2. Products
- 18.2.2.3. SWOT Analysis
- 18.2.2.4. Recent Developments
- 18.2.2.5. Financials (Based on Availability)
- 18.2.3 IBM Corporation
- 18.2.3.1. Overview
- 18.2.3.2. Products
- 18.2.3.3. SWOT Analysis
- 18.2.3.4. Recent Developments
- 18.2.3.5. Financials (Based on Availability)
- 18.2.4 Applied Technologies Internet SA
- 18.2.4.1. Overview
- 18.2.4.2. Products
- 18.2.4.3. SWOT Analysis
- 18.2.4.4. Recent Developments
- 18.2.4.5. Financials (Based on Availability)
- 18.2.5 Google LLC
- 18.2.5.1. Overview
- 18.2.5.2. Products
- 18.2.5.3. SWOT Analysis
- 18.2.5.4. Recent Developments
- 18.2.5.5. Financials (Based on Availability)
- 18.2.6 Teradata Corporation
- 18.2.6.1. Overview
- 18.2.6.2. Products
- 18.2.6.3. SWOT Analysis
- 18.2.6.4. Recent Developments
- 18.2.6.5. Financials (Based on Availability)
- 18.2.7 MicroStrategy Incorporated
- 18.2.7.1. Overview
- 18.2.7.2. Products
- 18.2.7.3. SWOT Analysis
- 18.2.7.4. Recent Developments
- 18.2.7.5. Financials (Based on Availability)
- 18.2.8 Adobe Systems Incorporated
- 18.2.8.1. Overview
- 18.2.8.2. Products
- 18.2.8.3. SWOT Analysis
- 18.2.8.4. Recent Developments
- 18.2.8.5. Financials (Based on Availability)
- 18.2.9 SAS Institute
- 18.2.9.1. Overview
- 18.2.9.2. Products
- 18.2.9.3. SWOT Analysis
- 18.2.9.4. Recent Developments
- 18.2.9.5. Financials (Based on Availability)
- 18.2.10 Webtrends Inc
- 18.2.10.1. Overview
- 18.2.10.2. Products
- 18.2.10.3. SWOT Analysis
- 18.2.10.4. Recent Developments
- 18.2.10.5. Financials (Based on Availability)
- 18.2.11 comScore Inc
- 18.2.11.1. Overview
- 18.2.11.2. Products
- 18.2.11.3. SWOT Analysis
- 18.2.11.4. Recent Developments
- 18.2.11.5. Financials (Based on Availability)
- 18.2.12 Microsoft Inc
- 18.2.12.1. Overview
- 18.2.12.2. Products
- 18.2.12.3. SWOT Analysis
- 18.2.12.4. Recent Developments
- 18.2.12.5. Financials (Based on Availability)
- 18.2.13 Facebook Inc
- 18.2.13.1. Overview
- 18.2.13.2. Products
- 18.2.13.3. SWOT Analysis
- 18.2.13.4. Recent Developments
- 18.2.13.5. Financials (Based on Availability)
- 18.2.14 Hootsuite Inc
- 18.2.14.1. Overview
- 18.2.14.2. Products
- 18.2.14.3. SWOT Analysis
- 18.2.14.4. Recent Developments
- 18.2.14.5. Financials (Based on Availability)
- 18.2.15 Splunk Inc
- 18.2.15.1. Overview
- 18.2.15.2. Products
- 18.2.15.3. SWOT Analysis
- 18.2.15.4. Recent Developments
- 18.2.15.5. Financials (Based on Availability)
- 18.2.16 Tableau Software (Salesforce com Inc )
- 18.2.16.1. Overview
- 18.2.16.2. Products
- 18.2.16.3. SWOT Analysis
- 18.2.16.4. Recent Developments
- 18.2.16.5. Financials (Based on Availability)
- 18.2.1 SimilarWeb Ltd
List of Figures
- Figure 1: Global Web Analytics Market Revenue Breakdown (Million, %) by Region 2024 & 2032
- Figure 2: Global Web Analytics Market Volume Breakdown (K Unit, %) by Region 2024 & 2032
- Figure 3: North America Web Analytics Market Revenue (Million), by Country 2024 & 2032
- Figure 4: North America Web Analytics Market Volume (K Unit), by Country 2024 & 2032
- Figure 5: North America Web Analytics Market Revenue Share (%), by Country 2024 & 2032
- Figure 6: North America Web Analytics Market Volume Share (%), by Country 2024 & 2032
- Figure 7: Europe Web Analytics Market Revenue (Million), by Country 2024 & 2032
- Figure 8: Europe Web Analytics Market Volume (K Unit), by Country 2024 & 2032
- Figure 9: Europe Web Analytics Market Revenue Share (%), by Country 2024 & 2032
- Figure 10: Europe Web Analytics Market Volume Share (%), by Country 2024 & 2032
- Figure 11: Asia Pacific Web Analytics Market Revenue (Million), by Country 2024 & 2032
- Figure 12: Asia Pacific Web Analytics Market Volume (K Unit), by Country 2024 & 2032
- Figure 13: Asia Pacific Web Analytics Market Revenue Share (%), by Country 2024 & 2032
- Figure 14: Asia Pacific Web Analytics Market Volume Share (%), by Country 2024 & 2032
- Figure 15: South America Web Analytics Market Revenue (Million), by Country 2024 & 2032
- Figure 16: South America Web Analytics Market Volume (K Unit), by Country 2024 & 2032
- Figure 17: South America Web Analytics Market Revenue Share (%), by Country 2024 & 2032
- Figure 18: South America Web Analytics Market Volume Share (%), by Country 2024 & 2032
- Figure 19: North America Web Analytics Market Revenue (Million), by Country 2024 & 2032
- Figure 20: North America Web Analytics Market Volume (K Unit), by Country 2024 & 2032
- Figure 21: North America Web Analytics Market Revenue Share (%), by Country 2024 & 2032
- Figure 22: North America Web Analytics Market Volume Share (%), by Country 2024 & 2032
- Figure 23: MEA Web Analytics Market Revenue (Million), by Country 2024 & 2032
- Figure 24: MEA Web Analytics Market Volume (K Unit), by Country 2024 & 2032
- Figure 25: MEA Web Analytics Market Revenue Share (%), by Country 2024 & 2032
- Figure 26: MEA Web Analytics Market Volume Share (%), by Country 2024 & 2032
- Figure 27: North America Web Analytics Market Revenue (Million), by Application 2024 & 2032
- Figure 28: North America Web Analytics Market Volume (K Unit), by Application 2024 & 2032
- Figure 29: North America Web Analytics Market Revenue Share (%), by Application 2024 & 2032
- Figure 30: North America Web Analytics Market Volume Share (%), by Application 2024 & 2032
- Figure 31: North America Web Analytics Market Revenue (Million), by Offering 2024 & 2032
- Figure 32: North America Web Analytics Market Volume (K Unit), by Offering 2024 & 2032
- Figure 33: North America Web Analytics Market Revenue Share (%), by Offering 2024 & 2032
- Figure 34: North America Web Analytics Market Volume Share (%), by Offering 2024 & 2032
- Figure 35: North America Web Analytics Market Revenue (Million), by End-User Vertical 2024 & 2032
- Figure 36: North America Web Analytics Market Volume (K Unit), by End-User Vertical 2024 & 2032
- Figure 37: North America Web Analytics Market Revenue Share (%), by End-User Vertical 2024 & 2032
- Figure 38: North America Web Analytics Market Volume Share (%), by End-User Vertical 2024 & 2032
- Figure 39: North America Web Analytics Market Revenue (Million), by Country 2024 & 2032
- Figure 40: North America Web Analytics Market Volume (K Unit), by Country 2024 & 2032
- Figure 41: North America Web Analytics Market Revenue Share (%), by Country 2024 & 2032
- Figure 42: North America Web Analytics Market Volume Share (%), by Country 2024 & 2032
- Figure 43: Europe Web Analytics Market Revenue (Million), by Application 2024 & 2032
- Figure 44: Europe Web Analytics Market Volume (K Unit), by Application 2024 & 2032
- Figure 45: Europe Web Analytics Market Revenue Share (%), by Application 2024 & 2032
- Figure 46: Europe Web Analytics Market Volume Share (%), by Application 2024 & 2032
- Figure 47: Europe Web Analytics Market Revenue (Million), by Offering 2024 & 2032
- Figure 48: Europe Web Analytics Market Volume (K Unit), by Offering 2024 & 2032
- Figure 49: Europe Web Analytics Market Revenue Share (%), by Offering 2024 & 2032
- Figure 50: Europe Web Analytics Market Volume Share (%), by Offering 2024 & 2032
- Figure 51: Europe Web Analytics Market Revenue (Million), by End-User Vertical 2024 & 2032
- Figure 52: Europe Web Analytics Market Volume (K Unit), by End-User Vertical 2024 & 2032
- Figure 53: Europe Web Analytics Market Revenue Share (%), by End-User Vertical 2024 & 2032
- Figure 54: Europe Web Analytics Market Volume Share (%), by End-User Vertical 2024 & 2032
- Figure 55: Europe Web Analytics Market Revenue (Million), by Country 2024 & 2032
- Figure 56: Europe Web Analytics Market Volume (K Unit), by Country 2024 & 2032
- Figure 57: Europe Web Analytics Market Revenue Share (%), by Country 2024 & 2032
- Figure 58: Europe Web Analytics Market Volume Share (%), by Country 2024 & 2032
- Figure 59: Asia Web Analytics Market Revenue (Million), by Application 2024 & 2032
- Figure 60: Asia Web Analytics Market Volume (K Unit), by Application 2024 & 2032
- Figure 61: Asia Web Analytics Market Revenue Share (%), by Application 2024 & 2032
- Figure 62: Asia Web Analytics Market Volume Share (%), by Application 2024 & 2032
- Figure 63: Asia Web Analytics Market Revenue (Million), by Offering 2024 & 2032
- Figure 64: Asia Web Analytics Market Volume (K Unit), by Offering 2024 & 2032
- Figure 65: Asia Web Analytics Market Revenue Share (%), by Offering 2024 & 2032
- Figure 66: Asia Web Analytics Market Volume Share (%), by Offering 2024 & 2032
- Figure 67: Asia Web Analytics Market Revenue (Million), by End-User Vertical 2024 & 2032
- Figure 68: Asia Web Analytics Market Volume (K Unit), by End-User Vertical 2024 & 2032
- Figure 69: Asia Web Analytics Market Revenue Share (%), by End-User Vertical 2024 & 2032
- Figure 70: Asia Web Analytics Market Volume Share (%), by End-User Vertical 2024 & 2032
- Figure 71: Asia Web Analytics Market Revenue (Million), by Country 2024 & 2032
- Figure 72: Asia Web Analytics Market Volume (K Unit), by Country 2024 & 2032
- Figure 73: Asia Web Analytics Market Revenue Share (%), by Country 2024 & 2032
- Figure 74: Asia Web Analytics Market Volume Share (%), by Country 2024 & 2032
- Figure 75: Australia and New Zealand Web Analytics Market Revenue (Million), by Application 2024 & 2032
- Figure 76: Australia and New Zealand Web Analytics Market Volume (K Unit), by Application 2024 & 2032
- Figure 77: Australia and New Zealand Web Analytics Market Revenue Share (%), by Application 2024 & 2032
- Figure 78: Australia and New Zealand Web Analytics Market Volume Share (%), by Application 2024 & 2032
- Figure 79: Australia and New Zealand Web Analytics Market Revenue (Million), by Offering 2024 & 2032
- Figure 80: Australia and New Zealand Web Analytics Market Volume (K Unit), by Offering 2024 & 2032
- Figure 81: Australia and New Zealand Web Analytics Market Revenue Share (%), by Offering 2024 & 2032
- Figure 82: Australia and New Zealand Web Analytics Market Volume Share (%), by Offering 2024 & 2032
- Figure 83: Australia and New Zealand Web Analytics Market Revenue (Million), by End-User Vertical 2024 & 2032
- Figure 84: Australia and New Zealand Web Analytics Market Volume (K Unit), by End-User Vertical 2024 & 2032
- Figure 85: Australia and New Zealand Web Analytics Market Revenue Share (%), by End-User Vertical 2024 & 2032
- Figure 86: Australia and New Zealand Web Analytics Market Volume Share (%), by End-User Vertical 2024 & 2032
- Figure 87: Australia and New Zealand Web Analytics Market Revenue (Million), by Country 2024 & 2032
- Figure 88: Australia and New Zealand Web Analytics Market Volume (K Unit), by Country 2024 & 2032
- Figure 89: Australia and New Zealand Web Analytics Market Revenue Share (%), by Country 2024 & 2032
- Figure 90: Australia and New Zealand Web Analytics Market Volume Share (%), by Country 2024 & 2032
- Figure 91: Latin America Web Analytics Market Revenue (Million), by Application 2024 & 2032
- Figure 92: Latin America Web Analytics Market Volume (K Unit), by Application 2024 & 2032
- Figure 93: Latin America Web Analytics Market Revenue Share (%), by Application 2024 & 2032
- Figure 94: Latin America Web Analytics Market Volume Share (%), by Application 2024 & 2032
- Figure 95: Latin America Web Analytics Market Revenue (Million), by Offering 2024 & 2032
- Figure 96: Latin America Web Analytics Market Volume (K Unit), by Offering 2024 & 2032
- Figure 97: Latin America Web Analytics Market Revenue Share (%), by Offering 2024 & 2032
- Figure 98: Latin America Web Analytics Market Volume Share (%), by Offering 2024 & 2032
- Figure 99: Latin America Web Analytics Market Revenue (Million), by End-User Vertical 2024 & 2032
- Figure 100: Latin America Web Analytics Market Volume (K Unit), by End-User Vertical 2024 & 2032
- Figure 101: Latin America Web Analytics Market Revenue Share (%), by End-User Vertical 2024 & 2032
- Figure 102: Latin America Web Analytics Market Volume Share (%), by End-User Vertical 2024 & 2032
- Figure 103: Latin America Web Analytics Market Revenue (Million), by Country 2024 & 2032
- Figure 104: Latin America Web Analytics Market Volume (K Unit), by Country 2024 & 2032
- Figure 105: Latin America Web Analytics Market Revenue Share (%), by Country 2024 & 2032
- Figure 106: Latin America Web Analytics Market Volume Share (%), by Country 2024 & 2032
- Figure 107: Middle East and Africa Web Analytics Market Revenue (Million), by Application 2024 & 2032
- Figure 108: Middle East and Africa Web Analytics Market Volume (K Unit), by Application 2024 & 2032
- Figure 109: Middle East and Africa Web Analytics Market Revenue Share (%), by Application 2024 & 2032
- Figure 110: Middle East and Africa Web Analytics Market Volume Share (%), by Application 2024 & 2032
- Figure 111: Middle East and Africa Web Analytics Market Revenue (Million), by Offering 2024 & 2032
- Figure 112: Middle East and Africa Web Analytics Market Volume (K Unit), by Offering 2024 & 2032
- Figure 113: Middle East and Africa Web Analytics Market Revenue Share (%), by Offering 2024 & 2032
- Figure 114: Middle East and Africa Web Analytics Market Volume Share (%), by Offering 2024 & 2032
- Figure 115: Middle East and Africa Web Analytics Market Revenue (Million), by End-User Vertical 2024 & 2032
- Figure 116: Middle East and Africa Web Analytics Market Volume (K Unit), by End-User Vertical 2024 & 2032
- Figure 117: Middle East and Africa Web Analytics Market Revenue Share (%), by End-User Vertical 2024 & 2032
- Figure 118: Middle East and Africa Web Analytics Market Volume Share (%), by End-User Vertical 2024 & 2032
- Figure 119: Middle East and Africa Web Analytics Market Revenue (Million), by Country 2024 & 2032
- Figure 120: Middle East and Africa Web Analytics Market Volume (K Unit), by Country 2024 & 2032
- Figure 121: Middle East and Africa Web Analytics Market Revenue Share (%), by Country 2024 & 2032
- Figure 122: Middle East and Africa Web Analytics Market Volume Share (%), by Country 2024 & 2032
List of Tables
- Table 1: Global Web Analytics Market Revenue Million Forecast, by Region 2019 & 2032
- Table 2: Global Web Analytics Market Volume K Unit Forecast, by Region 2019 & 2032
- Table 3: Global Web Analytics Market Revenue Million Forecast, by Application 2019 & 2032
- Table 4: Global Web Analytics Market Volume K Unit Forecast, by Application 2019 & 2032
- Table 5: Global Web Analytics Market Revenue Million Forecast, by Offering 2019 & 2032
- Table 6: Global Web Analytics Market Volume K Unit Forecast, by Offering 2019 & 2032
- Table 7: Global Web Analytics Market Revenue Million Forecast, by End-User Vertical 2019 & 2032
- Table 8: Global Web Analytics Market Volume K Unit Forecast, by End-User Vertical 2019 & 2032
- Table 9: Global Web Analytics Market Revenue Million Forecast, by Region 2019 & 2032
- Table 10: Global Web Analytics Market Volume K Unit Forecast, by Region 2019 & 2032
- Table 11: Global Web Analytics Market Revenue Million Forecast, by Country 2019 & 2032
- Table 12: Global Web Analytics Market Volume K Unit Forecast, by Country 2019 & 2032
- Table 13: United States Web Analytics Market Revenue (Million) Forecast, by Application 2019 & 2032
- Table 14: United States Web Analytics Market Volume (K Unit) Forecast, by Application 2019 & 2032
- Table 15: Canada Web Analytics Market Revenue (Million) Forecast, by Application 2019 & 2032
- Table 16: Canada Web Analytics Market Volume (K Unit) Forecast, by Application 2019 & 2032
- Table 17: Mexico Web Analytics Market Revenue (Million) Forecast, by Application 2019 & 2032
- Table 18: Mexico Web Analytics Market Volume (K Unit) Forecast, by Application 2019 & 2032
- Table 19: Global Web Analytics Market Revenue Million Forecast, by Country 2019 & 2032
- Table 20: Global Web Analytics Market Volume K Unit Forecast, by Country 2019 & 2032
- Table 21: Germany Web Analytics Market Revenue (Million) Forecast, by Application 2019 & 2032
- Table 22: Germany Web Analytics Market Volume (K Unit) Forecast, by Application 2019 & 2032
- Table 23: United Kingdom Web Analytics Market Revenue (Million) Forecast, by Application 2019 & 2032
- Table 24: United Kingdom Web Analytics Market Volume (K Unit) Forecast, by Application 2019 & 2032
- Table 25: France Web Analytics Market Revenue (Million) Forecast, by Application 2019 & 2032
- Table 26: France Web Analytics Market Volume (K Unit) Forecast, by Application 2019 & 2032
- Table 27: Spain Web Analytics Market Revenue (Million) Forecast, by Application 2019 & 2032
- Table 28: Spain Web Analytics Market Volume (K Unit) Forecast, by Application 2019 & 2032
- Table 29: Italy Web Analytics Market Revenue (Million) Forecast, by Application 2019 & 2032
- Table 30: Italy Web Analytics Market Volume (K Unit) Forecast, by Application 2019 & 2032
- Table 31: Spain Web Analytics Market Revenue (Million) Forecast, by Application 2019 & 2032
- Table 32: Spain Web Analytics Market Volume (K Unit) Forecast, by Application 2019 & 2032
- Table 33: Belgium Web Analytics Market Revenue (Million) Forecast, by Application 2019 & 2032
- Table 34: Belgium Web Analytics Market Volume (K Unit) Forecast, by Application 2019 & 2032
- Table 35: Netherland Web Analytics Market Revenue (Million) Forecast, by Application 2019 & 2032
- Table 36: Netherland Web Analytics Market Volume (K Unit) Forecast, by Application 2019 & 2032
- Table 37: Nordics Web Analytics Market Revenue (Million) Forecast, by Application 2019 & 2032
- Table 38: Nordics Web Analytics Market Volume (K Unit) Forecast, by Application 2019 & 2032
- Table 39: Rest of Europe Web Analytics Market Revenue (Million) Forecast, by Application 2019 & 2032
- Table 40: Rest of Europe Web Analytics Market Volume (K Unit) Forecast, by Application 2019 & 2032
- Table 41: Global Web Analytics Market Revenue Million Forecast, by Country 2019 & 2032
- Table 42: Global Web Analytics Market Volume K Unit Forecast, by Country 2019 & 2032
- Table 43: China Web Analytics Market Revenue (Million) Forecast, by Application 2019 & 2032
- Table 44: China Web Analytics Market Volume (K Unit) Forecast, by Application 2019 & 2032
- Table 45: Japan Web Analytics Market Revenue (Million) Forecast, by Application 2019 & 2032
- Table 46: Japan Web Analytics Market Volume (K Unit) Forecast, by Application 2019 & 2032
- Table 47: India Web Analytics Market Revenue (Million) Forecast, by Application 2019 & 2032
- Table 48: India Web Analytics Market Volume (K Unit) Forecast, by Application 2019 & 2032
- Table 49: South Korea Web Analytics Market Revenue (Million) Forecast, by Application 2019 & 2032
- Table 50: South Korea Web Analytics Market Volume (K Unit) Forecast, by Application 2019 & 2032
- Table 51: Southeast Asia Web Analytics Market Revenue (Million) Forecast, by Application 2019 & 2032
- Table 52: Southeast Asia Web Analytics Market Volume (K Unit) Forecast, by Application 2019 & 2032
- Table 53: Australia Web Analytics Market Revenue (Million) Forecast, by Application 2019 & 2032
- Table 54: Australia Web Analytics Market Volume (K Unit) Forecast, by Application 2019 & 2032
- Table 55: Indonesia Web Analytics Market Revenue (Million) Forecast, by Application 2019 & 2032
- Table 56: Indonesia Web Analytics Market Volume (K Unit) Forecast, by Application 2019 & 2032
- Table 57: Phillipes Web Analytics Market Revenue (Million) Forecast, by Application 2019 & 2032
- Table 58: Phillipes Web Analytics Market Volume (K Unit) Forecast, by Application 2019 & 2032
- Table 59: Singapore Web Analytics Market Revenue (Million) Forecast, by Application 2019 & 2032
- Table 60: Singapore Web Analytics Market Volume (K Unit) Forecast, by Application 2019 & 2032
- Table 61: Thailandc Web Analytics Market Revenue (Million) Forecast, by Application 2019 & 2032
- Table 62: Thailandc Web Analytics Market Volume (K Unit) Forecast, by Application 2019 & 2032
- Table 63: Rest of Asia Pacific Web Analytics Market Revenue (Million) Forecast, by Application 2019 & 2032
- Table 64: Rest of Asia Pacific Web Analytics Market Volume (K Unit) Forecast, by Application 2019 & 2032
- Table 65: Global Web Analytics Market Revenue Million Forecast, by Country 2019 & 2032
- Table 66: Global Web Analytics Market Volume K Unit Forecast, by Country 2019 & 2032
- Table 67: Brazil Web Analytics Market Revenue (Million) Forecast, by Application 2019 & 2032
- Table 68: Brazil Web Analytics Market Volume (K Unit) Forecast, by Application 2019 & 2032
- Table 69: Argentina Web Analytics Market Revenue (Million) Forecast, by Application 2019 & 2032
- Table 70: Argentina Web Analytics Market Volume (K Unit) Forecast, by Application 2019 & 2032
- Table 71: Peru Web Analytics Market Revenue (Million) Forecast, by Application 2019 & 2032
- Table 72: Peru Web Analytics Market Volume (K Unit) Forecast, by Application 2019 & 2032
- Table 73: Chile Web Analytics Market Revenue (Million) Forecast, by Application 2019 & 2032
- Table 74: Chile Web Analytics Market Volume (K Unit) Forecast, by Application 2019 & 2032
- Table 75: Colombia Web Analytics Market Revenue (Million) Forecast, by Application 2019 & 2032
- Table 76: Colombia Web Analytics Market Volume (K Unit) Forecast, by Application 2019 & 2032
- Table 77: Ecuador Web Analytics Market Revenue (Million) Forecast, by Application 2019 & 2032
- Table 78: Ecuador Web Analytics Market Volume (K Unit) Forecast, by Application 2019 & 2032
- Table 79: Venezuela Web Analytics Market Revenue (Million) Forecast, by Application 2019 & 2032
- Table 80: Venezuela Web Analytics Market Volume (K Unit) Forecast, by Application 2019 & 2032
- Table 81: Rest of South America Web Analytics Market Revenue (Million) Forecast, by Application 2019 & 2032
- Table 82: Rest of South America Web Analytics Market Volume (K Unit) Forecast, by Application 2019 & 2032
- Table 83: Global Web Analytics Market Revenue Million Forecast, by Country 2019 & 2032
- Table 84: Global Web Analytics Market Volume K Unit Forecast, by Country 2019 & 2032
- Table 85: United States Web Analytics Market Revenue (Million) Forecast, by Application 2019 & 2032
- Table 86: United States Web Analytics Market Volume (K Unit) Forecast, by Application 2019 & 2032
- Table 87: Canada Web Analytics Market Revenue (Million) Forecast, by Application 2019 & 2032
- Table 88: Canada Web Analytics Market Volume (K Unit) Forecast, by Application 2019 & 2032
- Table 89: Mexico Web Analytics Market Revenue (Million) Forecast, by Application 2019 & 2032
- Table 90: Mexico Web Analytics Market Volume (K Unit) Forecast, by Application 2019 & 2032
- Table 91: Global Web Analytics Market Revenue Million Forecast, by Country 2019 & 2032
- Table 92: Global Web Analytics Market Volume K Unit Forecast, by Country 2019 & 2032
- Table 93: United Arab Emirates Web Analytics Market Revenue (Million) Forecast, by Application 2019 & 2032
- Table 94: United Arab Emirates Web Analytics Market Volume (K Unit) Forecast, by Application 2019 & 2032
- Table 95: Saudi Arabia Web Analytics Market Revenue (Million) Forecast, by Application 2019 & 2032
- Table 96: Saudi Arabia Web Analytics Market Volume (K Unit) Forecast, by Application 2019 & 2032
- Table 97: South Africa Web Analytics Market Revenue (Million) Forecast, by Application 2019 & 2032
- Table 98: South Africa Web Analytics Market Volume (K Unit) Forecast, by Application 2019 & 2032
- Table 99: Rest of Middle East and Africa Web Analytics Market Revenue (Million) Forecast, by Application 2019 & 2032
- Table 100: Rest of Middle East and Africa Web Analytics Market Volume (K Unit) Forecast, by Application 2019 & 2032
- Table 101: Global Web Analytics Market Revenue Million Forecast, by Application 2019 & 2032
- Table 102: Global Web Analytics Market Volume K Unit Forecast, by Application 2019 & 2032
- Table 103: Global Web Analytics Market Revenue Million Forecast, by Offering 2019 & 2032
- Table 104: Global Web Analytics Market Volume K Unit Forecast, by Offering 2019 & 2032
- Table 105: Global Web Analytics Market Revenue Million Forecast, by End-User Vertical 2019 & 2032
- Table 106: Global Web Analytics Market Volume K Unit Forecast, by End-User Vertical 2019 & 2032
- Table 107: Global Web Analytics Market Revenue Million Forecast, by Country 2019 & 2032
- Table 108: Global Web Analytics Market Volume K Unit Forecast, by Country 2019 & 2032
- Table 109: Global Web Analytics Market Revenue Million Forecast, by Application 2019 & 2032
- Table 110: Global Web Analytics Market Volume K Unit Forecast, by Application 2019 & 2032
- Table 111: Global Web Analytics Market Revenue Million Forecast, by Offering 2019 & 2032
- Table 112: Global Web Analytics Market Volume K Unit Forecast, by Offering 2019 & 2032
- Table 113: Global Web Analytics Market Revenue Million Forecast, by End-User Vertical 2019 & 2032
- Table 114: Global Web Analytics Market Volume K Unit Forecast, by End-User Vertical 2019 & 2032
- Table 115: Global Web Analytics Market Revenue Million Forecast, by Country 2019 & 2032
- Table 116: Global Web Analytics Market Volume K Unit Forecast, by Country 2019 & 2032
- Table 117: Global Web Analytics Market Revenue Million Forecast, by Application 2019 & 2032
- Table 118: Global Web Analytics Market Volume K Unit Forecast, by Application 2019 & 2032
- Table 119: Global Web Analytics Market Revenue Million Forecast, by Offering 2019 & 2032
- Table 120: Global Web Analytics Market Volume K Unit Forecast, by Offering 2019 & 2032
- Table 121: Global Web Analytics Market Revenue Million Forecast, by End-User Vertical 2019 & 2032
- Table 122: Global Web Analytics Market Volume K Unit Forecast, by End-User Vertical 2019 & 2032
- Table 123: Global Web Analytics Market Revenue Million Forecast, by Country 2019 & 2032
- Table 124: Global Web Analytics Market Volume K Unit Forecast, by Country 2019 & 2032
- Table 125: Global Web Analytics Market Revenue Million Forecast, by Application 2019 & 2032
- Table 126: Global Web Analytics Market Volume K Unit Forecast, by Application 2019 & 2032
- Table 127: Global Web Analytics Market Revenue Million Forecast, by Offering 2019 & 2032
- Table 128: Global Web Analytics Market Volume K Unit Forecast, by Offering 2019 & 2032
- Table 129: Global Web Analytics Market Revenue Million Forecast, by End-User Vertical 2019 & 2032
- Table 130: Global Web Analytics Market Volume K Unit Forecast, by End-User Vertical 2019 & 2032
- Table 131: Global Web Analytics Market Revenue Million Forecast, by Country 2019 & 2032
- Table 132: Global Web Analytics Market Volume K Unit Forecast, by Country 2019 & 2032
- Table 133: Global Web Analytics Market Revenue Million Forecast, by Application 2019 & 2032
- Table 134: Global Web Analytics Market Volume K Unit Forecast, by Application 2019 & 2032
- Table 135: Global Web Analytics Market Revenue Million Forecast, by Offering 2019 & 2032
- Table 136: Global Web Analytics Market Volume K Unit Forecast, by Offering 2019 & 2032
- Table 137: Global Web Analytics Market Revenue Million Forecast, by End-User Vertical 2019 & 2032
- Table 138: Global Web Analytics Market Volume K Unit Forecast, by End-User Vertical 2019 & 2032
- Table 139: Global Web Analytics Market Revenue Million Forecast, by Country 2019 & 2032
- Table 140: Global Web Analytics Market Volume K Unit Forecast, by Country 2019 & 2032
- Table 141: Global Web Analytics Market Revenue Million Forecast, by Application 2019 & 2032
- Table 142: Global Web Analytics Market Volume K Unit Forecast, by Application 2019 & 2032
- Table 143: Global Web Analytics Market Revenue Million Forecast, by Offering 2019 & 2032
- Table 144: Global Web Analytics Market Volume K Unit Forecast, by Offering 2019 & 2032
- Table 145: Global Web Analytics Market Revenue Million Forecast, by End-User Vertical 2019 & 2032
- Table 146: Global Web Analytics Market Volume K Unit Forecast, by End-User Vertical 2019 & 2032
- Table 147: Global Web Analytics Market Revenue Million Forecast, by Country 2019 & 2032
- Table 148: Global Web Analytics Market Volume K Unit Forecast, by Country 2019 & 2032
Frequently Asked Questions
1. What is the projected Compound Annual Growth Rate (CAGR) of the Web Analytics Market?
The projected CAGR is approximately 18.47%.
2. Which companies are prominent players in the Web Analytics Market?
Key companies in the market include SimilarWeb Ltd, Yahoo! Inc (Verizon), IBM Corporation, Applied Technologies Internet SA, Google LLC, Teradata Corporation, MicroStrategy Incorporated, Adobe Systems Incorporated, SAS Institute, Webtrends Inc, comScore Inc, Microsoft Inc, Facebook Inc, Hootsuite Inc, Splunk Inc, Tableau Software (Salesforce com Inc ).
3. What are the main segments of the Web Analytics Market?
The market segments include Application, Offering, End-User Vertical.
4. Can you provide details about the market size?
The market size is estimated to be USD 6.74 Million as of 2022.
5. What are some drivers contributing to market growth?
Growing Demand for Online Shopping Trends; Growing Importance of Mobile Analytics Solutions.
6. What are the notable trends driving market growth?
Growing Demand for Online Shopping Trends is Expected to Drives the Market Growth.
7. Are there any restraints impacting market growth?
Rigid Government Regulations and Data Privacy Regulations Compliance.
8. Can you provide examples of recent developments in the market?
March 2023: Datajoin, an integration solutions company in Orem, Utah, announced the Digital Analytics Integrations for Adobe Analytics and Google Analytics teams. These new connections extend digital analytics tools beyond website metrics to drive business customer acquisition. Datajoin can connect web analytics data to help to get the most out of marketing automation and advertising platforms.
9. What pricing options are available for accessing the report?
Pricing options include single-user, multi-user, and enterprise licenses priced at USD 4750, USD 5250, and USD 8750 respectively.
10. Is the market size provided in terms of value or volume?
The market size is provided in terms of value, measured in Million and volume, measured in K Unit.
11. Are there any specific market keywords associated with the report?
Yes, the market keyword associated with the report is "Web Analytics Market," which aids in identifying and referencing the specific market segment covered.
12. How do I determine which pricing option suits my needs best?
The pricing options vary based on user requirements and access needs. Individual users may opt for single-user licenses, while businesses requiring broader access may choose multi-user or enterprise licenses for cost-effective access to the report.
13. Are there any additional resources or data provided in the Web Analytics Market report?
While the report offers comprehensive insights, it's advisable to review the specific contents or supplementary materials provided to ascertain if additional resources or data are available.
14. How can I stay updated on further developments or reports in the Web Analytics Market?
To stay informed about further developments, trends, and reports in the Web Analytics Market, consider subscribing to industry newsletters, following relevant companies and organizations, or regularly checking reputable industry news sources and publications.
Methodology
Step 1 - Identification of Relevant Samples Size from Population Database


Step 2 - Approaches for Defining Global Market Size (Value, Volume* & Price*)

Note*: In applicable scenarios
Step 3 - Data Sources
Primary Research
- Web Analytics
- Survey Reports
- Research Institute
- Latest Research Reports
- Opinion Leaders
Secondary Research
- Annual Reports
- White Paper
- Latest Press Release
- Industry Association
- Paid Database
- Investor Presentations

Step 4 - Data Triangulation
Involves using different sources of information in order to increase the validity of a study
These sources are likely to be stakeholders in a program - participants, other researchers, program staff, other community members, and so on.
Then we put all data in single framework & apply various statistical tools to find out the dynamic on the market.
During the analysis stage, feedback from the stakeholder groups would be compared to determine areas of agreement as well as areas of divergence


