
Key Insights
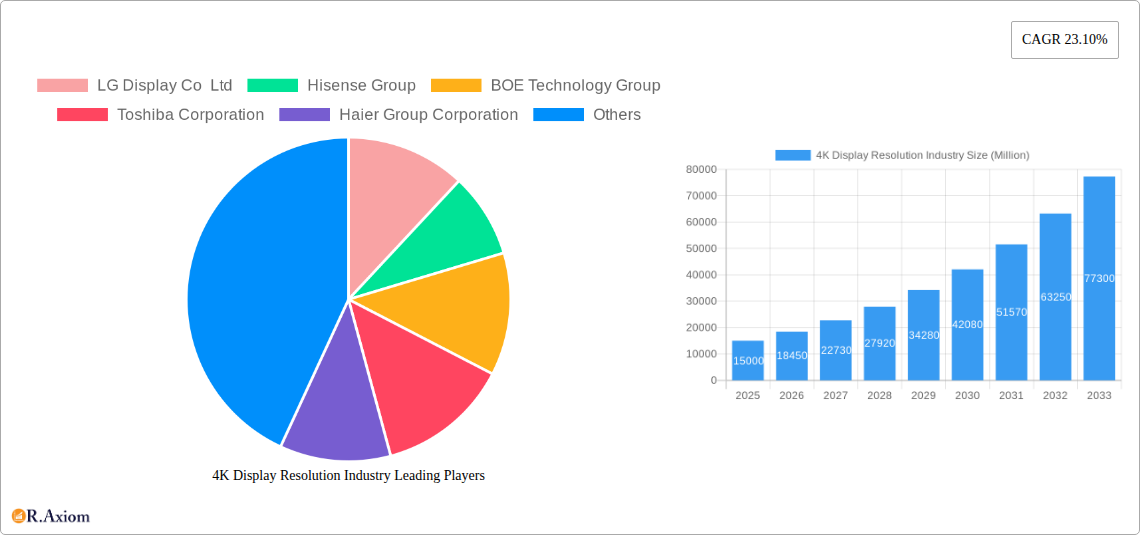
The 4K display resolution market is experiencing robust growth, driven by increasing demand for high-resolution visuals across various sectors. The market's Compound Annual Growth Rate (CAGR) of 23.10% from 2019 to 2024 signifies a significant upward trajectory. This expansion is fueled by several key factors. The proliferation of streaming services and the rise of 4K content creation have significantly boosted consumer demand for 4K displays in smart TVs, smartphones, and monitors. Furthermore, advancements in display technology, leading to more affordable and energy-efficient 4K panels, have broadened market accessibility. The adoption of 4K displays is also accelerating in professional sectors, such as aerospace and defense (for high-precision monitoring and control systems), business and education (for enhanced presentations and immersive learning experiences), and entertainment and media (for high-quality content production and broadcast). However, the market faces some restraints, including the higher cost of 4K displays compared to lower-resolution alternatives and the potential for supply chain disruptions impacting production and pricing. Segment-wise, smart TVs are currently the largest contributor to the market size, followed by monitors and smartphones, which show strong growth potential, especially smartphones with higher screen-to-body ratios. Key players like LG Display, Samsung, and BOE Technology are strategically positioned to capitalize on this growth, actively investing in R&D and expanding their product portfolios.
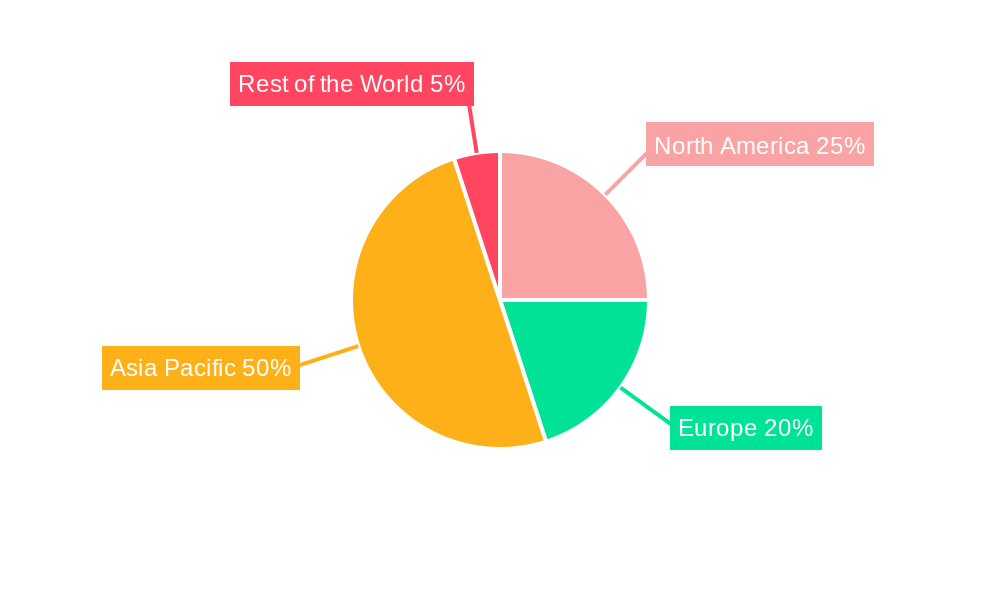
The Asia Pacific region is expected to dominate the 4K display resolution market, fueled by increasing disposable incomes and the rapid adoption of advanced technologies in countries like China, India, and South Korea. North America and Europe will also contribute significantly to the market, driven by consistent consumer demand and technological advancements. Looking ahead, the forecast period (2025-2033) anticipates continued expansion, with the market size expected to grow substantially. This growth will be largely driven by emerging applications such as extended reality (XR) technologies, which demand high-resolution displays for immersive experiences. Moreover, the increasing demand for larger screen sizes and improved display quality across various applications will further fuel market expansion. The ongoing development of mini-LED and micro-LED technologies will enhance image quality, contrast ratio, and efficiency, ultimately stimulating the market further.
4K Display Resolution Industry Market Report: 2019-2033
This comprehensive report provides a detailed analysis of the 4K display resolution industry, encompassing market size, growth projections, competitive landscape, and future trends. The study period covers 2019-2033, with 2025 as the base and estimated year. The forecast period extends from 2025 to 2033, while the historical period analyzed is 2019-2024. The report delves into key segments, including various end-user verticals and product types, offering actionable insights for industry stakeholders. The report values are expressed in Millions.
4K Display Resolution Industry Market Concentration & Innovation
The 4K display resolution market exhibits a moderately concentrated landscape, with a handful of major players controlling a significant market share. Companies like Samsung Electronics Co Ltd, LG Display Co Ltd, BOE Technology Group, and Sony Corporation hold prominent positions, driven by their substantial investments in R&D and extensive manufacturing capabilities. However, the market also features several smaller players offering specialized products or catering to niche segments. Market share dynamics are influenced by factors such as technological advancements, pricing strategies, and brand reputation. Innovation is a key driver, fueled by the ongoing pursuit of improved image quality, higher resolutions, and energy efficiency. Mini-LED and MicroLED technologies are prominent examples of recent innovations boosting display performance.
- Market Share (2024 Estimate): Samsung Electronics Co Ltd (xx%), LG Display Co Ltd (xx%), BOE Technology Group (xx%), Others (xx%).
- M&A Activity: The industry has witnessed a moderate level of M&A activity in recent years, primarily focused on consolidating manufacturing capacity and acquiring specialized technologies. Total M&A deal value during the period 2019-2024 is estimated at $xx Million.
- Regulatory Frameworks: Government regulations regarding energy efficiency and e-waste management impact the industry. These regulations drive manufacturers towards more sustainable production practices and product designs.
- Product Substitutes: While 4K resolution displays are increasingly dominant, alternative display technologies continue to exist, including other high-resolution displays.
- End-User Trends: Increasing demand for high-resolution visuals across various applications fuels market growth.
- Innovation Drivers: Mini-LED, MicroLED, and advancements in panel technologies drive innovation in brightness, contrast, and power consumption.
4K Display Resolution Industry Industry Trends & Insights
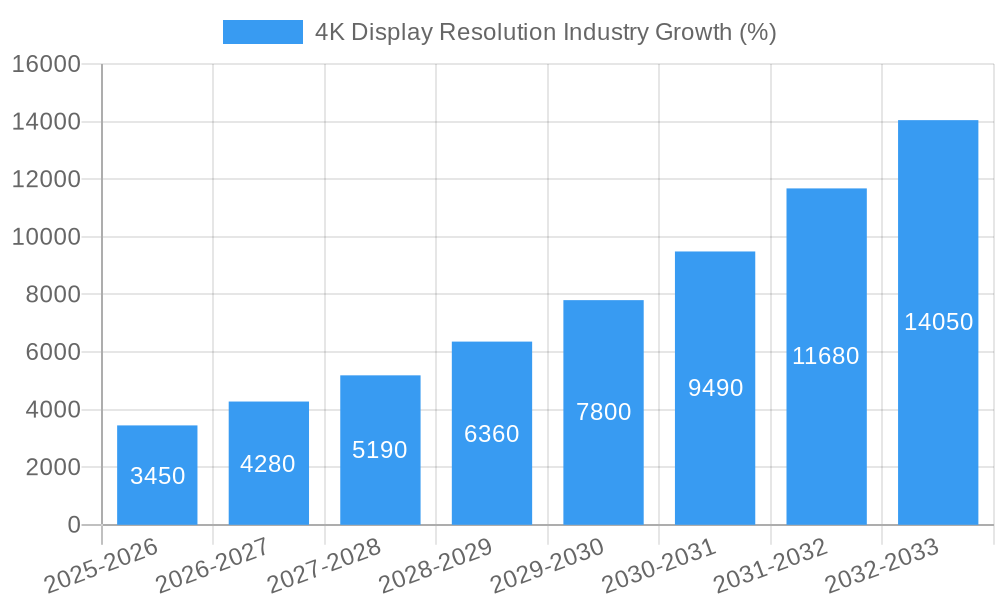
The 4K display resolution market is experiencing robust growth, driven by the increasing adoption of high-resolution displays across various applications. The global market size reached $xx Million in 2024 and is projected to reach $xx Million by 2033, exhibiting a CAGR of xx% during the forecast period. This growth is fueled by several factors, including rising disposable incomes, expanding internet penetration, and technological advancements. Consumers are increasingly demanding higher visual quality for entertainment, gaming, and professional applications. The shift towards ultra-high-definition content further fuels demand for 4K displays. Technological disruptions, such as the introduction of Mini-LED and MicroLED backlighting, enhance display quality and improve energy efficiency, positively impacting market penetration. Competitive dynamics are shaped by technological leadership, brand recognition, and pricing strategies. Market penetration of 4K displays continues to increase across various end-user segments, with significant growth in the consumer electronics sector and emerging opportunities in other domains.
Dominant Markets & Segments in 4K Display Resolution Industry
Leading Region/Country: The Asia-Pacific region currently holds a dominant position in the 4K display resolution market, driven by high consumer electronics demand and robust manufacturing infrastructure. China and South Korea are key contributors to this regional dominance.
By End-user Vertical:
- Entertainment and Media: This segment is the largest, driven by the growing popularity of streaming services and 4K content.
- Business and Education: The demand for high-resolution displays in corporate settings and educational institutions is increasing, but at a slower rate than Entertainment and Media.
- Retail and Advertisement: The use of 4K displays in retail and advertising is gaining traction, improving visual appeal and product presentation.
- Aerospace and Defence: This segment is experiencing steady growth, driven by the demand for high-quality visuals in cockpit displays and military applications.
- Other End-user Verticals: This category comprises smaller, diverse applications with slower but stable growth.
By Product Type:
- Smart TV: This is the dominant product segment, contributing significantly to market revenue.
- Monitor: The monitor segment experiences moderate growth, driven by increased demand in professional and gaming applications.
- Smartphone: Smartphone adoption of 4K displays is growing, but at a slower pace compared to TVs and monitors.
- Other Product Types: This includes automotive displays and other specialized applications.
Key Drivers: Strong economic growth, increasing disposable incomes, technological advancements, supportive government policies, and the development of robust infrastructure are key drivers in each segment. Competitive dynamics vary across segments, reflecting diverse technological needs and applications.
4K Display Resolution Industry Product Developments
Recent product innovations have focused on improving display quality, energy efficiency, and size. Mini-LED and MicroLED technologies have significantly enhanced brightness, contrast, and color accuracy. The introduction of larger screen sizes and foldable displays expands application possibilities. Competition is driving manufacturers to optimize production costs and offer competitive pricing, ultimately improving market access and adoption. The focus is on achieving a balance between performance, cost-effectiveness, and energy efficiency to cater to the diverse needs of various end-user segments.
Report Scope & Segmentation Analysis
This report segments the 4K display resolution market by end-user vertical (Aerospace and Defence, Business and Education, Entertainment and Media, Retail and Advertisement, Other End-user Verticals) and by product type (Monitor, Smart TV, Smartphone, Other Product Types). Each segment's growth projections, market size, and competitive dynamics are analyzed, providing a comprehensive understanding of the market landscape. The Entertainment and Media segment is projected to witness significant growth, driven by increasing demand for high-quality visual experiences. The Smart TV product type is expected to maintain its market dominance, while the monitor segment will also demonstrate steady growth.
Key Drivers of 4K Display Resolution Industry Growth
Technological advancements, particularly in display panel technologies like Mini-LED and MicroLED, are driving market growth. Increasing demand for high-resolution displays across various applications, such as entertainment, gaming, and professional use, fuels market expansion. Growing disposable incomes and increasing internet penetration in developing economies contribute to increased consumer spending on high-quality displays. Furthermore, government initiatives promoting digitalization and technological adoption further stimulate market growth.
Challenges in the 4K Display Resolution Industry Sector
The 4K display resolution industry faces several challenges. Supply chain disruptions and component shortages can impact production and pricing. Intense competition among manufacturers necessitates ongoing innovation and cost optimization. Stringent environmental regulations regarding e-waste management necessitate sustainable production practices. Fluctuations in raw material prices also influence production costs and profitability, posing challenges to consistent growth. The total estimated impact of these challenges on the industry's growth is currently estimated at xx% reduction in CAGR.
Emerging Opportunities in 4K Display Resolution Industry
Emerging opportunities lie in the adoption of 4K displays in new applications, such as augmented reality (AR) and virtual reality (VR) devices. The growing demand for foldable displays and higher refresh rate screens presents new avenues for market expansion. The development of more energy-efficient display technologies and advancements in MicroLED technology will further shape the industry's growth trajectory. Additionally, the increasing penetration of 4K displays in niche markets like automotive and healthcare presents exciting possibilities.
Leading Players in the 4K Display Resolution Industry Market
- LG Display Co Ltd
- Hisense Group
- BOE Technology Group
- Toshiba Corporation
- Haier Group Corporation
- Samsung Electronics Co Ltd
- AU Optronics
- Innolux Corporation
- Koninklijke Philips NV
- Sharp Corporation
- Panasonic Corporation
- Sony Corporation
Key Developments in 4K Display Resolution Industry Industry
- November 2022: LG introduced its first 27-inch, 4K surgical monitor with mini-LED technology. This highlights the expansion of 4K technology into specialized medical applications.
- August 2022: Sony India launched an 85-inch 4K Mini LED TV. This underscores the continuing trend of larger screen sizes and enhanced display technologies in the consumer market.
Strategic Outlook for 4K Display Resolution Industry Market
The 4K display resolution market is poised for continued growth, driven by ongoing technological advancements, increasing consumer demand, and expansion into new applications. The adoption of MicroLED technology and the development of more sustainable and energy-efficient displays will be key drivers of future growth. The market will witness increasing competition among manufacturers, necessitating continuous innovation and cost optimization to maintain market share. The potential for growth in emerging markets and niche applications presents significant opportunities for industry players.
4K Display Resolution Industry Segmentation
-
1. Product Type
- 1.1. Monitor
- 1.2. Smart TV
- 1.3. Smartphone
- 1.4. Other Product Types
-
2. End-user Vertical
- 2.1. Aerospace and Defence
- 2.2. Business and Education
- 2.3. Entertainment and Media
- 2.4. Retail and Advertisement
- 2.5. Other End-user Verticals
4K Display Resolution Industry Segmentation By Geography
- 1. North America
- 2. Europe
- 3. Asia Pacific
- 4. Rest of the World
4K Display Resolution Industry REPORT HIGHLIGHTS
| Aspects | Details |
|---|---|
| Study Period | 2019-2033 |
| Base Year | 2024 |
| Estimated Year | 2025 |
| Forecast Period | 2025-2033 |
| Historical Period | 2019-2024 |
| Growth Rate | CAGR of 23.10% from 2019-2033 |
| Segmentation |
|
Table of Contents
- 1. Introduction
- 1.1. Research Scope
- 1.2. Market Segmentation
- 1.3. Research Methodology
- 1.4. Definitions and Assumptions
- 2. Executive Summary
- 2.1. Introduction
- 3. Market Dynamics
- 3.1. Introduction
- 3.2. Market Drivers
- 3.2.1. Demand for High-resolution Display Products; Affordable Manufacturing of 4K Display Products
- 3.3. Market Restrains
- 3.3.1. The Need for High Investment in Content Creation and Broadcasting; Bandwidth Allocation for 4K Resolution
- 3.4. Market Trends
- 3.4.1. Entertainment and Media Segment to Hold Major Share
- 4. Market Factor Analysis
- 4.1. Porters Five Forces
- 4.2. Supply/Value Chain
- 4.3. PESTEL analysis
- 4.4. Market Entropy
- 4.5. Patent/Trademark Analysis
- 5. Global 4K Display Resolution Industry Analysis, Insights and Forecast, 2019-2031
- 5.1. Market Analysis, Insights and Forecast - by Product Type
- 5.1.1. Monitor
- 5.1.2. Smart TV
- 5.1.3. Smartphone
- 5.1.4. Other Product Types
- 5.2. Market Analysis, Insights and Forecast - by End-user Vertical
- 5.2.1. Aerospace and Defence
- 5.2.2. Business and Education
- 5.2.3. Entertainment and Media
- 5.2.4. Retail and Advertisement
- 5.2.5. Other End-user Verticals
- 5.3. Market Analysis, Insights and Forecast - by Region
- 5.3.1. North America
- 5.3.2. Europe
- 5.3.3. Asia Pacific
- 5.3.4. Rest of the World
- 5.1. Market Analysis, Insights and Forecast - by Product Type
- 6. North America 4K Display Resolution Industry Analysis, Insights and Forecast, 2019-2031
- 6.1. Market Analysis, Insights and Forecast - by Product Type
- 6.1.1. Monitor
- 6.1.2. Smart TV
- 6.1.3. Smartphone
- 6.1.4. Other Product Types
- 6.2. Market Analysis, Insights and Forecast - by End-user Vertical
- 6.2.1. Aerospace and Defence
- 6.2.2. Business and Education
- 6.2.3. Entertainment and Media
- 6.2.4. Retail and Advertisement
- 6.2.5. Other End-user Verticals
- 6.1. Market Analysis, Insights and Forecast - by Product Type
- 7. Europe 4K Display Resolution Industry Analysis, Insights and Forecast, 2019-2031
- 7.1. Market Analysis, Insights and Forecast - by Product Type
- 7.1.1. Monitor
- 7.1.2. Smart TV
- 7.1.3. Smartphone
- 7.1.4. Other Product Types
- 7.2. Market Analysis, Insights and Forecast - by End-user Vertical
- 7.2.1. Aerospace and Defence
- 7.2.2. Business and Education
- 7.2.3. Entertainment and Media
- 7.2.4. Retail and Advertisement
- 7.2.5. Other End-user Verticals
- 7.1. Market Analysis, Insights and Forecast - by Product Type
- 8. Asia Pacific 4K Display Resolution Industry Analysis, Insights and Forecast, 2019-2031
- 8.1. Market Analysis, Insights and Forecast - by Product Type
- 8.1.1. Monitor
- 8.1.2. Smart TV
- 8.1.3. Smartphone
- 8.1.4. Other Product Types
- 8.2. Market Analysis, Insights and Forecast - by End-user Vertical
- 8.2.1. Aerospace and Defence
- 8.2.2. Business and Education
- 8.2.3. Entertainment and Media
- 8.2.4. Retail and Advertisement
- 8.2.5. Other End-user Verticals
- 8.1. Market Analysis, Insights and Forecast - by Product Type
- 9. Rest of the World 4K Display Resolution Industry Analysis, Insights and Forecast, 2019-2031
- 9.1. Market Analysis, Insights and Forecast - by Product Type
- 9.1.1. Monitor
- 9.1.2. Smart TV
- 9.1.3. Smartphone
- 9.1.4. Other Product Types
- 9.2. Market Analysis, Insights and Forecast - by End-user Vertical
- 9.2.1. Aerospace and Defence
- 9.2.2. Business and Education
- 9.2.3. Entertainment and Media
- 9.2.4. Retail and Advertisement
- 9.2.5. Other End-user Verticals
- 9.1. Market Analysis, Insights and Forecast - by Product Type
- 10. North America 4K Display Resolution Industry Analysis, Insights and Forecast, 2019-2031
- 10.1. Market Analysis, Insights and Forecast - By Country/Sub-region
- 10.1.1.
- 11. Europe 4K Display Resolution Industry Analysis, Insights and Forecast, 2019-2031
- 11.1. Market Analysis, Insights and Forecast - By Country/Sub-region
- 11.1.1.
- 12. Asia Pacific 4K Display Resolution Industry Analysis, Insights and Forecast, 2019-2031
- 12.1. Market Analysis, Insights and Forecast - By Country/Sub-region
- 12.1.1.
- 13. Rest of the World 4K Display Resolution Industry Analysis, Insights and Forecast, 2019-2031
- 13.1. Market Analysis, Insights and Forecast - By Country/Sub-region
- 13.1.1.
- 14. Competitive Analysis
- 14.1. Global Market Share Analysis 2024
- 14.2. Company Profiles
- 14.2.1 LG Display Co Ltd
- 14.2.1.1. Overview
- 14.2.1.2. Products
- 14.2.1.3. SWOT Analysis
- 14.2.1.4. Recent Developments
- 14.2.1.5. Financials (Based on Availability)
- 14.2.2 Hisense Group
- 14.2.2.1. Overview
- 14.2.2.2. Products
- 14.2.2.3. SWOT Analysis
- 14.2.2.4. Recent Developments
- 14.2.2.5. Financials (Based on Availability)
- 14.2.3 BOE Technology Group
- 14.2.3.1. Overview
- 14.2.3.2. Products
- 14.2.3.3. SWOT Analysis
- 14.2.3.4. Recent Developments
- 14.2.3.5. Financials (Based on Availability)
- 14.2.4 Toshiba Corporation
- 14.2.4.1. Overview
- 14.2.4.2. Products
- 14.2.4.3. SWOT Analysis
- 14.2.4.4. Recent Developments
- 14.2.4.5. Financials (Based on Availability)
- 14.2.5 Haier Group Corporation
- 14.2.5.1. Overview
- 14.2.5.2. Products
- 14.2.5.3. SWOT Analysis
- 14.2.5.4. Recent Developments
- 14.2.5.5. Financials (Based on Availability)
- 14.2.6 Samsung Electronics Co Ltd
- 14.2.6.1. Overview
- 14.2.6.2. Products
- 14.2.6.3. SWOT Analysis
- 14.2.6.4. Recent Developments
- 14.2.6.5. Financials (Based on Availability)
- 14.2.7 AU Optronics*List Not Exhaustive
- 14.2.7.1. Overview
- 14.2.7.2. Products
- 14.2.7.3. SWOT Analysis
- 14.2.7.4. Recent Developments
- 14.2.7.5. Financials (Based on Availability)
- 14.2.8 Innolux Corporation
- 14.2.8.1. Overview
- 14.2.8.2. Products
- 14.2.8.3. SWOT Analysis
- 14.2.8.4. Recent Developments
- 14.2.8.5. Financials (Based on Availability)
- 14.2.9 Koninklijke Philips NV
- 14.2.9.1. Overview
- 14.2.9.2. Products
- 14.2.9.3. SWOT Analysis
- 14.2.9.4. Recent Developments
- 14.2.9.5. Financials (Based on Availability)
- 14.2.10 Sharp Corporation
- 14.2.10.1. Overview
- 14.2.10.2. Products
- 14.2.10.3. SWOT Analysis
- 14.2.10.4. Recent Developments
- 14.2.10.5. Financials (Based on Availability)
- 14.2.11 Panasonic Corporation
- 14.2.11.1. Overview
- 14.2.11.2. Products
- 14.2.11.3. SWOT Analysis
- 14.2.11.4. Recent Developments
- 14.2.11.5. Financials (Based on Availability)
- 14.2.12 Sony Corporation
- 14.2.12.1. Overview
- 14.2.12.2. Products
- 14.2.12.3. SWOT Analysis
- 14.2.12.4. Recent Developments
- 14.2.12.5. Financials (Based on Availability)
- 14.2.1 LG Display Co Ltd
List of Figures
- Figure 1: Global 4K Display Resolution Industry Revenue Breakdown (Million, %) by Region 2024 & 2032
- Figure 2: North America 4K Display Resolution Industry Revenue (Million), by Country 2024 & 2032
- Figure 3: North America 4K Display Resolution Industry Revenue Share (%), by Country 2024 & 2032
- Figure 4: Europe 4K Display Resolution Industry Revenue (Million), by Country 2024 & 2032
- Figure 5: Europe 4K Display Resolution Industry Revenue Share (%), by Country 2024 & 2032
- Figure 6: Asia Pacific 4K Display Resolution Industry Revenue (Million), by Country 2024 & 2032
- Figure 7: Asia Pacific 4K Display Resolution Industry Revenue Share (%), by Country 2024 & 2032
- Figure 8: Rest of the World 4K Display Resolution Industry Revenue (Million), by Country 2024 & 2032
- Figure 9: Rest of the World 4K Display Resolution Industry Revenue Share (%), by Country 2024 & 2032
- Figure 10: North America 4K Display Resolution Industry Revenue (Million), by Product Type 2024 & 2032
- Figure 11: North America 4K Display Resolution Industry Revenue Share (%), by Product Type 2024 & 2032
- Figure 12: North America 4K Display Resolution Industry Revenue (Million), by End-user Vertical 2024 & 2032
- Figure 13: North America 4K Display Resolution Industry Revenue Share (%), by End-user Vertical 2024 & 2032
- Figure 14: North America 4K Display Resolution Industry Revenue (Million), by Country 2024 & 2032
- Figure 15: North America 4K Display Resolution Industry Revenue Share (%), by Country 2024 & 2032
- Figure 16: Europe 4K Display Resolution Industry Revenue (Million), by Product Type 2024 & 2032
- Figure 17: Europe 4K Display Resolution Industry Revenue Share (%), by Product Type 2024 & 2032
- Figure 18: Europe 4K Display Resolution Industry Revenue (Million), by End-user Vertical 2024 & 2032
- Figure 19: Europe 4K Display Resolution Industry Revenue Share (%), by End-user Vertical 2024 & 2032
- Figure 20: Europe 4K Display Resolution Industry Revenue (Million), by Country 2024 & 2032
- Figure 21: Europe 4K Display Resolution Industry Revenue Share (%), by Country 2024 & 2032
- Figure 22: Asia Pacific 4K Display Resolution Industry Revenue (Million), by Product Type 2024 & 2032
- Figure 23: Asia Pacific 4K Display Resolution Industry Revenue Share (%), by Product Type 2024 & 2032
- Figure 24: Asia Pacific 4K Display Resolution Industry Revenue (Million), by End-user Vertical 2024 & 2032
- Figure 25: Asia Pacific 4K Display Resolution Industry Revenue Share (%), by End-user Vertical 2024 & 2032
- Figure 26: Asia Pacific 4K Display Resolution Industry Revenue (Million), by Country 2024 & 2032
- Figure 27: Asia Pacific 4K Display Resolution Industry Revenue Share (%), by Country 2024 & 2032
- Figure 28: Rest of the World 4K Display Resolution Industry Revenue (Million), by Product Type 2024 & 2032
- Figure 29: Rest of the World 4K Display Resolution Industry Revenue Share (%), by Product Type 2024 & 2032
- Figure 30: Rest of the World 4K Display Resolution Industry Revenue (Million), by End-user Vertical 2024 & 2032
- Figure 31: Rest of the World 4K Display Resolution Industry Revenue Share (%), by End-user Vertical 2024 & 2032
- Figure 32: Rest of the World 4K Display Resolution Industry Revenue (Million), by Country 2024 & 2032
- Figure 33: Rest of the World 4K Display Resolution Industry Revenue Share (%), by Country 2024 & 2032
List of Tables
- Table 1: Global 4K Display Resolution Industry Revenue Million Forecast, by Region 2019 & 2032
- Table 2: Global 4K Display Resolution Industry Revenue Million Forecast, by Product Type 2019 & 2032
- Table 3: Global 4K Display Resolution Industry Revenue Million Forecast, by End-user Vertical 2019 & 2032
- Table 4: Global 4K Display Resolution Industry Revenue Million Forecast, by Region 2019 & 2032
- Table 5: Global 4K Display Resolution Industry Revenue Million Forecast, by Country 2019 & 2032
- Table 6: 4K Display Resolution Industry Revenue (Million) Forecast, by Application 2019 & 2032
- Table 7: Global 4K Display Resolution Industry Revenue Million Forecast, by Country 2019 & 2032
- Table 8: 4K Display Resolution Industry Revenue (Million) Forecast, by Application 2019 & 2032
- Table 9: Global 4K Display Resolution Industry Revenue Million Forecast, by Country 2019 & 2032
- Table 10: 4K Display Resolution Industry Revenue (Million) Forecast, by Application 2019 & 2032
- Table 11: Global 4K Display Resolution Industry Revenue Million Forecast, by Country 2019 & 2032
- Table 12: 4K Display Resolution Industry Revenue (Million) Forecast, by Application 2019 & 2032
- Table 13: Global 4K Display Resolution Industry Revenue Million Forecast, by Product Type 2019 & 2032
- Table 14: Global 4K Display Resolution Industry Revenue Million Forecast, by End-user Vertical 2019 & 2032
- Table 15: Global 4K Display Resolution Industry Revenue Million Forecast, by Country 2019 & 2032
- Table 16: Global 4K Display Resolution Industry Revenue Million Forecast, by Product Type 2019 & 2032
- Table 17: Global 4K Display Resolution Industry Revenue Million Forecast, by End-user Vertical 2019 & 2032
- Table 18: Global 4K Display Resolution Industry Revenue Million Forecast, by Country 2019 & 2032
- Table 19: Global 4K Display Resolution Industry Revenue Million Forecast, by Product Type 2019 & 2032
- Table 20: Global 4K Display Resolution Industry Revenue Million Forecast, by End-user Vertical 2019 & 2032
- Table 21: Global 4K Display Resolution Industry Revenue Million Forecast, by Country 2019 & 2032
- Table 22: Global 4K Display Resolution Industry Revenue Million Forecast, by Product Type 2019 & 2032
- Table 23: Global 4K Display Resolution Industry Revenue Million Forecast, by End-user Vertical 2019 & 2032
- Table 24: Global 4K Display Resolution Industry Revenue Million Forecast, by Country 2019 & 2032
Frequently Asked Questions
1. What is the projected Compound Annual Growth Rate (CAGR) of the 4K Display Resolution Industry?
The projected CAGR is approximately 23.10%.
2. Which companies are prominent players in the 4K Display Resolution Industry?
Key companies in the market include LG Display Co Ltd, Hisense Group, BOE Technology Group, Toshiba Corporation, Haier Group Corporation, Samsung Electronics Co Ltd, AU Optronics*List Not Exhaustive, Innolux Corporation, Koninklijke Philips NV, Sharp Corporation, Panasonic Corporation, Sony Corporation.
3. What are the main segments of the 4K Display Resolution Industry?
The market segments include Product Type, End-user Vertical.
4. Can you provide details about the market size?
The market size is estimated to be USD XX Million as of 2022.
5. What are some drivers contributing to market growth?
Demand for High-resolution Display Products; Affordable Manufacturing of 4K Display Products.
6. What are the notable trends driving market growth?
Entertainment and Media Segment to Hold Major Share.
7. Are there any restraints impacting market growth?
The Need for High Investment in Content Creation and Broadcasting; Bandwidth Allocation for 4K Resolution.
8. Can you provide examples of recent developments in the market?
November 2022: LG introduced its first 27-inch, 4K surgical monitor with mini-LED technology at MEDICA 2022 (the international tradeshow for the medical sector in Düsseldorf, Germany). According to the company, the 4K mini-LED surgical monitor boasts exceptional picture quality courtesy of the company's mini-LED technology, which provides clear, precise images.
9. What pricing options are available for accessing the report?
Pricing options include single-user, multi-user, and enterprise licenses priced at USD 4750, USD 5250, and USD 8750 respectively.
10. Is the market size provided in terms of value or volume?
The market size is provided in terms of value, measured in Million.
11. Are there any specific market keywords associated with the report?
Yes, the market keyword associated with the report is "4K Display Resolution Industry," which aids in identifying and referencing the specific market segment covered.
12. How do I determine which pricing option suits my needs best?
The pricing options vary based on user requirements and access needs. Individual users may opt for single-user licenses, while businesses requiring broader access may choose multi-user or enterprise licenses for cost-effective access to the report.
13. Are there any additional resources or data provided in the 4K Display Resolution Industry report?
While the report offers comprehensive insights, it's advisable to review the specific contents or supplementary materials provided to ascertain if additional resources or data are available.
14. How can I stay updated on further developments or reports in the 4K Display Resolution Industry?
To stay informed about further developments, trends, and reports in the 4K Display Resolution Industry, consider subscribing to industry newsletters, following relevant companies and organizations, or regularly checking reputable industry news sources and publications.
Methodology
Step 1 - Identification of Relevant Samples Size from Population Database


Step 2 - Approaches for Defining Global Market Size (Value, Volume* & Price*)

Note*: In applicable scenarios
Step 3 - Data Sources
Primary Research
- Web Analytics
- Survey Reports
- Research Institute
- Latest Research Reports
- Opinion Leaders
Secondary Research
- Annual Reports
- White Paper
- Latest Press Release
- Industry Association
- Paid Database
- Investor Presentations

Step 4 - Data Triangulation
Involves using different sources of information in order to increase the validity of a study
These sources are likely to be stakeholders in a program - participants, other researchers, program staff, other community members, and so on.
Then we put all data in single framework & apply various statistical tools to find out the dynamic on the market.
During the analysis stage, feedback from the stakeholder groups would be compared to determine areas of agreement as well as areas of divergence


