
Key Insights
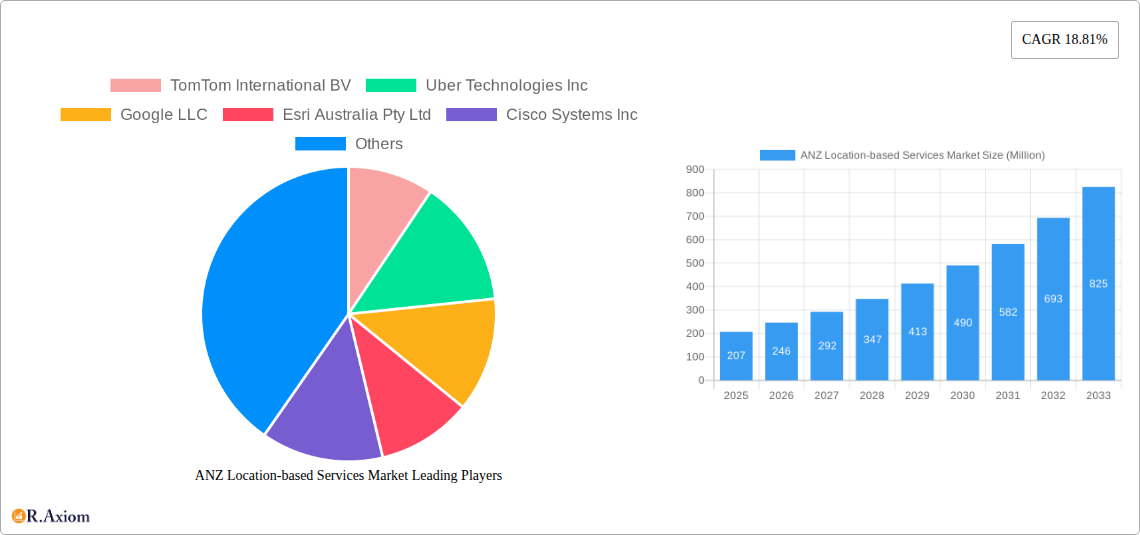
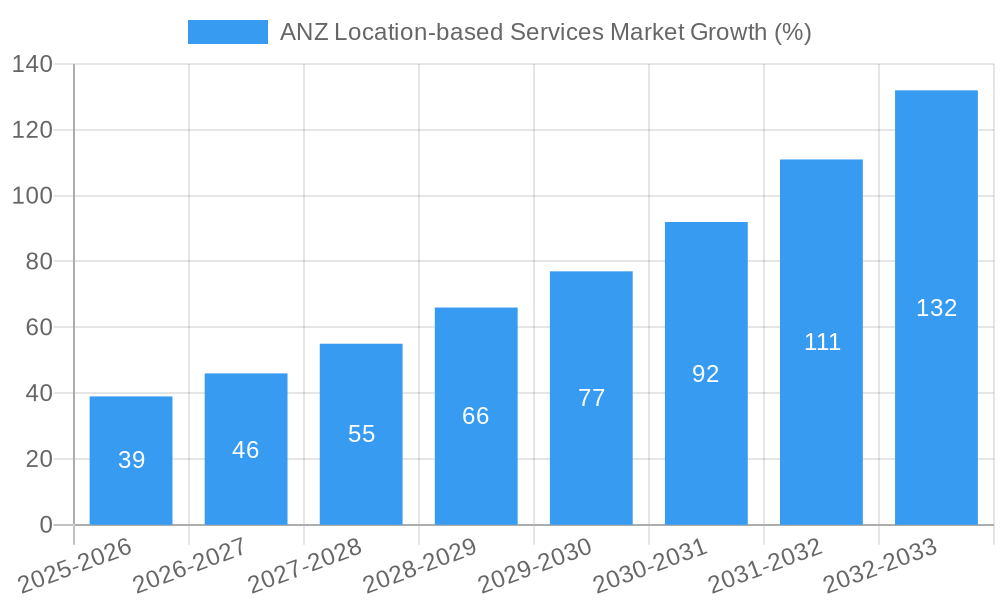
The ANZ (Australia and New Zealand) location-based services (LBS) market is experiencing robust growth, driven by the increasing adoption of smartphones, the expansion of high-speed internet access, and the rising demand for location-aware applications across various sectors. The market, valued at approximately $207 million in 2025 (assuming a global market size of $2.07 billion and a reasonable ANZ market share), is projected to grow at a Compound Annual Growth Rate (CAGR) of 18.81% from 2025 to 2033. This growth is fueled by several key factors. The transportation and logistics sector is a major driver, with companies leveraging LBS for fleet management, navigation, and delivery optimization. The retail and consumer goods sector is also a significant contributor, utilizing LBS for targeted advertising, customer loyalty programs, and enhancing the overall customer experience through location-based promotions. Furthermore, the manufacturing and healthcare sectors are increasingly adopting LBS for asset tracking, workforce management, and improving operational efficiency. The preference for professional services over managed services, and a strong growth in outdoor LBS applications compared to indoor LBS, further shape the market landscape.
The growth of the ANZ LBS market is also significantly impacted by technological advancements such as the improved accuracy of GPS technology, the rise of IoT (Internet of Things) devices, and the increasing sophistication of mapping and location analytics. However, challenges such as data privacy concerns, the cost of implementation, and the need for robust infrastructure to support the widespread adoption of LBS remain. To overcome these challenges, companies are investing in innovative solutions, focusing on data security and user privacy while enhancing the accuracy and reliability of location data. As the demand for seamless, personalized location-based services continues to grow, the ANZ market is poised for substantial expansion in the coming years, with opportunities for both established players and new entrants.
ANZ Location-based Services Market: A Comprehensive Report (2019-2033)
This comprehensive report provides an in-depth analysis of the Australia and New Zealand (ANZ) location-based services (LBS) market, covering the period from 2019 to 2033. It offers actionable insights for industry stakeholders, investors, and businesses seeking to understand and capitalize on the growth opportunities within this dynamic sector. The report leverages rigorous data analysis and expert insights to deliver a detailed overview of market trends, competitive landscapes, and future projections. Key segments analyzed include indoor and outdoor location services, professional and managed service types, and applications across various end-user industries. The market is valued at xx Million in 2025 and is projected to experience significant growth during the forecast period (2025-2033).
ANZ Location-based Services Market Market Concentration & Innovation
The ANZ LBS market exhibits a moderately concentrated structure, with a few dominant players and a larger number of smaller, specialized firms. Key players like TomTom International BV, Uber Technologies Inc, Google LLC, Esri Australia Pty Ltd, Cisco Systems Inc, Microsoft Corporation, Huawei Technologies Co Ltd, HERE Technologies (HERE Global B V), Apple Inc, and GapMaps Pty Ltd hold significant market share. However, the market is also characterized by continuous innovation, driven by advancements in technologies such as 5G, IoT, AI, and cloud computing.
- Market Share: The top 5 players account for approximately xx% of the market share in 2025.
- M&A Activity: The past five years have witnessed a moderate level of M&A activity, with deal values averaging approximately xx Million per transaction. These activities often involve smaller companies being acquired by larger players to expand their product portfolios and market reach.
- Regulatory Framework: Government regulations concerning data privacy, security, and mapping are significant factors influencing market dynamics. The recent integration of the National Positioning Infrastructure Capability (NPIC) in Australia underscores the government's commitment to fostering growth in the sector.
- Product Substitutes: While there aren't direct substitutes for core LBS functions, alternative technologies like RFID and Bluetooth beacons present indirect competition in specific niche applications.
- End-User Trends: The increasing demand for personalized location-based services, real-time location tracking, and improved navigation solutions fuels market growth.
ANZ Location-based Services Market Industry Trends & Insights
The ANZ LBS market is experiencing robust growth, driven by several key factors. The rising adoption of smartphones and connected devices fuels the demand for location-based applications and services. Furthermore, the increasing penetration of high-speed internet access and the development of advanced technologies such as AI and machine learning are enabling more sophisticated and accurate location services. The focus on improving efficiency across various industries, including logistics and transportation, further drives adoption. Consumer preferences are shifting towards personalized, seamless, and integrated location experiences, pushing businesses to invest in advanced LBS solutions. The market exhibits a significant competitive landscape, with both established players and new entrants vying for market share through continuous product innovation and strategic partnerships.
- Market Growth Drivers: Increased smartphone penetration, advancements in location technologies, and growing demand for location-based applications across various industries.
- Technological Disruptions: The emergence of 5G technology, IoT devices, AI, and machine learning is revolutionizing the accuracy, efficiency, and capabilities of location-based services.
- Consumer Preferences: Consumers increasingly expect personalized, reliable, and integrated location-based experiences in diverse aspects of their lives.
- Competitive Dynamics: The market is characterized by intense competition, with established players and startups actively engaging in innovation and market expansion strategies.
- CAGR: The ANZ LBS market is projected to witness a CAGR of xx% during the forecast period (2025-2033).
- Market Penetration: Market penetration is expected to reach xx% by 2033.
Dominant Markets & Segments in ANZ Location-based Services Market
The outdoor location services segment dominates the ANZ LBS market, accounting for a significant majority of the overall market share. This is driven by the broad applicability of outdoor location services across various industries and consumer applications. Within service types, the managed services segment holds a larger share than professional services due to the cost-effectiveness and ease of implementation offered by managed services.
- By Location:
- Outdoor: Dominated by navigation, mapping, and location-based advertising. Key drivers include widespread smartphone adoption and the growth of the transportation and logistics sector.
- Indoor: Growing steadily, driven by the adoption of indoor navigation systems in shopping malls, airports, and hospitals.
- By Service Type:
- Managed Services: High demand due to cost-effectiveness and scalability; ideal for businesses with limited internal resources.
- Professional Services: Niche applications requiring specialized expertise and custom solutions.
- By End-user Industry:
- Transportation and Logistics: The largest segment due to the critical role of LBS in fleet management, navigation, and delivery optimization. Significant investments in logistics infrastructure and the need for increased efficiency further boost this segment.
- Retail and Consumer Goods: Growing rapidly due to the increasing adoption of location-based marketing and targeted advertising.
- Other End-user Industries: Healthcare, manufacturing, and others show steady growth based on their specific LBS needs. In healthcare, patient tracking and emergency response services are key drivers. Manufacturing utilizes LBS for asset tracking and supply chain optimization.
ANZ Location-based Services Market Product Developments
Recent product innovations in the ANZ LBS market focus on enhancing accuracy, integrating multiple data sources, and incorporating AI/ML capabilities. New applications include enhanced indoor navigation systems, hyperlocal advertising solutions, and advanced real-time tracking features for various industries. These developments emphasize improved user experiences, efficient data utilization, and enhanced security features. The market's competitive advantage rests on offering superior accuracy, reliable performance, and seamless integration with existing systems.
Report Scope & Segmentation Analysis
This report segments the ANZ LBS market across various parameters:
- By Location: Indoor and Outdoor, with growth projections and market size for each. Outdoor currently dominates due to higher penetration. Indoor is showing considerable potential for future growth.
- By Service Type: Professional and Managed, each featuring detailed competitive analyses. The managed services segment is expected to maintain higher growth rates.
- By End-user Industry: Transportation and Logistics, Manufacturing, Retail and Consumer Goods, Automotive, Healthcare, and Other End-user Industries, with a detailed assessment of each industry’s LBS needs and adoption rates. Transportation and Logistics are currently the largest, followed by Retail and Consumer Goods.
Key Drivers of ANZ Location-based Services Market Growth
Several factors contribute to the market's growth: the rising adoption of smartphones and connected devices, advancements in positioning technologies (like the SouthPAN project in New Zealand), the growth of the e-commerce sector demanding optimized delivery systems, increasing urbanization leading to the need for improved navigation and urban planning, and government initiatives promoting digitalization and data infrastructure development (like the NPIC in Australia). These factors collectively create a strong foundation for continued market expansion.
Challenges in the ANZ Location-based Services Market Sector
The ANZ LBS market faces challenges including data privacy concerns requiring robust security measures, the need for accurate and updated map data across diverse terrains, and competition from established tech giants. The complexity of integrating various LBS technologies across different platforms also poses a hurdle, impacting deployment speed and efficiency. The high initial investment needed for advanced LBS technologies represents another barrier to entry for some players.
Emerging Opportunities in ANZ Location-based Services Market
Emerging opportunities include the expansion of indoor LBS solutions within various sectors, the integration of LBS with AR/VR technologies to enhance user experiences, and the development of hyperlocal advertising solutions targeting specific demographics and locations. Growing demand for real-time location tracking in various industries, coupled with increased adoption of 5G network infrastructure, opens further market expansion possibilities. The growth in IoT and smart city initiatives also presents significant opportunities.
Leading Players in the ANZ Location-based Services Market Market
- TomTom International BV
- Uber Technologies Inc
- Google LLC
- Esri Australia Pty Ltd
- Cisco Systems Inc
- Microsoft Corporation
- Huawei Technologies Co Ltd
- HERE Technologies (HERE Global B V)
- Apple Inc
- GapMaps Pty Ltd
Key Developments in ANZ Location-based Services Market Industry
- March 2023: The SouthPAN project in Southland significantly enhanced New Zealand's GPS infrastructure, improving accuracy from meters to centimeters. This has wide-ranging benefits across various sectors, especially agriculture, emergency services, and maritime.
- September 2023: Geoscience Australia launched the NPIC, providing easier access to reliable positioning data and services for government, business, and academia. This improves data availability and accelerates innovation across different sectors.
Strategic Outlook for ANZ Location-based Services Market Market
The ANZ LBS market is poised for continued growth, driven by technological advancements, increasing smartphone penetration, and expanding demand across multiple sectors. Future opportunities lie in the integration of AI/ML, IoT, and 5G, creating highly accurate, personalized, and seamlessly integrated location-based solutions. The focus will remain on enhancing data security, improving map accuracy, and developing innovative applications tailored to specific industry needs. The market is expected to witness significant growth driven by consumer demands and innovative technological advancements.
ANZ Location-based Services Market Segmentation
-
1. Location
- 1.1. Indoor
- 1.2. Outdoor
-
2. Service Type
- 2.1. Professional
- 2.2. Managed
-
3. End-user Industry
- 3.1. Transportation and Logistics
- 3.2. Manufacturing
- 3.3. Retail and Consumer Goods
- 3.4. Automotive
- 3.5. Healthcare
- 3.6. Other End-user Industries
ANZ Location-based Services Market Segmentation By Geography
-
1. North America
- 1.1. United States
- 1.2. Canada
- 1.3. Mexico
-
2. South America
- 2.1. Brazil
- 2.2. Argentina
- 2.3. Rest of South America
-
3. Europe
- 3.1. United Kingdom
- 3.2. Germany
- 3.3. France
- 3.4. Italy
- 3.5. Spain
- 3.6. Russia
- 3.7. Benelux
- 3.8. Nordics
- 3.9. Rest of Europe
-
4. Middle East & Africa
- 4.1. Turkey
- 4.2. Israel
- 4.3. GCC
- 4.4. North Africa
- 4.5. South Africa
- 4.6. Rest of Middle East & Africa
-
5. Asia Pacific
- 5.1. China
- 5.2. India
- 5.3. Japan
- 5.4. South Korea
- 5.5. ASEAN
- 5.6. Oceania
- 5.7. Rest of Asia Pacific
ANZ Location-based Services Market REPORT HIGHLIGHTS
| Aspects | Details |
|---|---|
| Study Period | 2019-2033 |
| Base Year | 2024 |
| Estimated Year | 2025 |
| Forecast Period | 2025-2033 |
| Historical Period | 2019-2024 |
| Growth Rate | CAGR of 18.81% from 2019-2033 |
| Segmentation |
|
Table of Contents
- 1. Introduction
- 1.1. Research Scope
- 1.2. Market Segmentation
- 1.3. Research Methodology
- 1.4. Definitions and Assumptions
- 2. Executive Summary
- 2.1. Introduction
- 3. Market Dynamics
- 3.1. Introduction
- 3.2. Market Drivers
- 3.2.1. Growing Focus on Positioning Technologies; Rapid Increase in Internet Penetration
- 3.3. Market Restrains
- 3.3.1. Concerns about Data Privacy and Security; Limited Access to high-speed internet in Some Regions
- 3.4. Market Trends
- 3.4.1. Rapid Increase in Internet Penetration to Drive the Market Growth
- 4. Market Factor Analysis
- 4.1. Porters Five Forces
- 4.2. Supply/Value Chain
- 4.3. PESTEL analysis
- 4.4. Market Entropy
- 4.5. Patent/Trademark Analysis
- 5. Global ANZ Location-based Services Market Analysis, Insights and Forecast, 2019-2031
- 5.1. Market Analysis, Insights and Forecast - by Location
- 5.1.1. Indoor
- 5.1.2. Outdoor
- 5.2. Market Analysis, Insights and Forecast - by Service Type
- 5.2.1. Professional
- 5.2.2. Managed
- 5.3. Market Analysis, Insights and Forecast - by End-user Industry
- 5.3.1. Transportation and Logistics
- 5.3.2. Manufacturing
- 5.3.3. Retail and Consumer Goods
- 5.3.4. Automotive
- 5.3.5. Healthcare
- 5.3.6. Other End-user Industries
- 5.4. Market Analysis, Insights and Forecast - by Region
- 5.4.1. North America
- 5.4.2. South America
- 5.4.3. Europe
- 5.4.4. Middle East & Africa
- 5.4.5. Asia Pacific
- 5.1. Market Analysis, Insights and Forecast - by Location
- 6. North America ANZ Location-based Services Market Analysis, Insights and Forecast, 2019-2031
- 6.1. Market Analysis, Insights and Forecast - by Location
- 6.1.1. Indoor
- 6.1.2. Outdoor
- 6.2. Market Analysis, Insights and Forecast - by Service Type
- 6.2.1. Professional
- 6.2.2. Managed
- 6.3. Market Analysis, Insights and Forecast - by End-user Industry
- 6.3.1. Transportation and Logistics
- 6.3.2. Manufacturing
- 6.3.3. Retail and Consumer Goods
- 6.3.4. Automotive
- 6.3.5. Healthcare
- 6.3.6. Other End-user Industries
- 6.1. Market Analysis, Insights and Forecast - by Location
- 7. South America ANZ Location-based Services Market Analysis, Insights and Forecast, 2019-2031
- 7.1. Market Analysis, Insights and Forecast - by Location
- 7.1.1. Indoor
- 7.1.2. Outdoor
- 7.2. Market Analysis, Insights and Forecast - by Service Type
- 7.2.1. Professional
- 7.2.2. Managed
- 7.3. Market Analysis, Insights and Forecast - by End-user Industry
- 7.3.1. Transportation and Logistics
- 7.3.2. Manufacturing
- 7.3.3. Retail and Consumer Goods
- 7.3.4. Automotive
- 7.3.5. Healthcare
- 7.3.6. Other End-user Industries
- 7.1. Market Analysis, Insights and Forecast - by Location
- 8. Europe ANZ Location-based Services Market Analysis, Insights and Forecast, 2019-2031
- 8.1. Market Analysis, Insights and Forecast - by Location
- 8.1.1. Indoor
- 8.1.2. Outdoor
- 8.2. Market Analysis, Insights and Forecast - by Service Type
- 8.2.1. Professional
- 8.2.2. Managed
- 8.3. Market Analysis, Insights and Forecast - by End-user Industry
- 8.3.1. Transportation and Logistics
- 8.3.2. Manufacturing
- 8.3.3. Retail and Consumer Goods
- 8.3.4. Automotive
- 8.3.5. Healthcare
- 8.3.6. Other End-user Industries
- 8.1. Market Analysis, Insights and Forecast - by Location
- 9. Middle East & Africa ANZ Location-based Services Market Analysis, Insights and Forecast, 2019-2031
- 9.1. Market Analysis, Insights and Forecast - by Location
- 9.1.1. Indoor
- 9.1.2. Outdoor
- 9.2. Market Analysis, Insights and Forecast - by Service Type
- 9.2.1. Professional
- 9.2.2. Managed
- 9.3. Market Analysis, Insights and Forecast - by End-user Industry
- 9.3.1. Transportation and Logistics
- 9.3.2. Manufacturing
- 9.3.3. Retail and Consumer Goods
- 9.3.4. Automotive
- 9.3.5. Healthcare
- 9.3.6. Other End-user Industries
- 9.1. Market Analysis, Insights and Forecast - by Location
- 10. Asia Pacific ANZ Location-based Services Market Analysis, Insights and Forecast, 2019-2031
- 10.1. Market Analysis, Insights and Forecast - by Location
- 10.1.1. Indoor
- 10.1.2. Outdoor
- 10.2. Market Analysis, Insights and Forecast - by Service Type
- 10.2.1. Professional
- 10.2.2. Managed
- 10.3. Market Analysis, Insights and Forecast - by End-user Industry
- 10.3.1. Transportation and Logistics
- 10.3.2. Manufacturing
- 10.3.3. Retail and Consumer Goods
- 10.3.4. Automotive
- 10.3.5. Healthcare
- 10.3.6. Other End-user Industries
- 10.1. Market Analysis, Insights and Forecast - by Location
- 11. North America ANZ Location-based Services Market Analysis, Insights and Forecast, 2019-2031
- 11.1. Market Analysis, Insights and Forecast - By Country/Sub-region
- 11.1.1 United States
- 11.1.2 Canada
- 12. Europe ANZ Location-based Services Market Analysis, Insights and Forecast, 2019-2031
- 12.1. Market Analysis, Insights and Forecast - By Country/Sub-region
- 12.1.1 United Kingdom
- 12.1.2 Germany
- 12.1.3 France
- 12.1.4 Spain
- 12.1.5 Italy
- 12.1.6 Netherlands
- 12.1.7 Poland
- 12.1.8 Rest of Europe
- 13. Asia Pacific ANZ Location-based Services Market Analysis, Insights and Forecast, 2019-2031
- 13.1. Market Analysis, Insights and Forecast - By Country/Sub-region
- 13.1.1 China
- 13.1.2 Japan
- 13.1.3 South Korea
- 13.1.4 India
- 13.1.5 Rest of Asia Pacific
- 14. Latin America ANZ Location-based Services Market Analysis, Insights and Forecast, 2019-2031
- 14.1. Market Analysis, Insights and Forecast - By Country/Sub-region
- 14.1.1.
- 15. Middle East and Africa ANZ Location-based Services Market Analysis, Insights and Forecast, 2019-2031
- 15.1. Market Analysis, Insights and Forecast - By Country/Sub-region
- 15.1.1.
- 16. Competitive Analysis
- 16.1. Global Market Share Analysis 2024
- 16.2. Company Profiles
- 16.2.1 TomTom International BV
- 16.2.1.1. Overview
- 16.2.1.2. Products
- 16.2.1.3. SWOT Analysis
- 16.2.1.4. Recent Developments
- 16.2.1.5. Financials (Based on Availability)
- 16.2.2 Uber Technologies Inc
- 16.2.2.1. Overview
- 16.2.2.2. Products
- 16.2.2.3. SWOT Analysis
- 16.2.2.4. Recent Developments
- 16.2.2.5. Financials (Based on Availability)
- 16.2.3 Google LLC
- 16.2.3.1. Overview
- 16.2.3.2. Products
- 16.2.3.3. SWOT Analysis
- 16.2.3.4. Recent Developments
- 16.2.3.5. Financials (Based on Availability)
- 16.2.4 Esri Australia Pty Ltd
- 16.2.4.1. Overview
- 16.2.4.2. Products
- 16.2.4.3. SWOT Analysis
- 16.2.4.4. Recent Developments
- 16.2.4.5. Financials (Based on Availability)
- 16.2.5 Cisco Systems Inc
- 16.2.5.1. Overview
- 16.2.5.2. Products
- 16.2.5.3. SWOT Analysis
- 16.2.5.4. Recent Developments
- 16.2.5.5. Financials (Based on Availability)
- 16.2.6 Microsoft Corporation
- 16.2.6.1. Overview
- 16.2.6.2. Products
- 16.2.6.3. SWOT Analysis
- 16.2.6.4. Recent Developments
- 16.2.6.5. Financials (Based on Availability)
- 16.2.7 Huawei Technologies Co Ltd
- 16.2.7.1. Overview
- 16.2.7.2. Products
- 16.2.7.3. SWOT Analysis
- 16.2.7.4. Recent Developments
- 16.2.7.5. Financials (Based on Availability)
- 16.2.8 HERE Technologies (HERE Global B V)
- 16.2.8.1. Overview
- 16.2.8.2. Products
- 16.2.8.3. SWOT Analysis
- 16.2.8.4. Recent Developments
- 16.2.8.5. Financials (Based on Availability)
- 16.2.9 Apple Inc
- 16.2.9.1. Overview
- 16.2.9.2. Products
- 16.2.9.3. SWOT Analysis
- 16.2.9.4. Recent Developments
- 16.2.9.5. Financials (Based on Availability)
- 16.2.10 GapMaps Pty Ltd
- 16.2.10.1. Overview
- 16.2.10.2. Products
- 16.2.10.3. SWOT Analysis
- 16.2.10.4. Recent Developments
- 16.2.10.5. Financials (Based on Availability)
- 16.2.1 TomTom International BV
List of Figures
- Figure 1: Global ANZ Location-based Services Market Revenue Breakdown (Million, %) by Region 2024 & 2032
- Figure 2: North America ANZ Location-based Services Market Revenue (Million), by Country 2024 & 2032
- Figure 3: North America ANZ Location-based Services Market Revenue Share (%), by Country 2024 & 2032
- Figure 4: Europe ANZ Location-based Services Market Revenue (Million), by Country 2024 & 2032
- Figure 5: Europe ANZ Location-based Services Market Revenue Share (%), by Country 2024 & 2032
- Figure 6: Asia Pacific ANZ Location-based Services Market Revenue (Million), by Country 2024 & 2032
- Figure 7: Asia Pacific ANZ Location-based Services Market Revenue Share (%), by Country 2024 & 2032
- Figure 8: Latin America ANZ Location-based Services Market Revenue (Million), by Country 2024 & 2032
- Figure 9: Latin America ANZ Location-based Services Market Revenue Share (%), by Country 2024 & 2032
- Figure 10: Middle East and Africa ANZ Location-based Services Market Revenue (Million), by Country 2024 & 2032
- Figure 11: Middle East and Africa ANZ Location-based Services Market Revenue Share (%), by Country 2024 & 2032
- Figure 12: North America ANZ Location-based Services Market Revenue (Million), by Location 2024 & 2032
- Figure 13: North America ANZ Location-based Services Market Revenue Share (%), by Location 2024 & 2032
- Figure 14: North America ANZ Location-based Services Market Revenue (Million), by Service Type 2024 & 2032
- Figure 15: North America ANZ Location-based Services Market Revenue Share (%), by Service Type 2024 & 2032
- Figure 16: North America ANZ Location-based Services Market Revenue (Million), by End-user Industry 2024 & 2032
- Figure 17: North America ANZ Location-based Services Market Revenue Share (%), by End-user Industry 2024 & 2032
- Figure 18: North America ANZ Location-based Services Market Revenue (Million), by Country 2024 & 2032
- Figure 19: North America ANZ Location-based Services Market Revenue Share (%), by Country 2024 & 2032
- Figure 20: South America ANZ Location-based Services Market Revenue (Million), by Location 2024 & 2032
- Figure 21: South America ANZ Location-based Services Market Revenue Share (%), by Location 2024 & 2032
- Figure 22: South America ANZ Location-based Services Market Revenue (Million), by Service Type 2024 & 2032
- Figure 23: South America ANZ Location-based Services Market Revenue Share (%), by Service Type 2024 & 2032
- Figure 24: South America ANZ Location-based Services Market Revenue (Million), by End-user Industry 2024 & 2032
- Figure 25: South America ANZ Location-based Services Market Revenue Share (%), by End-user Industry 2024 & 2032
- Figure 26: South America ANZ Location-based Services Market Revenue (Million), by Country 2024 & 2032
- Figure 27: South America ANZ Location-based Services Market Revenue Share (%), by Country 2024 & 2032
- Figure 28: Europe ANZ Location-based Services Market Revenue (Million), by Location 2024 & 2032
- Figure 29: Europe ANZ Location-based Services Market Revenue Share (%), by Location 2024 & 2032
- Figure 30: Europe ANZ Location-based Services Market Revenue (Million), by Service Type 2024 & 2032
- Figure 31: Europe ANZ Location-based Services Market Revenue Share (%), by Service Type 2024 & 2032
- Figure 32: Europe ANZ Location-based Services Market Revenue (Million), by End-user Industry 2024 & 2032
- Figure 33: Europe ANZ Location-based Services Market Revenue Share (%), by End-user Industry 2024 & 2032
- Figure 34: Europe ANZ Location-based Services Market Revenue (Million), by Country 2024 & 2032
- Figure 35: Europe ANZ Location-based Services Market Revenue Share (%), by Country 2024 & 2032
- Figure 36: Middle East & Africa ANZ Location-based Services Market Revenue (Million), by Location 2024 & 2032
- Figure 37: Middle East & Africa ANZ Location-based Services Market Revenue Share (%), by Location 2024 & 2032
- Figure 38: Middle East & Africa ANZ Location-based Services Market Revenue (Million), by Service Type 2024 & 2032
- Figure 39: Middle East & Africa ANZ Location-based Services Market Revenue Share (%), by Service Type 2024 & 2032
- Figure 40: Middle East & Africa ANZ Location-based Services Market Revenue (Million), by End-user Industry 2024 & 2032
- Figure 41: Middle East & Africa ANZ Location-based Services Market Revenue Share (%), by End-user Industry 2024 & 2032
- Figure 42: Middle East & Africa ANZ Location-based Services Market Revenue (Million), by Country 2024 & 2032
- Figure 43: Middle East & Africa ANZ Location-based Services Market Revenue Share (%), by Country 2024 & 2032
- Figure 44: Asia Pacific ANZ Location-based Services Market Revenue (Million), by Location 2024 & 2032
- Figure 45: Asia Pacific ANZ Location-based Services Market Revenue Share (%), by Location 2024 & 2032
- Figure 46: Asia Pacific ANZ Location-based Services Market Revenue (Million), by Service Type 2024 & 2032
- Figure 47: Asia Pacific ANZ Location-based Services Market Revenue Share (%), by Service Type 2024 & 2032
- Figure 48: Asia Pacific ANZ Location-based Services Market Revenue (Million), by End-user Industry 2024 & 2032
- Figure 49: Asia Pacific ANZ Location-based Services Market Revenue Share (%), by End-user Industry 2024 & 2032
- Figure 50: Asia Pacific ANZ Location-based Services Market Revenue (Million), by Country 2024 & 2032
- Figure 51: Asia Pacific ANZ Location-based Services Market Revenue Share (%), by Country 2024 & 2032
List of Tables
- Table 1: Global ANZ Location-based Services Market Revenue Million Forecast, by Region 2019 & 2032
- Table 2: Global ANZ Location-based Services Market Revenue Million Forecast, by Location 2019 & 2032
- Table 3: Global ANZ Location-based Services Market Revenue Million Forecast, by Service Type 2019 & 2032
- Table 4: Global ANZ Location-based Services Market Revenue Million Forecast, by End-user Industry 2019 & 2032
- Table 5: Global ANZ Location-based Services Market Revenue Million Forecast, by Region 2019 & 2032
- Table 6: Global ANZ Location-based Services Market Revenue Million Forecast, by Country 2019 & 2032
- Table 7: United States ANZ Location-based Services Market Revenue (Million) Forecast, by Application 2019 & 2032
- Table 8: Canada ANZ Location-based Services Market Revenue (Million) Forecast, by Application 2019 & 2032
- Table 9: Global ANZ Location-based Services Market Revenue Million Forecast, by Country 2019 & 2032
- Table 10: United Kingdom ANZ Location-based Services Market Revenue (Million) Forecast, by Application 2019 & 2032
- Table 11: Germany ANZ Location-based Services Market Revenue (Million) Forecast, by Application 2019 & 2032
- Table 12: France ANZ Location-based Services Market Revenue (Million) Forecast, by Application 2019 & 2032
- Table 13: Spain ANZ Location-based Services Market Revenue (Million) Forecast, by Application 2019 & 2032
- Table 14: Italy ANZ Location-based Services Market Revenue (Million) Forecast, by Application 2019 & 2032
- Table 15: Netherlands ANZ Location-based Services Market Revenue (Million) Forecast, by Application 2019 & 2032
- Table 16: Poland ANZ Location-based Services Market Revenue (Million) Forecast, by Application 2019 & 2032
- Table 17: Rest of Europe ANZ Location-based Services Market Revenue (Million) Forecast, by Application 2019 & 2032
- Table 18: Global ANZ Location-based Services Market Revenue Million Forecast, by Country 2019 & 2032
- Table 19: China ANZ Location-based Services Market Revenue (Million) Forecast, by Application 2019 & 2032
- Table 20: Japan ANZ Location-based Services Market Revenue (Million) Forecast, by Application 2019 & 2032
- Table 21: South Korea ANZ Location-based Services Market Revenue (Million) Forecast, by Application 2019 & 2032
- Table 22: India ANZ Location-based Services Market Revenue (Million) Forecast, by Application 2019 & 2032
- Table 23: Rest of Asia Pacific ANZ Location-based Services Market Revenue (Million) Forecast, by Application 2019 & 2032
- Table 24: Global ANZ Location-based Services Market Revenue Million Forecast, by Country 2019 & 2032
- Table 25: ANZ Location-based Services Market Revenue (Million) Forecast, by Application 2019 & 2032
- Table 26: Global ANZ Location-based Services Market Revenue Million Forecast, by Country 2019 & 2032
- Table 27: ANZ Location-based Services Market Revenue (Million) Forecast, by Application 2019 & 2032
- Table 28: Global ANZ Location-based Services Market Revenue Million Forecast, by Location 2019 & 2032
- Table 29: Global ANZ Location-based Services Market Revenue Million Forecast, by Service Type 2019 & 2032
- Table 30: Global ANZ Location-based Services Market Revenue Million Forecast, by End-user Industry 2019 & 2032
- Table 31: Global ANZ Location-based Services Market Revenue Million Forecast, by Country 2019 & 2032
- Table 32: United States ANZ Location-based Services Market Revenue (Million) Forecast, by Application 2019 & 2032
- Table 33: Canada ANZ Location-based Services Market Revenue (Million) Forecast, by Application 2019 & 2032
- Table 34: Mexico ANZ Location-based Services Market Revenue (Million) Forecast, by Application 2019 & 2032
- Table 35: Global ANZ Location-based Services Market Revenue Million Forecast, by Location 2019 & 2032
- Table 36: Global ANZ Location-based Services Market Revenue Million Forecast, by Service Type 2019 & 2032
- Table 37: Global ANZ Location-based Services Market Revenue Million Forecast, by End-user Industry 2019 & 2032
- Table 38: Global ANZ Location-based Services Market Revenue Million Forecast, by Country 2019 & 2032
- Table 39: Brazil ANZ Location-based Services Market Revenue (Million) Forecast, by Application 2019 & 2032
- Table 40: Argentina ANZ Location-based Services Market Revenue (Million) Forecast, by Application 2019 & 2032
- Table 41: Rest of South America ANZ Location-based Services Market Revenue (Million) Forecast, by Application 2019 & 2032
- Table 42: Global ANZ Location-based Services Market Revenue Million Forecast, by Location 2019 & 2032
- Table 43: Global ANZ Location-based Services Market Revenue Million Forecast, by Service Type 2019 & 2032
- Table 44: Global ANZ Location-based Services Market Revenue Million Forecast, by End-user Industry 2019 & 2032
- Table 45: Global ANZ Location-based Services Market Revenue Million Forecast, by Country 2019 & 2032
- Table 46: United Kingdom ANZ Location-based Services Market Revenue (Million) Forecast, by Application 2019 & 2032
- Table 47: Germany ANZ Location-based Services Market Revenue (Million) Forecast, by Application 2019 & 2032
- Table 48: France ANZ Location-based Services Market Revenue (Million) Forecast, by Application 2019 & 2032
- Table 49: Italy ANZ Location-based Services Market Revenue (Million) Forecast, by Application 2019 & 2032
- Table 50: Spain ANZ Location-based Services Market Revenue (Million) Forecast, by Application 2019 & 2032
- Table 51: Russia ANZ Location-based Services Market Revenue (Million) Forecast, by Application 2019 & 2032
- Table 52: Benelux ANZ Location-based Services Market Revenue (Million) Forecast, by Application 2019 & 2032
- Table 53: Nordics ANZ Location-based Services Market Revenue (Million) Forecast, by Application 2019 & 2032
- Table 54: Rest of Europe ANZ Location-based Services Market Revenue (Million) Forecast, by Application 2019 & 2032
- Table 55: Global ANZ Location-based Services Market Revenue Million Forecast, by Location 2019 & 2032
- Table 56: Global ANZ Location-based Services Market Revenue Million Forecast, by Service Type 2019 & 2032
- Table 57: Global ANZ Location-based Services Market Revenue Million Forecast, by End-user Industry 2019 & 2032
- Table 58: Global ANZ Location-based Services Market Revenue Million Forecast, by Country 2019 & 2032
- Table 59: Turkey ANZ Location-based Services Market Revenue (Million) Forecast, by Application 2019 & 2032
- Table 60: Israel ANZ Location-based Services Market Revenue (Million) Forecast, by Application 2019 & 2032
- Table 61: GCC ANZ Location-based Services Market Revenue (Million) Forecast, by Application 2019 & 2032
- Table 62: North Africa ANZ Location-based Services Market Revenue (Million) Forecast, by Application 2019 & 2032
- Table 63: South Africa ANZ Location-based Services Market Revenue (Million) Forecast, by Application 2019 & 2032
- Table 64: Rest of Middle East & Africa ANZ Location-based Services Market Revenue (Million) Forecast, by Application 2019 & 2032
- Table 65: Global ANZ Location-based Services Market Revenue Million Forecast, by Location 2019 & 2032
- Table 66: Global ANZ Location-based Services Market Revenue Million Forecast, by Service Type 2019 & 2032
- Table 67: Global ANZ Location-based Services Market Revenue Million Forecast, by End-user Industry 2019 & 2032
- Table 68: Global ANZ Location-based Services Market Revenue Million Forecast, by Country 2019 & 2032
- Table 69: China ANZ Location-based Services Market Revenue (Million) Forecast, by Application 2019 & 2032
- Table 70: India ANZ Location-based Services Market Revenue (Million) Forecast, by Application 2019 & 2032
- Table 71: Japan ANZ Location-based Services Market Revenue (Million) Forecast, by Application 2019 & 2032
- Table 72: South Korea ANZ Location-based Services Market Revenue (Million) Forecast, by Application 2019 & 2032
- Table 73: ASEAN ANZ Location-based Services Market Revenue (Million) Forecast, by Application 2019 & 2032
- Table 74: Oceania ANZ Location-based Services Market Revenue (Million) Forecast, by Application 2019 & 2032
- Table 75: Rest of Asia Pacific ANZ Location-based Services Market Revenue (Million) Forecast, by Application 2019 & 2032
Frequently Asked Questions
1. What is the projected Compound Annual Growth Rate (CAGR) of the ANZ Location-based Services Market?
The projected CAGR is approximately 18.81%.
2. Which companies are prominent players in the ANZ Location-based Services Market?
Key companies in the market include TomTom International BV, Uber Technologies Inc, Google LLC, Esri Australia Pty Ltd, Cisco Systems Inc, Microsoft Corporation, Huawei Technologies Co Ltd, HERE Technologies (HERE Global B V), Apple Inc, GapMaps Pty Ltd.
3. What are the main segments of the ANZ Location-based Services Market?
The market segments include Location, Service Type, End-user Industry.
4. Can you provide details about the market size?
The market size is estimated to be USD 2.07 Million as of 2022.
5. What are some drivers contributing to market growth?
Growing Focus on Positioning Technologies; Rapid Increase in Internet Penetration.
6. What are the notable trends driving market growth?
Rapid Increase in Internet Penetration to Drive the Market Growth.
7. Are there any restraints impacting market growth?
Concerns about Data Privacy and Security; Limited Access to high-speed internet in Some Regions.
8. Can you provide examples of recent developments in the market?
September 2023: Geoscience Australia successfully integrated the administration and access to Australia's positioning infrastructure through the National Positioning Infrastructure Capability (NPIC). This integration ensures that the government, business, and academic sectors can now access reliable and fit-for-purpose positioning data and services with ease.
9. What pricing options are available for accessing the report?
Pricing options include single-user, multi-user, and enterprise licenses priced at USD 3800, USD 4500, and USD 5800 respectively.
10. Is the market size provided in terms of value or volume?
The market size is provided in terms of value, measured in Million.
11. Are there any specific market keywords associated with the report?
Yes, the market keyword associated with the report is "ANZ Location-based Services Market," which aids in identifying and referencing the specific market segment covered.
12. How do I determine which pricing option suits my needs best?
The pricing options vary based on user requirements and access needs. Individual users may opt for single-user licenses, while businesses requiring broader access may choose multi-user or enterprise licenses for cost-effective access to the report.
13. Are there any additional resources or data provided in the ANZ Location-based Services Market report?
While the report offers comprehensive insights, it's advisable to review the specific contents or supplementary materials provided to ascertain if additional resources or data are available.
14. How can I stay updated on further developments or reports in the ANZ Location-based Services Market?
To stay informed about further developments, trends, and reports in the ANZ Location-based Services Market, consider subscribing to industry newsletters, following relevant companies and organizations, or regularly checking reputable industry news sources and publications.
Methodology
Step 1 - Identification of Relevant Samples Size from Population Database


Step 2 - Approaches for Defining Global Market Size (Value, Volume* & Price*)

Note*: In applicable scenarios
Step 3 - Data Sources
Primary Research
- Web Analytics
- Survey Reports
- Research Institute
- Latest Research Reports
- Opinion Leaders
Secondary Research
- Annual Reports
- White Paper
- Latest Press Release
- Industry Association
- Paid Database
- Investor Presentations

Step 4 - Data Triangulation
Involves using different sources of information in order to increase the validity of a study
These sources are likely to be stakeholders in a program - participants, other researchers, program staff, other community members, and so on.
Then we put all data in single framework & apply various statistical tools to find out the dynamic on the market.
During the analysis stage, feedback from the stakeholder groups would be compared to determine areas of agreement as well as areas of divergence


