
Key Insights
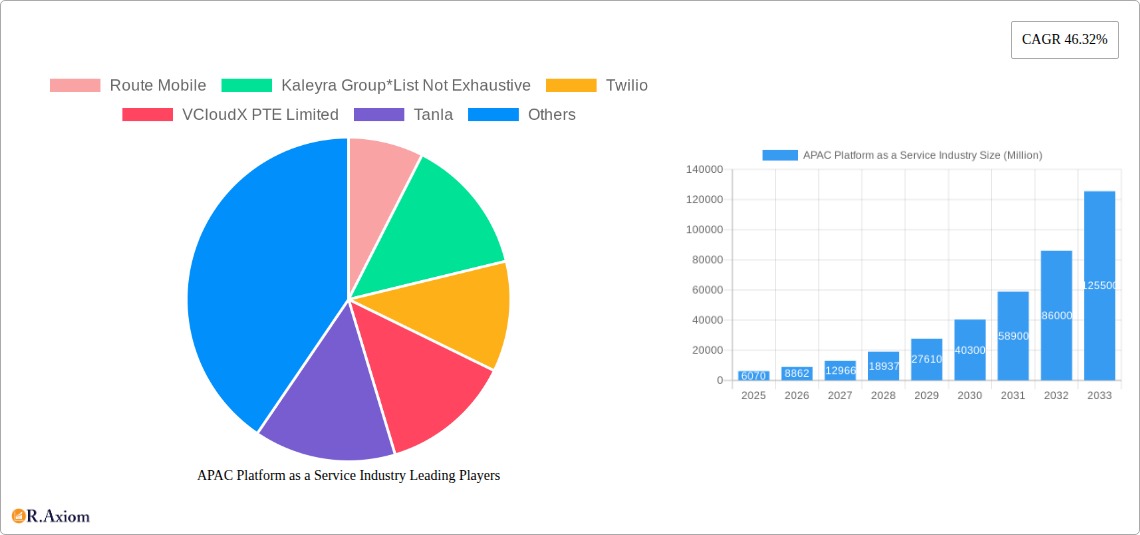
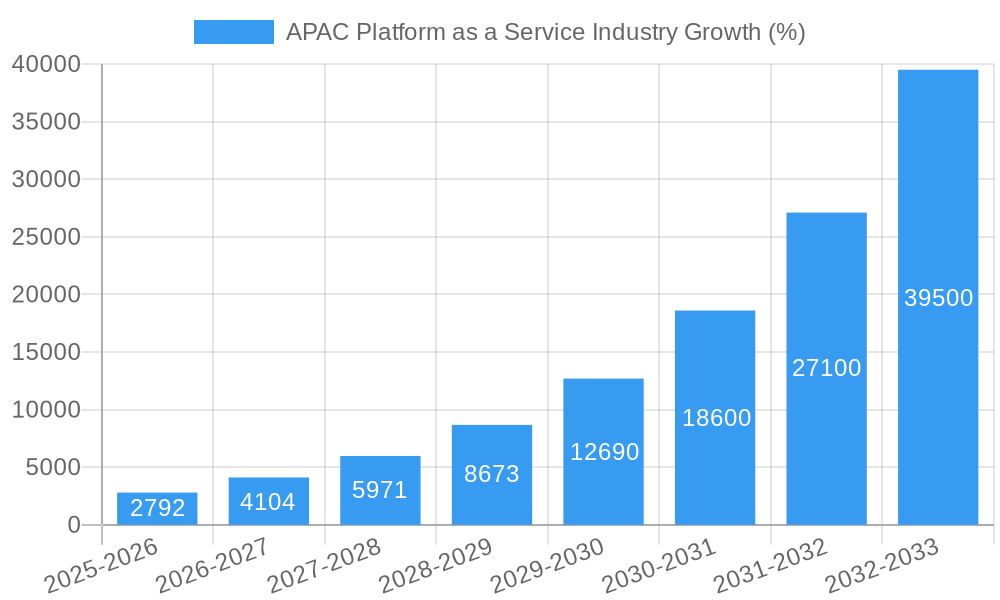
The Asia-Pacific (APAC) Platform as a Service (PaaS) market is experiencing explosive growth, projected to reach $6.07 billion in 2025 and exhibiting a remarkable Compound Annual Growth Rate (CAGR) of 46.32%. This surge is driven by several key factors. Firstly, the increasing adoption of cloud computing across various industries, including IT & Telecom, BFSI (Banking, Financial Services, and Insurance), and Retail & Consumer Goods, fuels the demand for scalable and flexible PaaS solutions. Secondly, the region's burgeoning digital economy, characterized by a growing number of startups and SMEs, necessitates cost-effective and agile infrastructure solutions offered by PaaS providers. Furthermore, government initiatives promoting digital transformation across APAC nations are significantly boosting market expansion. China, India, Japan, and South Korea are leading the charge, but substantial growth is also anticipated from Southeast Asia and other emerging economies within the region. The competitive landscape is dynamic, with both established global players like Twilio and Vonage and rapidly growing regional players like Route Mobile and Tanla vying for market share. This competition fosters innovation and drives down costs, further accelerating market adoption.
Looking ahead, several trends are expected to shape the future of the APAC PaaS market. The increasing integration of Artificial Intelligence (AI) and Machine Learning (ML) into PaaS offerings will enhance automation and efficiency. Furthermore, the rising adoption of serverless computing and containerization technologies will contribute to improved scalability and cost optimization. While data security concerns and the need for robust cybersecurity measures pose potential restraints, the overall market outlook remains exceptionally positive. The substantial growth trajectory is projected to continue throughout the forecast period (2025-2033), solidifying PaaS as a crucial component of the evolving digital landscape in APAC. The market's segmentation by organization size (SME vs. large-scale) and end-user vertical provides valuable insights into specific growth drivers within the region. This granular understanding is crucial for companies seeking to capitalize on the market's immense potential.
APAC Platform as a Service (PaaS) Industry Market Report: 2019-2033
This comprehensive report provides a detailed analysis of the Asia-Pacific Platform as a Service (PaaS) industry, offering invaluable insights for stakeholders, investors, and businesses operating within this dynamic sector. The report covers the period 2019-2033, with a focus on 2025 as the base and estimated year. The market is segmented by organization size (SME, large-scale), end-user (IT & Telecom, BFSI, Retail & Consumer Goods, Other), and country (China, India, Japan, South Korea, Southeast Asia, Rest of Asia-Pacific). Key players such as Route Mobile, Kaleyra Group, Twilio, VCloudX PTE Limited, Tanla, MNF Group, Vonage, and 8x are analyzed, though the list is not exhaustive. The report projects a market size of xx Million by 2033.
APAC Platform as a Service Industry Market Concentration & Innovation
The APAC PaaS market exhibits a moderately concentrated landscape, with a few dominant players holding significant market share. Route Mobile and Twilio, for instance, hold approximately xx% and yy% respectively, as of 2024. However, the market also demonstrates considerable dynamism, fueled by continuous innovation and increased M&A activity. Several smaller players are rapidly gaining traction through specialized offerings and strategic partnerships. The total value of M&A deals in the APAC PaaS sector between 2019 and 2024 reached approximately xx Million.
- Market Share Concentration: Top 5 players control approximately xx% of the market.
- Innovation Drivers: Cloud adoption, increasing demand for agile development, and the rise of AI/ML are key drivers.
- Regulatory Frameworks: Varying data privacy regulations across APAC nations influence market dynamics.
- Product Substitutes: On-premise solutions and open-source platforms present competitive challenges.
- End-User Trends: Demand for customized PaaS solutions tailored to specific industry needs is growing rapidly.
- M&A Activities: Consolidation is expected to continue, with larger players acquiring smaller firms to expand their capabilities and market reach.
APAC Platform as a Service Industry Industry Trends & Insights
The APAC PaaS market is experiencing robust growth, driven by the increasing adoption of cloud computing across various industries. The market is projected to exhibit a Compound Annual Growth Rate (CAGR) of xx% during the forecast period (2025-2033). Technological disruptions, particularly advancements in AI and automation, are significantly influencing market trends. Consumer preferences for flexible, scalable, and cost-effective solutions are shaping vendor strategies. Intense competition is leading to innovation and the development of value-added services. Market penetration is expected to reach xx% by 2033.
Dominant Markets & Segments in APAC Platform as a Service Industry
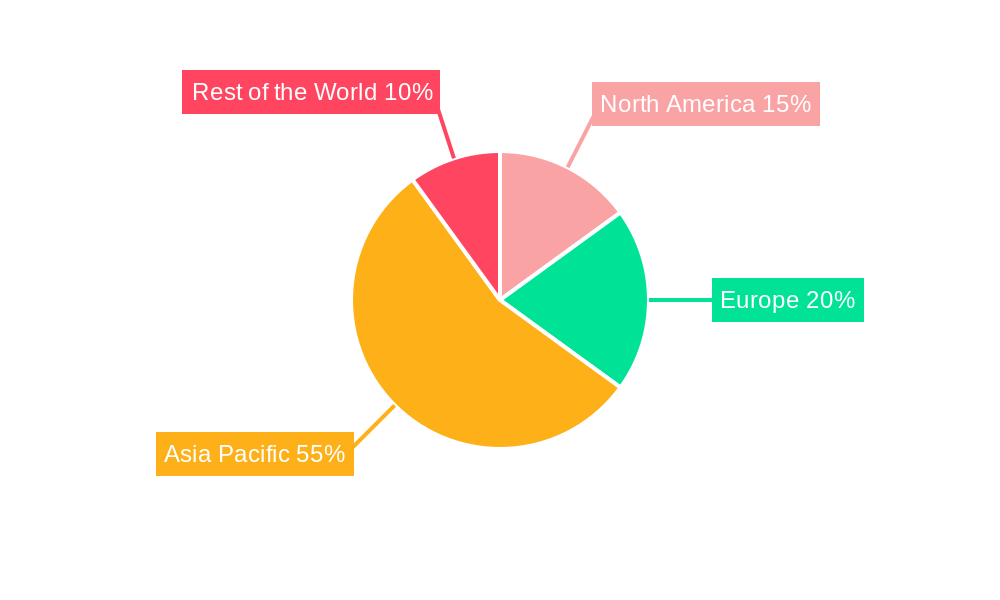
- Leading Region: China and India are currently the dominant markets, fueled by strong economic growth, technological advancement, and increasing digitalization.
- Leading Country: China holds the largest market share due to its massive IT sector and substantial investments in cloud infrastructure.
- Leading Segments:
- By Organization Size: Large-scale organizations account for a larger market share due to their higher budgets and more sophisticated IT infrastructure requirements.
- By End-User: The IT & Telecom sector is the leading end-user segment, followed by BFSI.
- Key Drivers:
- Economic Policies: Government initiatives promoting digital transformation and cloud adoption are stimulating market growth.
- Infrastructure Development: Investments in robust telecommunication infrastructure are creating a favorable environment for PaaS adoption.
China's dominance is attributable to its robust digital economy and government support for technological innovation. India follows closely, experiencing rapid growth driven by a young and tech-savvy population. Southeast Asia is also emerging as a key market due to its rising internet penetration and increasing demand for cloud-based solutions. The BFSI and IT & Telecom sectors demonstrate high adoption rates due to their critical reliance on secure and scalable cloud services.
APAC Platform as a Service Industry Product Developments
Recent product innovations emphasize enhanced security features, improved scalability, and integration with AI/ML tools. Providers are increasingly focusing on offering customized PaaS solutions tailored to specific industry needs, improving market fit. Technological trends like serverless computing, microservices architecture, and edge computing are shaping product development strategies and enhancing competitive advantages.
Report Scope & Segmentation Analysis
This report provides a comprehensive analysis of the APAC PaaS market, segmented by organization size (SME and large-scale), end-user (IT & Telecom, BFSI, Retail & Consumer Goods, and Others), and country (China, India, Japan, South Korea, Southeast Asia, and Rest of APAC). Each segment's growth projections, market sizes, and competitive dynamics are extensively examined, detailing the specific opportunities and challenges within each area.
Key Drivers of APAC Platform as a Service Industry Growth
Several factors fuel the growth of the APAC PaaS market: the rapid expansion of cloud computing adoption, the increasing demand for agile development methodologies, and government initiatives promoting digital transformation. The rising popularity of AI/ML-powered applications and the need for enhanced security features also contribute significantly to market expansion.
Challenges in the APAC Platform as a Service Industry Sector
The APAC PaaS market faces challenges, including data security and privacy concerns, varying regulatory frameworks across different countries, and the potential for vendor lock-in. Competition from established players and the emergence of disruptive technologies also pose significant challenges to market participants.
Emerging Opportunities in APAC Platform as a Service Industry
The increasing adoption of IoT devices, the growing demand for edge computing solutions, and the expansion of 5G networks present significant opportunities for PaaS providers. The rise of serverless computing and the increasing integration of AI/ML capabilities into PaaS platforms also offer exciting avenues for growth and innovation.
Leading Players in the APAC Platform as a Service Industry Market
- Route Mobile
- Kaleyra Group
- Twilio
- VCloudX PTE Limited
- Tanla
- MNF Group
- Vonage
- 8x
Key Developments in APAC Platform as a Service Industry Industry
- March 2023: Vonage launched a new tool for large-scale omnichannel campaigns, enhancing customer interaction capabilities.
- January 2023: Gupshup released Auto Bot Builder, leveraging GPT-3 for rapid chatbot development tailored to enterprise needs.
Strategic Outlook for APAC Platform as a Service Industry Market
The APAC PaaS market is poised for continued growth, driven by increasing cloud adoption, technological advancements, and supportive government policies. Opportunities lie in catering to specific industry needs, leveraging emerging technologies like AI/ML and edge computing, and focusing on enhancing security and data privacy features. The market is expected to experience significant expansion in the coming years, presenting lucrative opportunities for both established and emerging players.
APAC Platform as a Service Industry Segmentation
-
1. Organization size
- 1.1. SME
- 1.2. Large-scale organization
-
2. End-User
- 2.1. IT & Telecom
- 2.2. BFSI
- 2.3. Retail & Consumer goods
- 2.4. Other end-user verticals
APAC Platform as a Service Industry Segmentation By Geography
-
1. North America
- 1.1. United States
- 1.2. Canada
- 1.3. Mexico
-
2. South America
- 2.1. Brazil
- 2.2. Argentina
- 2.3. Rest of South America
-
3. Europe
- 3.1. United Kingdom
- 3.2. Germany
- 3.3. France
- 3.4. Italy
- 3.5. Spain
- 3.6. Russia
- 3.7. Benelux
- 3.8. Nordics
- 3.9. Rest of Europe
-
4. Middle East & Africa
- 4.1. Turkey
- 4.2. Israel
- 4.3. GCC
- 4.4. North Africa
- 4.5. South Africa
- 4.6. Rest of Middle East & Africa
-
5. Asia Pacific
- 5.1. China
- 5.2. India
- 5.3. Japan
- 5.4. South Korea
- 5.5. ASEAN
- 5.6. Oceania
- 5.7. Rest of Asia Pacific
APAC Platform as a Service Industry REPORT HIGHLIGHTS
| Aspects | Details |
|---|---|
| Study Period | 2019-2033 |
| Base Year | 2024 |
| Estimated Year | 2025 |
| Forecast Period | 2025-2033 |
| Historical Period | 2019-2024 |
| Growth Rate | CAGR of 46.32% from 2019-2033 |
| Segmentation |
|
Table of Contents
- 1. Introduction
- 1.1. Research Scope
- 1.2. Market Segmentation
- 1.3. Research Methodology
- 1.4. Definitions and Assumptions
- 2. Executive Summary
- 2.1. Introduction
- 3. Market Dynamics
- 3.1. Introduction
- 3.2. Market Drivers
- 3.2.1 Exponential Increase in the Uptake of CPaaS- based Solutions over Other Adjacent Models (UCaaS and traditional deployments); Growing Demand for Low-code Enablement to make Enterprise CPaaS highly Usable for Customer Operations
- 3.2.2 Service
- 3.2.3 and Marketing
- 3.3. Market Restrains
- 3.3.1. Implementation Challenges
- 3.4. Market Trends
- 3.4.1. IT and Telecom to Drive the Market Growth
- 4. Market Factor Analysis
- 4.1. Porters Five Forces
- 4.2. Supply/Value Chain
- 4.3. PESTEL analysis
- 4.4. Market Entropy
- 4.5. Patent/Trademark Analysis
- 5. Global APAC Platform as a Service Industry Analysis, Insights and Forecast, 2019-2031
- 5.1. Market Analysis, Insights and Forecast - by Organization size
- 5.1.1. SME
- 5.1.2. Large-scale organization
- 5.2. Market Analysis, Insights and Forecast - by End-User
- 5.2.1. IT & Telecom
- 5.2.2. BFSI
- 5.2.3. Retail & Consumer goods
- 5.2.4. Other end-user verticals
- 5.3. Market Analysis, Insights and Forecast - by Region
- 5.3.1. North America
- 5.3.2. South America
- 5.3.3. Europe
- 5.3.4. Middle East & Africa
- 5.3.5. Asia Pacific
- 5.1. Market Analysis, Insights and Forecast - by Organization size
- 6. North America APAC Platform as a Service Industry Analysis, Insights and Forecast, 2019-2031
- 6.1. Market Analysis, Insights and Forecast - by Organization size
- 6.1.1. SME
- 6.1.2. Large-scale organization
- 6.2. Market Analysis, Insights and Forecast - by End-User
- 6.2.1. IT & Telecom
- 6.2.2. BFSI
- 6.2.3. Retail & Consumer goods
- 6.2.4. Other end-user verticals
- 6.1. Market Analysis, Insights and Forecast - by Organization size
- 7. South America APAC Platform as a Service Industry Analysis, Insights and Forecast, 2019-2031
- 7.1. Market Analysis, Insights and Forecast - by Organization size
- 7.1.1. SME
- 7.1.2. Large-scale organization
- 7.2. Market Analysis, Insights and Forecast - by End-User
- 7.2.1. IT & Telecom
- 7.2.2. BFSI
- 7.2.3. Retail & Consumer goods
- 7.2.4. Other end-user verticals
- 7.1. Market Analysis, Insights and Forecast - by Organization size
- 8. Europe APAC Platform as a Service Industry Analysis, Insights and Forecast, 2019-2031
- 8.1. Market Analysis, Insights and Forecast - by Organization size
- 8.1.1. SME
- 8.1.2. Large-scale organization
- 8.2. Market Analysis, Insights and Forecast - by End-User
- 8.2.1. IT & Telecom
- 8.2.2. BFSI
- 8.2.3. Retail & Consumer goods
- 8.2.4. Other end-user verticals
- 8.1. Market Analysis, Insights and Forecast - by Organization size
- 9. Middle East & Africa APAC Platform as a Service Industry Analysis, Insights and Forecast, 2019-2031
- 9.1. Market Analysis, Insights and Forecast - by Organization size
- 9.1.1. SME
- 9.1.2. Large-scale organization
- 9.2. Market Analysis, Insights and Forecast - by End-User
- 9.2.1. IT & Telecom
- 9.2.2. BFSI
- 9.2.3. Retail & Consumer goods
- 9.2.4. Other end-user verticals
- 9.1. Market Analysis, Insights and Forecast - by Organization size
- 10. Asia Pacific APAC Platform as a Service Industry Analysis, Insights and Forecast, 2019-2031
- 10.1. Market Analysis, Insights and Forecast - by Organization size
- 10.1.1. SME
- 10.1.2. Large-scale organization
- 10.2. Market Analysis, Insights and Forecast - by End-User
- 10.2.1. IT & Telecom
- 10.2.2. BFSI
- 10.2.3. Retail & Consumer goods
- 10.2.4. Other end-user verticals
- 10.1. Market Analysis, Insights and Forecast - by Organization size
- 11. North America APAC Platform as a Service Industry Analysis, Insights and Forecast, 2019-2031
- 11.1. Market Analysis, Insights and Forecast - By Country/Sub-region
- 11.1.1.
- 12. Europe APAC Platform as a Service Industry Analysis, Insights and Forecast, 2019-2031
- 12.1. Market Analysis, Insights and Forecast - By Country/Sub-region
- 12.1.1.
- 13. Asia Pacific APAC Platform as a Service Industry Analysis, Insights and Forecast, 2019-2031
- 13.1. Market Analysis, Insights and Forecast - By Country/Sub-region
- 13.1.1.
- 14. Rest of the World APAC Platform as a Service Industry Analysis, Insights and Forecast, 2019-2031
- 14.1. Market Analysis, Insights and Forecast - By Country/Sub-region
- 14.1.1.
- 15. Competitive Analysis
- 15.1. Global Market Share Analysis 2024
- 15.2. Company Profiles
- 15.2.1 Route Mobile
- 15.2.1.1. Overview
- 15.2.1.2. Products
- 15.2.1.3. SWOT Analysis
- 15.2.1.4. Recent Developments
- 15.2.1.5. Financials (Based on Availability)
- 15.2.2 Kaleyra Group*List Not Exhaustive
- 15.2.2.1. Overview
- 15.2.2.2. Products
- 15.2.2.3. SWOT Analysis
- 15.2.2.4. Recent Developments
- 15.2.2.5. Financials (Based on Availability)
- 15.2.3 Twilio
- 15.2.3.1. Overview
- 15.2.3.2. Products
- 15.2.3.3. SWOT Analysis
- 15.2.3.4. Recent Developments
- 15.2.3.5. Financials (Based on Availability)
- 15.2.4 VCloudX PTE Limited
- 15.2.4.1. Overview
- 15.2.4.2. Products
- 15.2.4.3. SWOT Analysis
- 15.2.4.4. Recent Developments
- 15.2.4.5. Financials (Based on Availability)
- 15.2.5 Tanla
- 15.2.5.1. Overview
- 15.2.5.2. Products
- 15.2.5.3. SWOT Analysis
- 15.2.5.4. Recent Developments
- 15.2.5.5. Financials (Based on Availability)
- 15.2.6 MNF Group
- 15.2.6.1. Overview
- 15.2.6.2. Products
- 15.2.6.3. SWOT Analysis
- 15.2.6.4. Recent Developments
- 15.2.6.5. Financials (Based on Availability)
- 15.2.7 Vonage
- 15.2.7.1. Overview
- 15.2.7.2. Products
- 15.2.7.3. SWOT Analysis
- 15.2.7.4. Recent Developments
- 15.2.7.5. Financials (Based on Availability)
- 15.2.8 8x
- 15.2.8.1. Overview
- 15.2.8.2. Products
- 15.2.8.3. SWOT Analysis
- 15.2.8.4. Recent Developments
- 15.2.8.5. Financials (Based on Availability)
- 15.2.1 Route Mobile
List of Figures
- Figure 1: Global APAC Platform as a Service Industry Revenue Breakdown (Million, %) by Region 2024 & 2032
- Figure 2: North America APAC Platform as a Service Industry Revenue (Million), by Country 2024 & 2032
- Figure 3: North America APAC Platform as a Service Industry Revenue Share (%), by Country 2024 & 2032
- Figure 4: Europe APAC Platform as a Service Industry Revenue (Million), by Country 2024 & 2032
- Figure 5: Europe APAC Platform as a Service Industry Revenue Share (%), by Country 2024 & 2032
- Figure 6: Asia Pacific APAC Platform as a Service Industry Revenue (Million), by Country 2024 & 2032
- Figure 7: Asia Pacific APAC Platform as a Service Industry Revenue Share (%), by Country 2024 & 2032
- Figure 8: Rest of the World APAC Platform as a Service Industry Revenue (Million), by Country 2024 & 2032
- Figure 9: Rest of the World APAC Platform as a Service Industry Revenue Share (%), by Country 2024 & 2032
- Figure 10: North America APAC Platform as a Service Industry Revenue (Million), by Organization size 2024 & 2032
- Figure 11: North America APAC Platform as a Service Industry Revenue Share (%), by Organization size 2024 & 2032
- Figure 12: North America APAC Platform as a Service Industry Revenue (Million), by End-User 2024 & 2032
- Figure 13: North America APAC Platform as a Service Industry Revenue Share (%), by End-User 2024 & 2032
- Figure 14: North America APAC Platform as a Service Industry Revenue (Million), by Country 2024 & 2032
- Figure 15: North America APAC Platform as a Service Industry Revenue Share (%), by Country 2024 & 2032
- Figure 16: South America APAC Platform as a Service Industry Revenue (Million), by Organization size 2024 & 2032
- Figure 17: South America APAC Platform as a Service Industry Revenue Share (%), by Organization size 2024 & 2032
- Figure 18: South America APAC Platform as a Service Industry Revenue (Million), by End-User 2024 & 2032
- Figure 19: South America APAC Platform as a Service Industry Revenue Share (%), by End-User 2024 & 2032
- Figure 20: South America APAC Platform as a Service Industry Revenue (Million), by Country 2024 & 2032
- Figure 21: South America APAC Platform as a Service Industry Revenue Share (%), by Country 2024 & 2032
- Figure 22: Europe APAC Platform as a Service Industry Revenue (Million), by Organization size 2024 & 2032
- Figure 23: Europe APAC Platform as a Service Industry Revenue Share (%), by Organization size 2024 & 2032
- Figure 24: Europe APAC Platform as a Service Industry Revenue (Million), by End-User 2024 & 2032
- Figure 25: Europe APAC Platform as a Service Industry Revenue Share (%), by End-User 2024 & 2032
- Figure 26: Europe APAC Platform as a Service Industry Revenue (Million), by Country 2024 & 2032
- Figure 27: Europe APAC Platform as a Service Industry Revenue Share (%), by Country 2024 & 2032
- Figure 28: Middle East & Africa APAC Platform as a Service Industry Revenue (Million), by Organization size 2024 & 2032
- Figure 29: Middle East & Africa APAC Platform as a Service Industry Revenue Share (%), by Organization size 2024 & 2032
- Figure 30: Middle East & Africa APAC Platform as a Service Industry Revenue (Million), by End-User 2024 & 2032
- Figure 31: Middle East & Africa APAC Platform as a Service Industry Revenue Share (%), by End-User 2024 & 2032
- Figure 32: Middle East & Africa APAC Platform as a Service Industry Revenue (Million), by Country 2024 & 2032
- Figure 33: Middle East & Africa APAC Platform as a Service Industry Revenue Share (%), by Country 2024 & 2032
- Figure 34: Asia Pacific APAC Platform as a Service Industry Revenue (Million), by Organization size 2024 & 2032
- Figure 35: Asia Pacific APAC Platform as a Service Industry Revenue Share (%), by Organization size 2024 & 2032
- Figure 36: Asia Pacific APAC Platform as a Service Industry Revenue (Million), by End-User 2024 & 2032
- Figure 37: Asia Pacific APAC Platform as a Service Industry Revenue Share (%), by End-User 2024 & 2032
- Figure 38: Asia Pacific APAC Platform as a Service Industry Revenue (Million), by Country 2024 & 2032
- Figure 39: Asia Pacific APAC Platform as a Service Industry Revenue Share (%), by Country 2024 & 2032
List of Tables
- Table 1: Global APAC Platform as a Service Industry Revenue Million Forecast, by Region 2019 & 2032
- Table 2: Global APAC Platform as a Service Industry Revenue Million Forecast, by Organization size 2019 & 2032
- Table 3: Global APAC Platform as a Service Industry Revenue Million Forecast, by End-User 2019 & 2032
- Table 4: Global APAC Platform as a Service Industry Revenue Million Forecast, by Region 2019 & 2032
- Table 5: Global APAC Platform as a Service Industry Revenue Million Forecast, by Country 2019 & 2032
- Table 6: APAC Platform as a Service Industry Revenue (Million) Forecast, by Application 2019 & 2032
- Table 7: Global APAC Platform as a Service Industry Revenue Million Forecast, by Country 2019 & 2032
- Table 8: APAC Platform as a Service Industry Revenue (Million) Forecast, by Application 2019 & 2032
- Table 9: Global APAC Platform as a Service Industry Revenue Million Forecast, by Country 2019 & 2032
- Table 10: APAC Platform as a Service Industry Revenue (Million) Forecast, by Application 2019 & 2032
- Table 11: Global APAC Platform as a Service Industry Revenue Million Forecast, by Country 2019 & 2032
- Table 12: APAC Platform as a Service Industry Revenue (Million) Forecast, by Application 2019 & 2032
- Table 13: Global APAC Platform as a Service Industry Revenue Million Forecast, by Organization size 2019 & 2032
- Table 14: Global APAC Platform as a Service Industry Revenue Million Forecast, by End-User 2019 & 2032
- Table 15: Global APAC Platform as a Service Industry Revenue Million Forecast, by Country 2019 & 2032
- Table 16: United States APAC Platform as a Service Industry Revenue (Million) Forecast, by Application 2019 & 2032
- Table 17: Canada APAC Platform as a Service Industry Revenue (Million) Forecast, by Application 2019 & 2032
- Table 18: Mexico APAC Platform as a Service Industry Revenue (Million) Forecast, by Application 2019 & 2032
- Table 19: Global APAC Platform as a Service Industry Revenue Million Forecast, by Organization size 2019 & 2032
- Table 20: Global APAC Platform as a Service Industry Revenue Million Forecast, by End-User 2019 & 2032
- Table 21: Global APAC Platform as a Service Industry Revenue Million Forecast, by Country 2019 & 2032
- Table 22: Brazil APAC Platform as a Service Industry Revenue (Million) Forecast, by Application 2019 & 2032
- Table 23: Argentina APAC Platform as a Service Industry Revenue (Million) Forecast, by Application 2019 & 2032
- Table 24: Rest of South America APAC Platform as a Service Industry Revenue (Million) Forecast, by Application 2019 & 2032
- Table 25: Global APAC Platform as a Service Industry Revenue Million Forecast, by Organization size 2019 & 2032
- Table 26: Global APAC Platform as a Service Industry Revenue Million Forecast, by End-User 2019 & 2032
- Table 27: Global APAC Platform as a Service Industry Revenue Million Forecast, by Country 2019 & 2032
- Table 28: United Kingdom APAC Platform as a Service Industry Revenue (Million) Forecast, by Application 2019 & 2032
- Table 29: Germany APAC Platform as a Service Industry Revenue (Million) Forecast, by Application 2019 & 2032
- Table 30: France APAC Platform as a Service Industry Revenue (Million) Forecast, by Application 2019 & 2032
- Table 31: Italy APAC Platform as a Service Industry Revenue (Million) Forecast, by Application 2019 & 2032
- Table 32: Spain APAC Platform as a Service Industry Revenue (Million) Forecast, by Application 2019 & 2032
- Table 33: Russia APAC Platform as a Service Industry Revenue (Million) Forecast, by Application 2019 & 2032
- Table 34: Benelux APAC Platform as a Service Industry Revenue (Million) Forecast, by Application 2019 & 2032
- Table 35: Nordics APAC Platform as a Service Industry Revenue (Million) Forecast, by Application 2019 & 2032
- Table 36: Rest of Europe APAC Platform as a Service Industry Revenue (Million) Forecast, by Application 2019 & 2032
- Table 37: Global APAC Platform as a Service Industry Revenue Million Forecast, by Organization size 2019 & 2032
- Table 38: Global APAC Platform as a Service Industry Revenue Million Forecast, by End-User 2019 & 2032
- Table 39: Global APAC Platform as a Service Industry Revenue Million Forecast, by Country 2019 & 2032
- Table 40: Turkey APAC Platform as a Service Industry Revenue (Million) Forecast, by Application 2019 & 2032
- Table 41: Israel APAC Platform as a Service Industry Revenue (Million) Forecast, by Application 2019 & 2032
- Table 42: GCC APAC Platform as a Service Industry Revenue (Million) Forecast, by Application 2019 & 2032
- Table 43: North Africa APAC Platform as a Service Industry Revenue (Million) Forecast, by Application 2019 & 2032
- Table 44: South Africa APAC Platform as a Service Industry Revenue (Million) Forecast, by Application 2019 & 2032
- Table 45: Rest of Middle East & Africa APAC Platform as a Service Industry Revenue (Million) Forecast, by Application 2019 & 2032
- Table 46: Global APAC Platform as a Service Industry Revenue Million Forecast, by Organization size 2019 & 2032
- Table 47: Global APAC Platform as a Service Industry Revenue Million Forecast, by End-User 2019 & 2032
- Table 48: Global APAC Platform as a Service Industry Revenue Million Forecast, by Country 2019 & 2032
- Table 49: China APAC Platform as a Service Industry Revenue (Million) Forecast, by Application 2019 & 2032
- Table 50: India APAC Platform as a Service Industry Revenue (Million) Forecast, by Application 2019 & 2032
- Table 51: Japan APAC Platform as a Service Industry Revenue (Million) Forecast, by Application 2019 & 2032
- Table 52: South Korea APAC Platform as a Service Industry Revenue (Million) Forecast, by Application 2019 & 2032
- Table 53: ASEAN APAC Platform as a Service Industry Revenue (Million) Forecast, by Application 2019 & 2032
- Table 54: Oceania APAC Platform as a Service Industry Revenue (Million) Forecast, by Application 2019 & 2032
- Table 55: Rest of Asia Pacific APAC Platform as a Service Industry Revenue (Million) Forecast, by Application 2019 & 2032
Frequently Asked Questions
1. What is the projected Compound Annual Growth Rate (CAGR) of the APAC Platform as a Service Industry?
The projected CAGR is approximately 46.32%.
2. Which companies are prominent players in the APAC Platform as a Service Industry?
Key companies in the market include Route Mobile, Kaleyra Group*List Not Exhaustive, Twilio, VCloudX PTE Limited, Tanla, MNF Group, Vonage, 8x.
3. What are the main segments of the APAC Platform as a Service Industry?
The market segments include Organization size, End-User.
4. Can you provide details about the market size?
The market size is estimated to be USD 6.07 Million as of 2022.
5. What are some drivers contributing to market growth?
Exponential Increase in the Uptake of CPaaS- based Solutions over Other Adjacent Models (UCaaS and traditional deployments); Growing Demand for Low-code Enablement to make Enterprise CPaaS highly Usable for Customer Operations. Service. and Marketing.
6. What are the notable trends driving market growth?
IT and Telecom to Drive the Market Growth.
7. Are there any restraints impacting market growth?
Implementation Challenges.
8. Can you provide examples of recent developments in the market?
March 2023: Vonage unveiled an innovative tool aimed at empowering businesses to execute tailored, large-scale omnichannel campaigns and distribute bulk messages. This platform enables two-way interactions with customers, fostering proactive connections, all within a unified marketing and automation framework.
9. What pricing options are available for accessing the report?
Pricing options include single-user, multi-user, and enterprise licenses priced at USD 4750, USD 4950, and USD 6800 respectively.
10. Is the market size provided in terms of value or volume?
The market size is provided in terms of value, measured in Million.
11. Are there any specific market keywords associated with the report?
Yes, the market keyword associated with the report is "APAC Platform as a Service Industry," which aids in identifying and referencing the specific market segment covered.
12. How do I determine which pricing option suits my needs best?
The pricing options vary based on user requirements and access needs. Individual users may opt for single-user licenses, while businesses requiring broader access may choose multi-user or enterprise licenses for cost-effective access to the report.
13. Are there any additional resources or data provided in the APAC Platform as a Service Industry report?
While the report offers comprehensive insights, it's advisable to review the specific contents or supplementary materials provided to ascertain if additional resources or data are available.
14. How can I stay updated on further developments or reports in the APAC Platform as a Service Industry?
To stay informed about further developments, trends, and reports in the APAC Platform as a Service Industry, consider subscribing to industry newsletters, following relevant companies and organizations, or regularly checking reputable industry news sources and publications.
Methodology
Step 1 - Identification of Relevant Samples Size from Population Database


Step 2 - Approaches for Defining Global Market Size (Value, Volume* & Price*)

Note*: In applicable scenarios
Step 3 - Data Sources
Primary Research
- Web Analytics
- Survey Reports
- Research Institute
- Latest Research Reports
- Opinion Leaders
Secondary Research
- Annual Reports
- White Paper
- Latest Press Release
- Industry Association
- Paid Database
- Investor Presentations

Step 4 - Data Triangulation
Involves using different sources of information in order to increase the validity of a study
These sources are likely to be stakeholders in a program - participants, other researchers, program staff, other community members, and so on.
Then we put all data in single framework & apply various statistical tools to find out the dynamic on the market.
During the analysis stage, feedback from the stakeholder groups would be compared to determine areas of agreement as well as areas of divergence


