
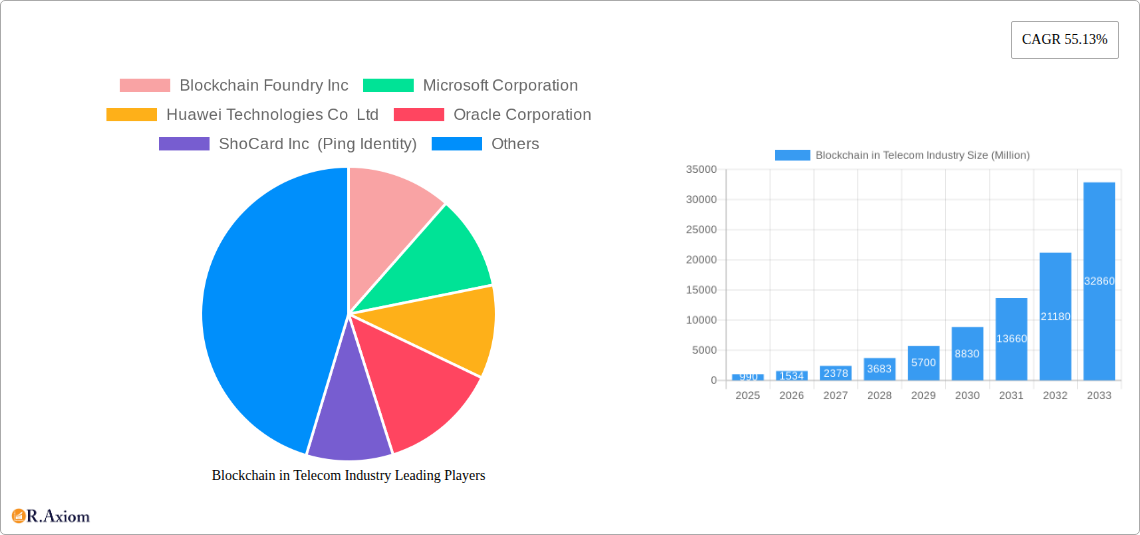
Key Insights
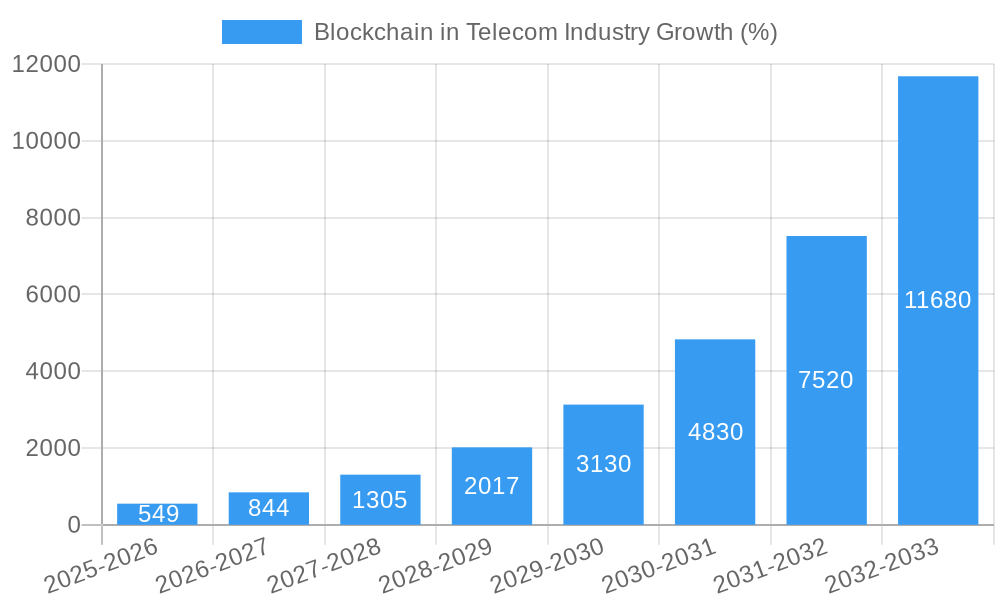
The Blockchain in Telecom market is experiencing explosive growth, projected to reach a market size of $0.99 billion in 2025 and exhibiting a remarkable Compound Annual Growth Rate (CAGR) of 55.13% from 2025 to 2033. This rapid expansion is fueled by several key drivers. The increasing need for secure and transparent identity management within telecom networks is a primary catalyst. Blockchain's inherent security features offer a robust solution to combat SIM swap fraud and other security threats, attracting significant investment from major telecom players. Furthermore, the rise of 5G and the Internet of Things (IoT) necessitates efficient and secure connectivity provisioning, an area where blockchain technology excels. Smart contracts, enabled by blockchain, automate billing and payment processes, improving operational efficiency and reducing costs. The integration of blockchain into these areas is streamlining telecom operations, enhancing customer experiences, and creating new revenue streams.
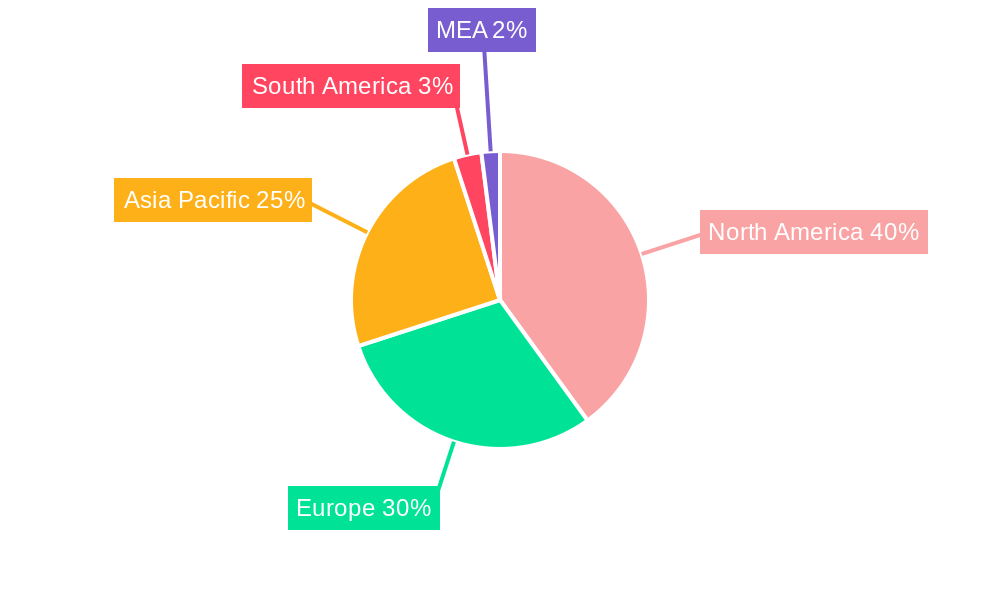
This market is segmented by application, with Identity Management, Payment and Billing, Smart Contracts, and Connectivity Provisioning representing key areas of adoption. Leading companies such as Blockchain Foundry Inc., Microsoft Corporation, Huawei Technologies Co Ltd., Oracle Corporation, ShoCard Inc. (Ping Identity), and SAP SE are actively contributing to the development and implementation of blockchain solutions within the telecom sector. Geographically, North America currently holds a significant market share, driven by early adoption and substantial investment in technological innovation. However, the Asia-Pacific region is poised for rapid growth, fueled by increasing smartphone penetration and the expansion of 5G networks. The consistent adoption of blockchain across various telecom applications, coupled with ongoing technological advancements and supportive regulatory environments, will drive sustained growth throughout the forecast period, leading to substantial market expansion in the coming years.
Blockchain in Telecom Industry: A Comprehensive Market Report (2019-2033)
This in-depth report provides a comprehensive analysis of the Blockchain in Telecom Industry market, offering invaluable insights for stakeholders, investors, and industry professionals. With a study period spanning 2019-2033, a base year of 2025, and a forecast period of 2025-2033, this report meticulously examines market trends, growth drivers, challenges, and opportunities within this rapidly evolving sector. The market is projected to reach xx Million by 2033, exhibiting a CAGR of xx% during the forecast period.
Blockchain in Telecom Industry Market Concentration & Innovation
This section analyzes the competitive landscape, innovation drivers, and regulatory factors shaping the Blockchain in Telecom Industry. The market exhibits a moderately concentrated structure, with key players such as Microsoft Corporation, Huawei Technologies Co Ltd, Oracle Corporation, SAP SE, and Blockchain Foundry Inc. holding significant market share. However, the emergence of niche players and startups is fostering innovation and competition.
- Market Share: Microsoft and Huawei together command an estimated xx% of the market share in 2025, while other players like Oracle and SAP SE hold approximately xx% each. Blockchain Foundry Inc and ShoCard Inc (Ping Identity) hold a combined xx%.
- M&A Activity: The historical period (2019-2024) witnessed xx Million in M&A activity, primarily driven by strategic acquisitions aimed at expanding technological capabilities and market reach. The forecast period is expected to see a surge in M&A activity, with an estimated xx Million in deal value.
- Innovation Drivers: Technological advancements in blockchain technology, increasing demand for secure and transparent telecom services, and regulatory support are key drivers of innovation.
- Regulatory Frameworks: Government regulations regarding data privacy and security are influencing the adoption of blockchain solutions, while initiatives like the JCOR in India are shaping the future regulatory landscape.
- Product Substitutes: Traditional centralized systems remain a primary substitute, but the inherent security and transparency advantages of blockchain are driving adoption.
- End-User Trends: A growing preference for secure and efficient communication services fuels the demand for blockchain-based solutions in telecom.
Blockchain in Telecom Industry Industry Trends & Insights
The Blockchain in Telecom Industry is experiencing robust growth, driven by several factors. The market's expansion is fueled by the increasing adoption of blockchain technology for enhanced security, improved efficiency, and cost reduction across various telecom operations. The rising demand for secure identity management, streamlined payment and billing systems, and efficient connectivity provisioning is further propelling market growth. Technological disruptions, such as the introduction of 5G and the Internet of Things (IoT), are creating new opportunities for blockchain integration. Consumer preferences are shifting towards more secure and transparent services, fostering demand for blockchain-based solutions. The competitive dynamics are marked by both established players and emerging startups vying for market share, stimulating innovation. The market is expected to exhibit significant growth, with a projected market penetration rate of xx% by 2033.
Dominant Markets & Segments in Blockchain in Telecom Industry
North America currently dominates the Blockchain in Telecom Industry market, driven by high technological adoption rates and the presence of major technology companies. However, Asia Pacific is emerging as a rapidly growing market due to increasing government support for blockchain initiatives and expanding digital infrastructure.
Dominant Segment: Identity Management holds the largest market share, driven by the increasing demand for secure and privacy-preserving authentication and authorization mechanisms.
- Identity Management:
- Key Drivers: Rising concerns about data breaches and identity theft, increasing regulations around data privacy (e.g., GDPR), and growing adoption of mobile devices.
- Payment and Billing:
- Key Drivers: Need for secure and transparent transaction processing, reducing fraud and enhancing efficiency in billing operations.
- Smart Contracts:
- Key Drivers: Automation of telecom service agreements, simplifying contract management and reducing operational costs.
- Connectivity Provisioning:
- Key Drivers: Improving network security, enhancing interoperability between different networks, and optimizing resource allocation.
Blockchain in Telecom Industry Product Developments
Recent product innovations focus on developing user-friendly interfaces and integrating blockchain security into existing telecom infrastructure. The focus is on improving interoperability and developing scalable solutions for large-scale deployments. Key innovations include blockchain-enabled SIM cards, secure messaging platforms, and AI-powered fraud detection systems. This integration of blockchain enhances existing services and creates opportunities for new applications, offering competitive advantages through increased security, efficiency, and transparency.
Report Scope & Segmentation Analysis
This report segments the Blockchain in Telecom Industry market by application: Identity Management, Payment and Billing, Smart Contract, and Connectivity Provisioning. Each segment is analyzed based on growth projections, market size (in Millions), and competitive dynamics. For example, the Identity Management segment is projected to reach xx Million by 2033, driven by stringent data privacy regulations and the increased demand for secure authentication solutions. The Payment and Billing segment is projected to reach xx Million, fueled by the need for transparent and secure financial transactions. The Smart Contract segment is expected to reach xx Million, driven by the desire for automated contract execution and enhanced efficiency. Finally, the Connectivity Provisioning segment, projected to reach xx Million, benefits from the need to secure and optimize network resources.
Key Drivers of Blockchain in Telecom Industry Growth
Several factors are driving the growth of the Blockchain in Telecom Industry. Technological advancements in blockchain technology, such as improved scalability and interoperability, are key drivers. Furthermore, growing government support for blockchain initiatives and increasing regulatory clarity are facilitating adoption. Economic factors, such as the need to reduce operational costs and enhance efficiency, are also playing a significant role. The demand for secure and transparent telecom services is a critical driver.
Challenges in the Blockchain in Telecom Industry Sector
The Blockchain in Telecom Industry faces several challenges. Regulatory uncertainty and a lack of standardized protocols hinder widespread adoption. The complexities of integrating blockchain technology into existing telecom infrastructure pose technological hurdles. The high initial investment costs can be a barrier to entry for smaller companies. Furthermore, the need for skilled professionals in blockchain technology creates a talent shortage, slowing down industry growth.
Emerging Opportunities in Blockchain in Telecom Industry
The Blockchain in Telecom Industry presents numerous opportunities. The integration of blockchain with 5G and IoT technologies is creating new opportunities for secure and efficient data management. The development of new applications, such as secure supply chain management and decentralized identity solutions, presents growth potential. The emergence of new markets in developing countries with high mobile penetration rates offers significant opportunities for expansion. Finally, evolving consumer preferences towards secure and transparent digital services create demand for blockchain-based telecom solutions.
Leading Players in the Blockchain in Telecom Industry Market
- Blockchain Foundry Inc
- Microsoft Corporation
- Huawei Technologies Co Ltd
- Oracle Corporation
- ShoCard Inc (Ping Identity)
- SAP SE
Key Developments in Blockchain in Telecom Industry Industry
- November 2022: The Telecom Regulatory Authority of India (TRAI), in collaboration with Telecom Service Providers (TSPs), announced its intention to leverage blockchain technology to combat spam calls and messages. This initiative aims to create a more secure and reliable communication ecosystem. The formation of the Joint Committee of Regulators (JCOR) involving TRAI, RBI, SEBI, and MoCA signifies a concerted effort to regulate the use of blockchain technology in the telecom sector.
- February 2022: Global Telecom launched its MERCURY series of tri-connectivity modules, featuring patented, hostless, driverless technology with an added layer of blockchain security. This development demonstrates the growing integration of blockchain technology into hardware and network infrastructure, enhancing security and connectivity.
Strategic Outlook for Blockchain in Telecom Industry Market
The Blockchain in Telecom Industry is poised for significant growth in the coming years. Technological advancements, increased regulatory clarity, and rising demand for secure and efficient telecom services will drive market expansion. The integration of blockchain with emerging technologies like 5G and IoT will create new opportunities, fueling innovation and attracting further investment. The market presents substantial potential for both established players and emerging startups, presenting a promising future for the industry.
Blockchain in Telecom Industry Segmentation
-
1. Application
- 1.1. Identity Management
- 1.2. Payment and Billing
- 1.3. Smart Contract
- 1.4. Connectivity Provisioning
Blockchain in Telecom Industry Segmentation By Geography
- 1. North America
- 2. Europe
- 3. Asia Pacific
- 4. Rest of the World
Blockchain in Telecom Industry REPORT HIGHLIGHTS
| Aspects | Details |
|---|---|
| Study Period | 2019-2033 |
| Base Year | 2024 |
| Estimated Year | 2025 |
| Forecast Period | 2025-2033 |
| Historical Period | 2019-2024 |
| Growth Rate | CAGR of 55.13% from 2019-2033 |
| Segmentation |
|
Table of Contents
- 1. Introduction
- 1.1. Research Scope
- 1.2. Market Segmentation
- 1.3. Research Methodology
- 1.4. Definitions and Assumptions
- 2. Executive Summary
- 2.1. Introduction
- 3. Market Dynamics
- 3.1. Introduction
- 3.2. Market Drivers
- 3.2.1. Focus on Telecom Fraud Detection and Prevention is Driving the Market Growth
- 3.3. Market Restrains
- 3.3.1. Lack of Industry Standards
- 3.4. Market Trends
- 3.4.1. Smart Contract to Dominate the Market
- 4. Market Factor Analysis
- 4.1. Porters Five Forces
- 4.2. Supply/Value Chain
- 4.3. PESTEL analysis
- 4.4. Market Entropy
- 4.5. Patent/Trademark Analysis
- 5. Global Blockchain in Telecom Industry Analysis, Insights and Forecast, 2019-2031
- 5.1. Market Analysis, Insights and Forecast - by Application
- 5.1.1. Identity Management
- 5.1.2. Payment and Billing
- 5.1.3. Smart Contract
- 5.1.4. Connectivity Provisioning
- 5.2. Market Analysis, Insights and Forecast - by Region
- 5.2.1. North America
- 5.2.2. Europe
- 5.2.3. Asia Pacific
- 5.2.4. Rest of the World
- 5.1. Market Analysis, Insights and Forecast - by Application
- 6. North America Blockchain in Telecom Industry Analysis, Insights and Forecast, 2019-2031
- 6.1. Market Analysis, Insights and Forecast - by Application
- 6.1.1. Identity Management
- 6.1.2. Payment and Billing
- 6.1.3. Smart Contract
- 6.1.4. Connectivity Provisioning
- 6.1. Market Analysis, Insights and Forecast - by Application
- 7. Europe Blockchain in Telecom Industry Analysis, Insights and Forecast, 2019-2031
- 7.1. Market Analysis, Insights and Forecast - by Application
- 7.1.1. Identity Management
- 7.1.2. Payment and Billing
- 7.1.3. Smart Contract
- 7.1.4. Connectivity Provisioning
- 7.1. Market Analysis, Insights and Forecast - by Application
- 8. Asia Pacific Blockchain in Telecom Industry Analysis, Insights and Forecast, 2019-2031
- 8.1. Market Analysis, Insights and Forecast - by Application
- 8.1.1. Identity Management
- 8.1.2. Payment and Billing
- 8.1.3. Smart Contract
- 8.1.4. Connectivity Provisioning
- 8.1. Market Analysis, Insights and Forecast - by Application
- 9. Rest of the World Blockchain in Telecom Industry Analysis, Insights and Forecast, 2019-2031
- 9.1. Market Analysis, Insights and Forecast - by Application
- 9.1.1. Identity Management
- 9.1.2. Payment and Billing
- 9.1.3. Smart Contract
- 9.1.4. Connectivity Provisioning
- 9.1. Market Analysis, Insights and Forecast - by Application
- 10. North America Blockchain in Telecom Industry Analysis, Insights and Forecast, 2019-2031
- 10.1. Market Analysis, Insights and Forecast - By Country/Sub-region
- 10.1.1 United States
- 10.1.2 Canada
- 10.1.3 Mexico
- 11. Europe Blockchain in Telecom Industry Analysis, Insights and Forecast, 2019-2031
- 11.1. Market Analysis, Insights and Forecast - By Country/Sub-region
- 11.1.1 Germany
- 11.1.2 United Kingdom
- 11.1.3 France
- 11.1.4 Spain
- 11.1.5 Italy
- 11.1.6 Spain
- 11.1.7 Belgium
- 11.1.8 Netherland
- 11.1.9 Nordics
- 11.1.10 Rest of Europe
- 12. Asia Pacific Blockchain in Telecom Industry Analysis, Insights and Forecast, 2019-2031
- 12.1. Market Analysis, Insights and Forecast - By Country/Sub-region
- 12.1.1 China
- 12.1.2 Japan
- 12.1.3 India
- 12.1.4 South Korea
- 12.1.5 Southeast Asia
- 12.1.6 Australia
- 12.1.7 Indonesia
- 12.1.8 Phillipes
- 12.1.9 Singapore
- 12.1.10 Thailandc
- 12.1.11 Rest of Asia Pacific
- 13. South America Blockchain in Telecom Industry Analysis, Insights and Forecast, 2019-2031
- 13.1. Market Analysis, Insights and Forecast - By Country/Sub-region
- 13.1.1 Brazil
- 13.1.2 Argentina
- 13.1.3 Peru
- 13.1.4 Chile
- 13.1.5 Colombia
- 13.1.6 Ecuador
- 13.1.7 Venezuela
- 13.1.8 Rest of South America
- 14. North America Blockchain in Telecom Industry Analysis, Insights and Forecast, 2019-2031
- 14.1. Market Analysis, Insights and Forecast - By Country/Sub-region
- 14.1.1 United States
- 14.1.2 Canada
- 14.1.3 Mexico
- 15. MEA Blockchain in Telecom Industry Analysis, Insights and Forecast, 2019-2031
- 15.1. Market Analysis, Insights and Forecast - By Country/Sub-region
- 15.1.1 United Arab Emirates
- 15.1.2 Saudi Arabia
- 15.1.3 South Africa
- 15.1.4 Rest of Middle East and Africa
- 16. Competitive Analysis
- 16.1. Global Market Share Analysis 2024
- 16.2. Company Profiles
- 16.2.1 Blockchain Foundry Inc
- 16.2.1.1. Overview
- 16.2.1.2. Products
- 16.2.1.3. SWOT Analysis
- 16.2.1.4. Recent Developments
- 16.2.1.5. Financials (Based on Availability)
- 16.2.2 Microsoft Corporation
- 16.2.2.1. Overview
- 16.2.2.2. Products
- 16.2.2.3. SWOT Analysis
- 16.2.2.4. Recent Developments
- 16.2.2.5. Financials (Based on Availability)
- 16.2.3 Huawei Technologies Co Ltd
- 16.2.3.1. Overview
- 16.2.3.2. Products
- 16.2.3.3. SWOT Analysis
- 16.2.3.4. Recent Developments
- 16.2.3.5. Financials (Based on Availability)
- 16.2.4 Oracle Corporation
- 16.2.4.1. Overview
- 16.2.4.2. Products
- 16.2.4.3. SWOT Analysis
- 16.2.4.4. Recent Developments
- 16.2.4.5. Financials (Based on Availability)
- 16.2.5 ShoCard Inc (Ping Identity)
- 16.2.5.1. Overview
- 16.2.5.2. Products
- 16.2.5.3. SWOT Analysis
- 16.2.5.4. Recent Developments
- 16.2.5.5. Financials (Based on Availability)
- 16.2.6 SAP SE
- 16.2.6.1. Overview
- 16.2.6.2. Products
- 16.2.6.3. SWOT Analysis
- 16.2.6.4. Recent Developments
- 16.2.6.5. Financials (Based on Availability)
- 16.2.1 Blockchain Foundry Inc
List of Figures
- Figure 1: Global Blockchain in Telecom Industry Revenue Breakdown (Million, %) by Region 2024 & 2032
- Figure 2: North America Blockchain in Telecom Industry Revenue (Million), by Country 2024 & 2032
- Figure 3: North America Blockchain in Telecom Industry Revenue Share (%), by Country 2024 & 2032
- Figure 4: Europe Blockchain in Telecom Industry Revenue (Million), by Country 2024 & 2032
- Figure 5: Europe Blockchain in Telecom Industry Revenue Share (%), by Country 2024 & 2032
- Figure 6: Asia Pacific Blockchain in Telecom Industry Revenue (Million), by Country 2024 & 2032
- Figure 7: Asia Pacific Blockchain in Telecom Industry Revenue Share (%), by Country 2024 & 2032
- Figure 8: South America Blockchain in Telecom Industry Revenue (Million), by Country 2024 & 2032
- Figure 9: South America Blockchain in Telecom Industry Revenue Share (%), by Country 2024 & 2032
- Figure 10: North America Blockchain in Telecom Industry Revenue (Million), by Country 2024 & 2032
- Figure 11: North America Blockchain in Telecom Industry Revenue Share (%), by Country 2024 & 2032
- Figure 12: MEA Blockchain in Telecom Industry Revenue (Million), by Country 2024 & 2032
- Figure 13: MEA Blockchain in Telecom Industry Revenue Share (%), by Country 2024 & 2032
- Figure 14: North America Blockchain in Telecom Industry Revenue (Million), by Application 2024 & 2032
- Figure 15: North America Blockchain in Telecom Industry Revenue Share (%), by Application 2024 & 2032
- Figure 16: North America Blockchain in Telecom Industry Revenue (Million), by Country 2024 & 2032
- Figure 17: North America Blockchain in Telecom Industry Revenue Share (%), by Country 2024 & 2032
- Figure 18: Europe Blockchain in Telecom Industry Revenue (Million), by Application 2024 & 2032
- Figure 19: Europe Blockchain in Telecom Industry Revenue Share (%), by Application 2024 & 2032
- Figure 20: Europe Blockchain in Telecom Industry Revenue (Million), by Country 2024 & 2032
- Figure 21: Europe Blockchain in Telecom Industry Revenue Share (%), by Country 2024 & 2032
- Figure 22: Asia Pacific Blockchain in Telecom Industry Revenue (Million), by Application 2024 & 2032
- Figure 23: Asia Pacific Blockchain in Telecom Industry Revenue Share (%), by Application 2024 & 2032
- Figure 24: Asia Pacific Blockchain in Telecom Industry Revenue (Million), by Country 2024 & 2032
- Figure 25: Asia Pacific Blockchain in Telecom Industry Revenue Share (%), by Country 2024 & 2032
- Figure 26: Rest of the World Blockchain in Telecom Industry Revenue (Million), by Application 2024 & 2032
- Figure 27: Rest of the World Blockchain in Telecom Industry Revenue Share (%), by Application 2024 & 2032
- Figure 28: Rest of the World Blockchain in Telecom Industry Revenue (Million), by Country 2024 & 2032
- Figure 29: Rest of the World Blockchain in Telecom Industry Revenue Share (%), by Country 2024 & 2032
List of Tables
- Table 1: Global Blockchain in Telecom Industry Revenue Million Forecast, by Region 2019 & 2032
- Table 2: Global Blockchain in Telecom Industry Revenue Million Forecast, by Application 2019 & 2032
- Table 3: Global Blockchain in Telecom Industry Revenue Million Forecast, by Region 2019 & 2032
- Table 4: Global Blockchain in Telecom Industry Revenue Million Forecast, by Country 2019 & 2032
- Table 5: United States Blockchain in Telecom Industry Revenue (Million) Forecast, by Application 2019 & 2032
- Table 6: Canada Blockchain in Telecom Industry Revenue (Million) Forecast, by Application 2019 & 2032
- Table 7: Mexico Blockchain in Telecom Industry Revenue (Million) Forecast, by Application 2019 & 2032
- Table 8: Global Blockchain in Telecom Industry Revenue Million Forecast, by Country 2019 & 2032
- Table 9: Germany Blockchain in Telecom Industry Revenue (Million) Forecast, by Application 2019 & 2032
- Table 10: United Kingdom Blockchain in Telecom Industry Revenue (Million) Forecast, by Application 2019 & 2032
- Table 11: France Blockchain in Telecom Industry Revenue (Million) Forecast, by Application 2019 & 2032
- Table 12: Spain Blockchain in Telecom Industry Revenue (Million) Forecast, by Application 2019 & 2032
- Table 13: Italy Blockchain in Telecom Industry Revenue (Million) Forecast, by Application 2019 & 2032
- Table 14: Spain Blockchain in Telecom Industry Revenue (Million) Forecast, by Application 2019 & 2032
- Table 15: Belgium Blockchain in Telecom Industry Revenue (Million) Forecast, by Application 2019 & 2032
- Table 16: Netherland Blockchain in Telecom Industry Revenue (Million) Forecast, by Application 2019 & 2032
- Table 17: Nordics Blockchain in Telecom Industry Revenue (Million) Forecast, by Application 2019 & 2032
- Table 18: Rest of Europe Blockchain in Telecom Industry Revenue (Million) Forecast, by Application 2019 & 2032
- Table 19: Global Blockchain in Telecom Industry Revenue Million Forecast, by Country 2019 & 2032
- Table 20: China Blockchain in Telecom Industry Revenue (Million) Forecast, by Application 2019 & 2032
- Table 21: Japan Blockchain in Telecom Industry Revenue (Million) Forecast, by Application 2019 & 2032
- Table 22: India Blockchain in Telecom Industry Revenue (Million) Forecast, by Application 2019 & 2032
- Table 23: South Korea Blockchain in Telecom Industry Revenue (Million) Forecast, by Application 2019 & 2032
- Table 24: Southeast Asia Blockchain in Telecom Industry Revenue (Million) Forecast, by Application 2019 & 2032
- Table 25: Australia Blockchain in Telecom Industry Revenue (Million) Forecast, by Application 2019 & 2032
- Table 26: Indonesia Blockchain in Telecom Industry Revenue (Million) Forecast, by Application 2019 & 2032
- Table 27: Phillipes Blockchain in Telecom Industry Revenue (Million) Forecast, by Application 2019 & 2032
- Table 28: Singapore Blockchain in Telecom Industry Revenue (Million) Forecast, by Application 2019 & 2032
- Table 29: Thailandc Blockchain in Telecom Industry Revenue (Million) Forecast, by Application 2019 & 2032
- Table 30: Rest of Asia Pacific Blockchain in Telecom Industry Revenue (Million) Forecast, by Application 2019 & 2032
- Table 31: Global Blockchain in Telecom Industry Revenue Million Forecast, by Country 2019 & 2032
- Table 32: Brazil Blockchain in Telecom Industry Revenue (Million) Forecast, by Application 2019 & 2032
- Table 33: Argentina Blockchain in Telecom Industry Revenue (Million) Forecast, by Application 2019 & 2032
- Table 34: Peru Blockchain in Telecom Industry Revenue (Million) Forecast, by Application 2019 & 2032
- Table 35: Chile Blockchain in Telecom Industry Revenue (Million) Forecast, by Application 2019 & 2032
- Table 36: Colombia Blockchain in Telecom Industry Revenue (Million) Forecast, by Application 2019 & 2032
- Table 37: Ecuador Blockchain in Telecom Industry Revenue (Million) Forecast, by Application 2019 & 2032
- Table 38: Venezuela Blockchain in Telecom Industry Revenue (Million) Forecast, by Application 2019 & 2032
- Table 39: Rest of South America Blockchain in Telecom Industry Revenue (Million) Forecast, by Application 2019 & 2032
- Table 40: Global Blockchain in Telecom Industry Revenue Million Forecast, by Country 2019 & 2032
- Table 41: United States Blockchain in Telecom Industry Revenue (Million) Forecast, by Application 2019 & 2032
- Table 42: Canada Blockchain in Telecom Industry Revenue (Million) Forecast, by Application 2019 & 2032
- Table 43: Mexico Blockchain in Telecom Industry Revenue (Million) Forecast, by Application 2019 & 2032
- Table 44: Global Blockchain in Telecom Industry Revenue Million Forecast, by Country 2019 & 2032
- Table 45: United Arab Emirates Blockchain in Telecom Industry Revenue (Million) Forecast, by Application 2019 & 2032
- Table 46: Saudi Arabia Blockchain in Telecom Industry Revenue (Million) Forecast, by Application 2019 & 2032
- Table 47: South Africa Blockchain in Telecom Industry Revenue (Million) Forecast, by Application 2019 & 2032
- Table 48: Rest of Middle East and Africa Blockchain in Telecom Industry Revenue (Million) Forecast, by Application 2019 & 2032
- Table 49: Global Blockchain in Telecom Industry Revenue Million Forecast, by Application 2019 & 2032
- Table 50: Global Blockchain in Telecom Industry Revenue Million Forecast, by Country 2019 & 2032
- Table 51: Global Blockchain in Telecom Industry Revenue Million Forecast, by Application 2019 & 2032
- Table 52: Global Blockchain in Telecom Industry Revenue Million Forecast, by Country 2019 & 2032
- Table 53: Global Blockchain in Telecom Industry Revenue Million Forecast, by Application 2019 & 2032
- Table 54: Global Blockchain in Telecom Industry Revenue Million Forecast, by Country 2019 & 2032
- Table 55: Global Blockchain in Telecom Industry Revenue Million Forecast, by Application 2019 & 2032
- Table 56: Global Blockchain in Telecom Industry Revenue Million Forecast, by Country 2019 & 2032
Frequently Asked Questions
1. What is the projected Compound Annual Growth Rate (CAGR) of the Blockchain in Telecom Industry?
The projected CAGR is approximately 55.13%.
2. Which companies are prominent players in the Blockchain in Telecom Industry?
Key companies in the market include Blockchain Foundry Inc, Microsoft Corporation, Huawei Technologies Co Ltd, Oracle Corporation, ShoCard Inc (Ping Identity), SAP SE.
3. What are the main segments of the Blockchain in Telecom Industry?
The market segments include Application.
4. Can you provide details about the market size?
The market size is estimated to be USD 0.99 Million as of 2022.
5. What are some drivers contributing to market growth?
Focus on Telecom Fraud Detection and Prevention is Driving the Market Growth.
6. What are the notable trends driving market growth?
Smart Contract to Dominate the Market.
7. Are there any restraints impacting market growth?
Lack of Industry Standards.
8. Can you provide examples of recent developments in the market?
November 2022 - In collaboration with TSPs, Trai intended to bring new blockchain tech to curb spam calls and messages. It is working on various technologies to detect spam calls and messages using blockchain technology. Along with this, the regulator is taking action to form a joint committee of regulators (JCOR) consisting of the Telecom Regulatory Authority of India (Trai), Reserve Bank of India (RBI), Securities & Exchanges Board of India (SEBI), and the ministry of consumer affairs (MoCA).
9. What pricing options are available for accessing the report?
Pricing options include single-user, multi-user, and enterprise licenses priced at USD 4750, USD 5250, and USD 8750 respectively.
10. Is the market size provided in terms of value or volume?
The market size is provided in terms of value, measured in Million.
11. Are there any specific market keywords associated with the report?
Yes, the market keyword associated with the report is "Blockchain in Telecom Industry," which aids in identifying and referencing the specific market segment covered.
12. How do I determine which pricing option suits my needs best?
The pricing options vary based on user requirements and access needs. Individual users may opt for single-user licenses, while businesses requiring broader access may choose multi-user or enterprise licenses for cost-effective access to the report.
13. Are there any additional resources or data provided in the Blockchain in Telecom Industry report?
While the report offers comprehensive insights, it's advisable to review the specific contents or supplementary materials provided to ascertain if additional resources or data are available.
14. How can I stay updated on further developments or reports in the Blockchain in Telecom Industry?
To stay informed about further developments, trends, and reports in the Blockchain in Telecom Industry, consider subscribing to industry newsletters, following relevant companies and organizations, or regularly checking reputable industry news sources and publications.
Methodology
Step 1 - Identification of Relevant Samples Size from Population Database


Step 2 - Approaches for Defining Global Market Size (Value, Volume* & Price*)

Note*: In applicable scenarios
Step 3 - Data Sources
Primary Research
- Web Analytics
- Survey Reports
- Research Institute
- Latest Research Reports
- Opinion Leaders
Secondary Research
- Annual Reports
- White Paper
- Latest Press Release
- Industry Association
- Paid Database
- Investor Presentations

Step 4 - Data Triangulation
Involves using different sources of information in order to increase the validity of a study
These sources are likely to be stakeholders in a program - participants, other researchers, program staff, other community members, and so on.
Then we put all data in single framework & apply various statistical tools to find out the dynamic on the market.
During the analysis stage, feedback from the stakeholder groups would be compared to determine areas of agreement as well as areas of divergence


