
Key Insights
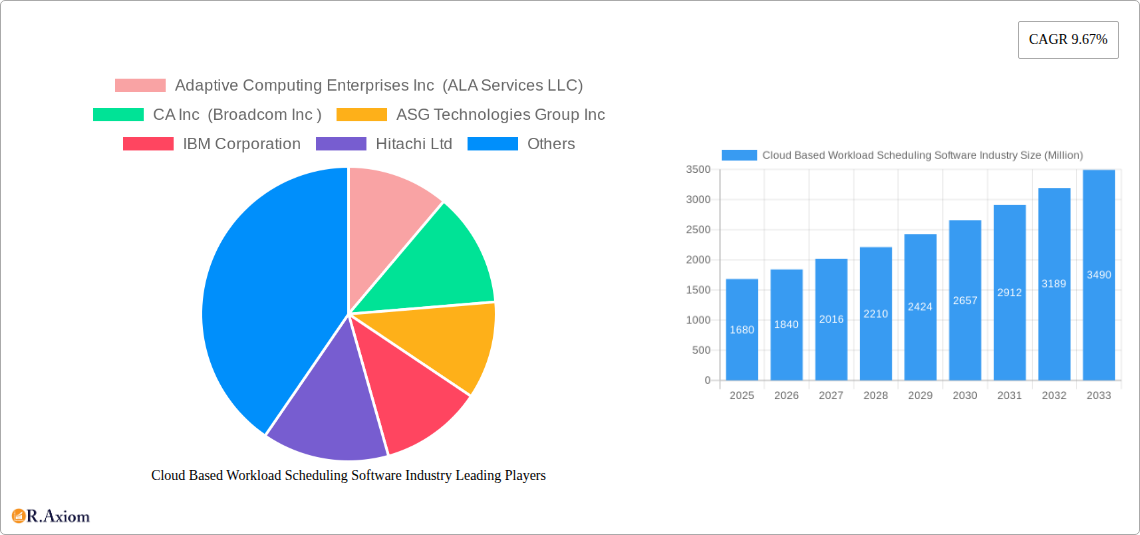
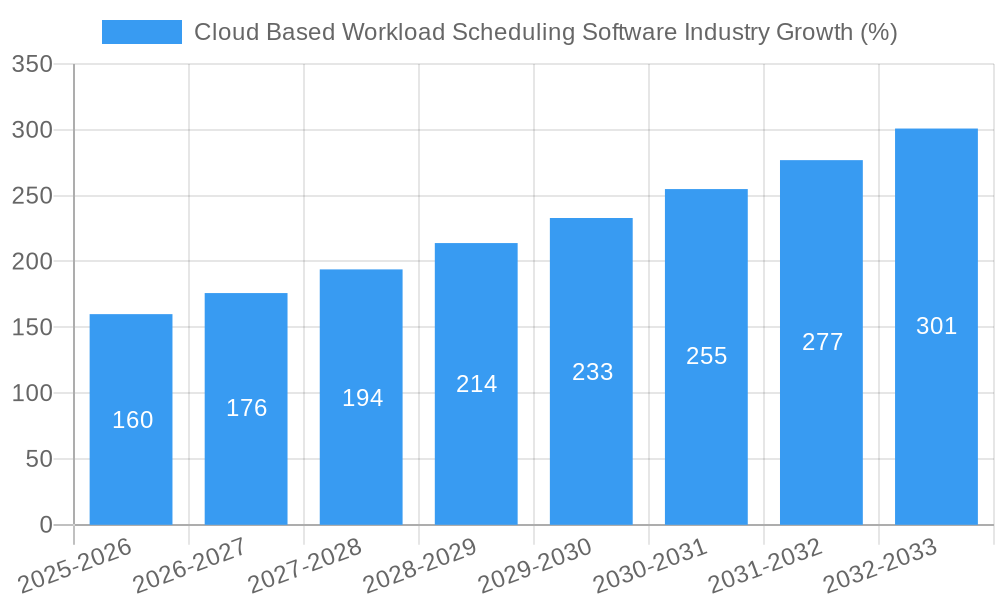
The cloud-based workload scheduling software market is experiencing robust growth, projected to reach \$1.68 billion in 2025 and maintain a Compound Annual Growth Rate (CAGR) of 9.67% from 2025 to 2033. This expansion is fueled by several key drivers. The increasing adoption of cloud computing across various sectors, including corporate, government, and other end-users, necessitates efficient workload management solutions. Organizations are increasingly seeking to optimize resource utilization, reduce operational costs, and enhance application performance, all of which are addressed by sophisticated cloud-based workload scheduling software. Further driving growth is the rise of hybrid and multi-cloud environments, requiring solutions capable of managing workloads across diverse platforms. The trend towards automation and AI-powered orchestration within IT operations also contributes to market growth, as organizations strive for greater efficiency and agility in their IT infrastructure.
However, the market also faces certain restraints. The complexity of integrating workload scheduling software with existing IT infrastructures can pose a challenge for some organizations. Furthermore, concerns around data security and compliance in cloud environments can act as a barrier to adoption, particularly within highly regulated sectors. Despite these challenges, the long-term outlook for the cloud-based workload scheduling software market remains positive, driven by the ongoing digital transformation across industries and the persistent need for optimized resource management in increasingly complex IT landscapes. The market is segmented by cloud deployment model (public, private, hybrid) and end-user (corporate, government, other), reflecting the diverse applications and deployment strategies of this technology. Leading vendors like VMware, IBM, and others are continuously innovating to meet evolving market needs and strengthen their market positions.
This comprehensive report provides a detailed analysis of the cloud-based workload scheduling software industry, encompassing market size, segmentation, growth drivers, challenges, and key players. The study period covers 2019-2033, with 2025 as the base and estimated year, and a forecast period of 2025-2033. The historical period analyzed is 2019-2024. The report is designed for industry stakeholders, investors, and businesses seeking actionable insights into this rapidly evolving market. The global market size in 2025 is estimated at $XX Million.
Cloud Based Workload Scheduling Software Industry Market Concentration & Innovation
The cloud-based workload scheduling software market exhibits a moderately concentrated landscape, with several key players holding significant market share. However, the market is also characterized by ongoing innovation and new entrants, driven by advancements in cloud computing, artificial intelligence, and automation technologies. The market share of the top 5 players is estimated at xx%, reflecting a competitive but not overly dominated structure. Mergers and acquisitions (M&A) have played a significant role in shaping the market dynamics. For example, Redwood Software's acquisition of Tidal Software in January 2023 significantly expanded its product portfolio and market reach. The total value of M&A deals in the sector during the historical period (2019-2024) is estimated at $xx Million. Regulatory frameworks, while not overly restrictive, impact data privacy and security aspects, influencing software development and deployment strategies. Product substitutes, such as in-house developed scheduling systems, exist but often lack the scalability, functionality, and support offered by commercial solutions. End-user trends show a strong preference for cloud-based solutions due to cost-effectiveness, scalability, and accessibility.
- Market Concentration: Top 5 players hold xx% market share.
- M&A Activity: Total deal value (2019-2024) estimated at $xx Million. Significant deal: Redwood Software's acquisition of Tidal Software (Jan 2023).
- Innovation Drivers: Advancements in cloud computing, AI, and automation.
- Regulatory Framework: Impacts data privacy and security.
- Product Substitutes: In-house solutions, limited in scalability and functionality.
- End-User Trends: Strong preference for cloud-based solutions.
Cloud Based Workload Scheduling Software Industry Industry Trends & Insights
The cloud-based workload scheduling software market is experiencing robust growth, driven by several key factors. The increasing adoption of cloud computing across diverse industries is a primary driver, fueling demand for efficient workload management solutions. Technological disruptions, such as the rise of serverless computing and containerization, are reshaping the market landscape, demanding adaptable scheduling software capable of managing these new architectures. Consumer preferences are shifting towards solutions offering enhanced automation, AI-powered optimization, and seamless integration with existing IT infrastructure. The competitive dynamics are intense, with existing players striving to innovate and expand their offerings while new entrants challenge the status quo. The Compound Annual Growth Rate (CAGR) for the forecast period (2025-2033) is projected to be xx%, indicating significant market expansion. Market penetration currently stands at xx% but is projected to increase to xx% by 2033.
Dominant Markets & Segments in Cloud Based Workload Scheduling Software Industry
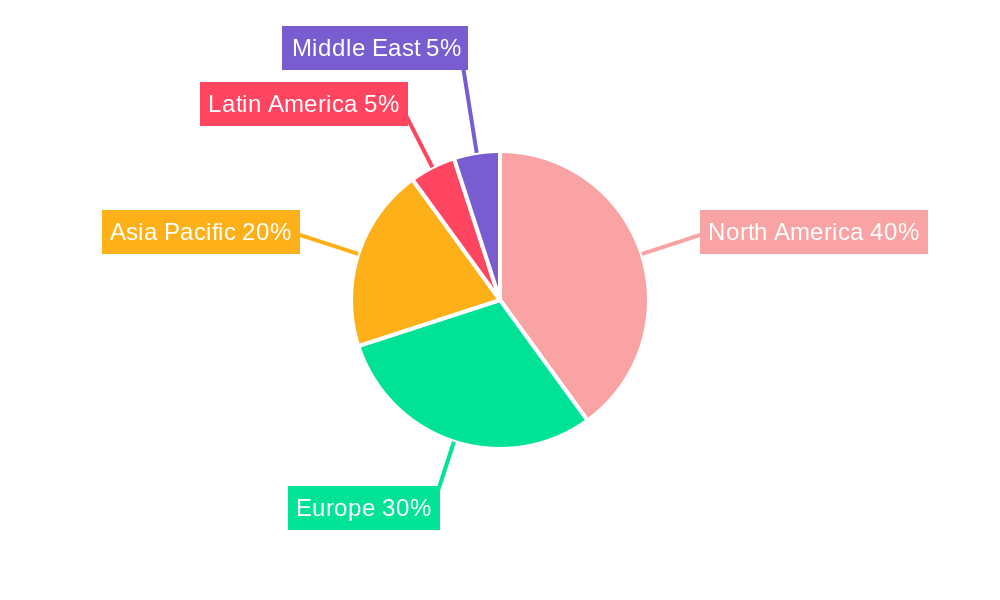
The public cloud segment dominates the cloud-based workload scheduling software market, driven by its scalability, cost-effectiveness, and ease of deployment. The corporate end-user segment constitutes the largest share of the market due to the high volume of workloads managed by large enterprises. North America currently holds the largest regional market share due to high cloud adoption rates and a strong technology infrastructure.
- By Cloud:
- Public Cloud: Dominant segment due to scalability and cost-effectiveness.
- Private Cloud: Smaller segment, but growing due to security concerns.
- Hybrid Cloud: Increasing adoption, driven by the need for flexibility.
- By End User:
- Corporate: Largest segment, driven by high workload volumes in enterprises.
- Government: Growing segment, fueled by modernization initiatives.
- Other End Users: A smaller, diverse segment.
- Regional Dominance: North America holds the largest market share, driven by high cloud adoption rates and robust infrastructure.
Cloud Based Workload Scheduling Software Industry Product Developments
Recent product innovations focus on enhancing automation capabilities, integrating AI for workload optimization, and improving security features. New applications are emerging in areas such as serverless computing, container orchestration, and big data processing. Competitive advantages are increasingly driven by superior integration capabilities, intuitive user interfaces, and strong customer support. Technological trends are shaping the development of more intelligent, adaptive scheduling solutions.
Report Scope & Segmentation Analysis
This report segments the cloud-based workload scheduling software market by cloud type (public, private, hybrid) and end-user (corporate, government, other). Each segment's growth projection, market size, and competitive dynamics are analyzed. Public cloud is expected to witness the highest growth, while corporate end-users will remain the largest segment. The competitive landscape is characterized by both established players and new entrants, leading to intense competition and innovation.
Key Drivers of Cloud Based Workload Scheduling Software Industry Growth
The growth of the cloud-based workload scheduling software market is fueled by several key drivers: the increasing adoption of cloud computing across various industries, the need for efficient workload management in complex IT environments, the rise of AI and automation technologies, and the growing demand for enhanced security and scalability. Government initiatives promoting cloud adoption further boost market growth.
Challenges in the Cloud Based Workload Scheduling Software Industry Sector
The industry faces challenges including the complexity of integrating with existing IT infrastructures, ensuring data security and privacy, addressing vendor lock-in concerns, and managing the costs associated with cloud services. Competition among vendors also presents significant challenges, necessitating continuous innovation and improvement to maintain a competitive edge.
Emerging Opportunities in Cloud Based Workload Scheduling Software Industry
Emerging opportunities exist in areas such as serverless computing, edge computing, and AI-driven workload optimization. The growing demand for hybrid and multi-cloud management solutions also presents significant opportunities. Expanding into new geographic markets and addressing niche industry needs also offers potential growth avenues.
Leading Players in the Cloud Based Workload Scheduling Software Industry Market
- Adaptive Computing Enterprises Inc (ALA Services LLC)
- Broadcom Inc (CA Inc)
- ASG Technologies Group Inc
- IBM Corporation
- Hitachi Ltd
- Cisco Systems Inc
- Red Hat Inc (ManageIQ Inc)
- VMware Inc
- BMC Software (Boxer Parent Company Inc)
Key Developments in Cloud Based Workload Scheduling Software Industry Industry
- November 2023: IBM announced a strategic partnership with AWS for Amazon RDS for Db2, expanding hybrid cloud capabilities for AI workloads.
- January 2023: Redwood Software acquired Tidal Software, strengthening its position in enterprise workload automation.
Strategic Outlook for Cloud Based Workload Scheduling Software Industry Market
The future of the cloud-based workload scheduling software market looks bright, driven by continued cloud adoption, technological advancements, and increasing demand for efficient and secure workload management solutions. Focusing on AI-powered optimization, enhanced security features, and seamless integration with emerging technologies will be crucial for success in this dynamic market. Expansion into new segments and geographic markets presents significant growth opportunities for market players.
Cloud Based Workload Scheduling Software Industry Segmentation
-
1. Cloud
- 1.1. Public
- 1.2. Private
- 1.3. Hybrid
-
2. End User
- 2.1. Corporate
- 2.2. Government
- 2.3. Other End Users
Cloud Based Workload Scheduling Software Industry Segmentation By Geography
- 1. North America
- 2. Europe
- 3. Asia Pacific
- 4. Latin America
- 5. Middle East
Cloud Based Workload Scheduling Software Industry REPORT HIGHLIGHTS
| Aspects | Details |
|---|---|
| Study Period | 2019-2033 |
| Base Year | 2024 |
| Estimated Year | 2025 |
| Forecast Period | 2025-2033 |
| Historical Period | 2019-2024 |
| Growth Rate | CAGR of 9.67% from 2019-2033 |
| Segmentation |
|
Table of Contents
- 1. Introduction
- 1.1. Research Scope
- 1.2. Market Segmentation
- 1.3. Research Methodology
- 1.4. Definitions and Assumptions
- 2. Executive Summary
- 2.1. Introduction
- 3. Market Dynamics
- 3.1. Introduction
- 3.2. Market Drivers
- 3.2.1. Enterprises Shifting Towards Cloud-Based Services; Availability of Analytical tools in Cloud based Workload Scheduling Software
- 3.3. Market Restrains
- 3.3.1. Opensource-Free Software Hampering the Growth of Market
- 3.4. Market Trends
- 3.4.1. Public Cloud-Based Services is set to hold the largest market share
- 4. Market Factor Analysis
- 4.1. Porters Five Forces
- 4.2. Supply/Value Chain
- 4.3. PESTEL analysis
- 4.4. Market Entropy
- 4.5. Patent/Trademark Analysis
- 5. Global Cloud Based Workload Scheduling Software Industry Analysis, Insights and Forecast, 2019-2031
- 5.1. Market Analysis, Insights and Forecast - by Cloud
- 5.1.1. Public
- 5.1.2. Private
- 5.1.3. Hybrid
- 5.2. Market Analysis, Insights and Forecast - by End User
- 5.2.1. Corporate
- 5.2.2. Government
- 5.2.3. Other End Users
- 5.3. Market Analysis, Insights and Forecast - by Region
- 5.3.1. North America
- 5.3.2. Europe
- 5.3.3. Asia Pacific
- 5.3.4. Latin America
- 5.3.5. Middle East
- 5.1. Market Analysis, Insights and Forecast - by Cloud
- 6. North America Cloud Based Workload Scheduling Software Industry Analysis, Insights and Forecast, 2019-2031
- 6.1. Market Analysis, Insights and Forecast - by Cloud
- 6.1.1. Public
- 6.1.2. Private
- 6.1.3. Hybrid
- 6.2. Market Analysis, Insights and Forecast - by End User
- 6.2.1. Corporate
- 6.2.2. Government
- 6.2.3. Other End Users
- 6.1. Market Analysis, Insights and Forecast - by Cloud
- 7. Europe Cloud Based Workload Scheduling Software Industry Analysis, Insights and Forecast, 2019-2031
- 7.1. Market Analysis, Insights and Forecast - by Cloud
- 7.1.1. Public
- 7.1.2. Private
- 7.1.3. Hybrid
- 7.2. Market Analysis, Insights and Forecast - by End User
- 7.2.1. Corporate
- 7.2.2. Government
- 7.2.3. Other End Users
- 7.1. Market Analysis, Insights and Forecast - by Cloud
- 8. Asia Pacific Cloud Based Workload Scheduling Software Industry Analysis, Insights and Forecast, 2019-2031
- 8.1. Market Analysis, Insights and Forecast - by Cloud
- 8.1.1. Public
- 8.1.2. Private
- 8.1.3. Hybrid
- 8.2. Market Analysis, Insights and Forecast - by End User
- 8.2.1. Corporate
- 8.2.2. Government
- 8.2.3. Other End Users
- 8.1. Market Analysis, Insights and Forecast - by Cloud
- 9. Latin America Cloud Based Workload Scheduling Software Industry Analysis, Insights and Forecast, 2019-2031
- 9.1. Market Analysis, Insights and Forecast - by Cloud
- 9.1.1. Public
- 9.1.2. Private
- 9.1.3. Hybrid
- 9.2. Market Analysis, Insights and Forecast - by End User
- 9.2.1. Corporate
- 9.2.2. Government
- 9.2.3. Other End Users
- 9.1. Market Analysis, Insights and Forecast - by Cloud
- 10. Middle East Cloud Based Workload Scheduling Software Industry Analysis, Insights and Forecast, 2019-2031
- 10.1. Market Analysis, Insights and Forecast - by Cloud
- 10.1.1. Public
- 10.1.2. Private
- 10.1.3. Hybrid
- 10.2. Market Analysis, Insights and Forecast - by End User
- 10.2.1. Corporate
- 10.2.2. Government
- 10.2.3. Other End Users
- 10.1. Market Analysis, Insights and Forecast - by Cloud
- 11. North America Cloud Based Workload Scheduling Software Industry Analysis, Insights and Forecast, 2019-2031
- 11.1. Market Analysis, Insights and Forecast - By Country/Sub-region
- 11.1.1.
- 12. Europe Cloud Based Workload Scheduling Software Industry Analysis, Insights and Forecast, 2019-2031
- 12.1. Market Analysis, Insights and Forecast - By Country/Sub-region
- 12.1.1.
- 13. Asia Pacific Cloud Based Workload Scheduling Software Industry Analysis, Insights and Forecast, 2019-2031
- 13.1. Market Analysis, Insights and Forecast - By Country/Sub-region
- 13.1.1.
- 14. Latin America Cloud Based Workload Scheduling Software Industry Analysis, Insights and Forecast, 2019-2031
- 14.1. Market Analysis, Insights and Forecast - By Country/Sub-region
- 14.1.1.
- 15. Middle East Cloud Based Workload Scheduling Software Industry Analysis, Insights and Forecast, 2019-2031
- 15.1. Market Analysis, Insights and Forecast - By Country/Sub-region
- 15.1.1.
- 16. Competitive Analysis
- 16.1. Global Market Share Analysis 2024
- 16.2. Company Profiles
- 16.2.1 Adaptive Computing Enterprises Inc (ALA Services LLC)
- 16.2.1.1. Overview
- 16.2.1.2. Products
- 16.2.1.3. SWOT Analysis
- 16.2.1.4. Recent Developments
- 16.2.1.5. Financials (Based on Availability)
- 16.2.2 CA Inc (Broadcom Inc )
- 16.2.2.1. Overview
- 16.2.2.2. Products
- 16.2.2.3. SWOT Analysis
- 16.2.2.4. Recent Developments
- 16.2.2.5. Financials (Based on Availability)
- 16.2.3 ASG Technologies Group Inc
- 16.2.3.1. Overview
- 16.2.3.2. Products
- 16.2.3.3. SWOT Analysis
- 16.2.3.4. Recent Developments
- 16.2.3.5. Financials (Based on Availability)
- 16.2.4 IBM Corporation
- 16.2.4.1. Overview
- 16.2.4.2. Products
- 16.2.4.3. SWOT Analysis
- 16.2.4.4. Recent Developments
- 16.2.4.5. Financials (Based on Availability)
- 16.2.5 Hitachi Ltd
- 16.2.5.1. Overview
- 16.2.5.2. Products
- 16.2.5.3. SWOT Analysis
- 16.2.5.4. Recent Developments
- 16.2.5.5. Financials (Based on Availability)
- 16.2.6 Cisco Systems Inc
- 16.2.6.1. Overview
- 16.2.6.2. Products
- 16.2.6.3. SWOT Analysis
- 16.2.6.4. Recent Developments
- 16.2.6.5. Financials (Based on Availability)
- 16.2.7 ManageIQ Inc (Red Hat Inc )*List Not Exhaustive
- 16.2.7.1. Overview
- 16.2.7.2. Products
- 16.2.7.3. SWOT Analysis
- 16.2.7.4. Recent Developments
- 16.2.7.5. Financials (Based on Availability)
- 16.2.8 VMware Inc
- 16.2.8.1. Overview
- 16.2.8.2. Products
- 16.2.8.3. SWOT Analysis
- 16.2.8.4. Recent Developments
- 16.2.8.5. Financials (Based on Availability)
- 16.2.9 BMC Software (Boxer Parent Company Inc )
- 16.2.9.1. Overview
- 16.2.9.2. Products
- 16.2.9.3. SWOT Analysis
- 16.2.9.4. Recent Developments
- 16.2.9.5. Financials (Based on Availability)
- 16.2.1 Adaptive Computing Enterprises Inc (ALA Services LLC)
List of Figures
- Figure 1: Global Cloud Based Workload Scheduling Software Industry Revenue Breakdown (Million, %) by Region 2024 & 2032
- Figure 2: North America Cloud Based Workload Scheduling Software Industry Revenue (Million), by Country 2024 & 2032
- Figure 3: North America Cloud Based Workload Scheduling Software Industry Revenue Share (%), by Country 2024 & 2032
- Figure 4: Europe Cloud Based Workload Scheduling Software Industry Revenue (Million), by Country 2024 & 2032
- Figure 5: Europe Cloud Based Workload Scheduling Software Industry Revenue Share (%), by Country 2024 & 2032
- Figure 6: Asia Pacific Cloud Based Workload Scheduling Software Industry Revenue (Million), by Country 2024 & 2032
- Figure 7: Asia Pacific Cloud Based Workload Scheduling Software Industry Revenue Share (%), by Country 2024 & 2032
- Figure 8: Latin America Cloud Based Workload Scheduling Software Industry Revenue (Million), by Country 2024 & 2032
- Figure 9: Latin America Cloud Based Workload Scheduling Software Industry Revenue Share (%), by Country 2024 & 2032
- Figure 10: Middle East Cloud Based Workload Scheduling Software Industry Revenue (Million), by Country 2024 & 2032
- Figure 11: Middle East Cloud Based Workload Scheduling Software Industry Revenue Share (%), by Country 2024 & 2032
- Figure 12: North America Cloud Based Workload Scheduling Software Industry Revenue (Million), by Cloud 2024 & 2032
- Figure 13: North America Cloud Based Workload Scheduling Software Industry Revenue Share (%), by Cloud 2024 & 2032
- Figure 14: North America Cloud Based Workload Scheduling Software Industry Revenue (Million), by End User 2024 & 2032
- Figure 15: North America Cloud Based Workload Scheduling Software Industry Revenue Share (%), by End User 2024 & 2032
- Figure 16: North America Cloud Based Workload Scheduling Software Industry Revenue (Million), by Country 2024 & 2032
- Figure 17: North America Cloud Based Workload Scheduling Software Industry Revenue Share (%), by Country 2024 & 2032
- Figure 18: Europe Cloud Based Workload Scheduling Software Industry Revenue (Million), by Cloud 2024 & 2032
- Figure 19: Europe Cloud Based Workload Scheduling Software Industry Revenue Share (%), by Cloud 2024 & 2032
- Figure 20: Europe Cloud Based Workload Scheduling Software Industry Revenue (Million), by End User 2024 & 2032
- Figure 21: Europe Cloud Based Workload Scheduling Software Industry Revenue Share (%), by End User 2024 & 2032
- Figure 22: Europe Cloud Based Workload Scheduling Software Industry Revenue (Million), by Country 2024 & 2032
- Figure 23: Europe Cloud Based Workload Scheduling Software Industry Revenue Share (%), by Country 2024 & 2032
- Figure 24: Asia Pacific Cloud Based Workload Scheduling Software Industry Revenue (Million), by Cloud 2024 & 2032
- Figure 25: Asia Pacific Cloud Based Workload Scheduling Software Industry Revenue Share (%), by Cloud 2024 & 2032
- Figure 26: Asia Pacific Cloud Based Workload Scheduling Software Industry Revenue (Million), by End User 2024 & 2032
- Figure 27: Asia Pacific Cloud Based Workload Scheduling Software Industry Revenue Share (%), by End User 2024 & 2032
- Figure 28: Asia Pacific Cloud Based Workload Scheduling Software Industry Revenue (Million), by Country 2024 & 2032
- Figure 29: Asia Pacific Cloud Based Workload Scheduling Software Industry Revenue Share (%), by Country 2024 & 2032
- Figure 30: Latin America Cloud Based Workload Scheduling Software Industry Revenue (Million), by Cloud 2024 & 2032
- Figure 31: Latin America Cloud Based Workload Scheduling Software Industry Revenue Share (%), by Cloud 2024 & 2032
- Figure 32: Latin America Cloud Based Workload Scheduling Software Industry Revenue (Million), by End User 2024 & 2032
- Figure 33: Latin America Cloud Based Workload Scheduling Software Industry Revenue Share (%), by End User 2024 & 2032
- Figure 34: Latin America Cloud Based Workload Scheduling Software Industry Revenue (Million), by Country 2024 & 2032
- Figure 35: Latin America Cloud Based Workload Scheduling Software Industry Revenue Share (%), by Country 2024 & 2032
- Figure 36: Middle East Cloud Based Workload Scheduling Software Industry Revenue (Million), by Cloud 2024 & 2032
- Figure 37: Middle East Cloud Based Workload Scheduling Software Industry Revenue Share (%), by Cloud 2024 & 2032
- Figure 38: Middle East Cloud Based Workload Scheduling Software Industry Revenue (Million), by End User 2024 & 2032
- Figure 39: Middle East Cloud Based Workload Scheduling Software Industry Revenue Share (%), by End User 2024 & 2032
- Figure 40: Middle East Cloud Based Workload Scheduling Software Industry Revenue (Million), by Country 2024 & 2032
- Figure 41: Middle East Cloud Based Workload Scheduling Software Industry Revenue Share (%), by Country 2024 & 2032
List of Tables
- Table 1: Global Cloud Based Workload Scheduling Software Industry Revenue Million Forecast, by Region 2019 & 2032
- Table 2: Global Cloud Based Workload Scheduling Software Industry Revenue Million Forecast, by Cloud 2019 & 2032
- Table 3: Global Cloud Based Workload Scheduling Software Industry Revenue Million Forecast, by End User 2019 & 2032
- Table 4: Global Cloud Based Workload Scheduling Software Industry Revenue Million Forecast, by Region 2019 & 2032
- Table 5: Global Cloud Based Workload Scheduling Software Industry Revenue Million Forecast, by Country 2019 & 2032
- Table 6: Cloud Based Workload Scheduling Software Industry Revenue (Million) Forecast, by Application 2019 & 2032
- Table 7: Global Cloud Based Workload Scheduling Software Industry Revenue Million Forecast, by Country 2019 & 2032
- Table 8: Cloud Based Workload Scheduling Software Industry Revenue (Million) Forecast, by Application 2019 & 2032
- Table 9: Global Cloud Based Workload Scheduling Software Industry Revenue Million Forecast, by Country 2019 & 2032
- Table 10: Cloud Based Workload Scheduling Software Industry Revenue (Million) Forecast, by Application 2019 & 2032
- Table 11: Global Cloud Based Workload Scheduling Software Industry Revenue Million Forecast, by Country 2019 & 2032
- Table 12: Cloud Based Workload Scheduling Software Industry Revenue (Million) Forecast, by Application 2019 & 2032
- Table 13: Global Cloud Based Workload Scheduling Software Industry Revenue Million Forecast, by Country 2019 & 2032
- Table 14: Cloud Based Workload Scheduling Software Industry Revenue (Million) Forecast, by Application 2019 & 2032
- Table 15: Global Cloud Based Workload Scheduling Software Industry Revenue Million Forecast, by Cloud 2019 & 2032
- Table 16: Global Cloud Based Workload Scheduling Software Industry Revenue Million Forecast, by End User 2019 & 2032
- Table 17: Global Cloud Based Workload Scheduling Software Industry Revenue Million Forecast, by Country 2019 & 2032
- Table 18: Global Cloud Based Workload Scheduling Software Industry Revenue Million Forecast, by Cloud 2019 & 2032
- Table 19: Global Cloud Based Workload Scheduling Software Industry Revenue Million Forecast, by End User 2019 & 2032
- Table 20: Global Cloud Based Workload Scheduling Software Industry Revenue Million Forecast, by Country 2019 & 2032
- Table 21: Global Cloud Based Workload Scheduling Software Industry Revenue Million Forecast, by Cloud 2019 & 2032
- Table 22: Global Cloud Based Workload Scheduling Software Industry Revenue Million Forecast, by End User 2019 & 2032
- Table 23: Global Cloud Based Workload Scheduling Software Industry Revenue Million Forecast, by Country 2019 & 2032
- Table 24: Global Cloud Based Workload Scheduling Software Industry Revenue Million Forecast, by Cloud 2019 & 2032
- Table 25: Global Cloud Based Workload Scheduling Software Industry Revenue Million Forecast, by End User 2019 & 2032
- Table 26: Global Cloud Based Workload Scheduling Software Industry Revenue Million Forecast, by Country 2019 & 2032
- Table 27: Global Cloud Based Workload Scheduling Software Industry Revenue Million Forecast, by Cloud 2019 & 2032
- Table 28: Global Cloud Based Workload Scheduling Software Industry Revenue Million Forecast, by End User 2019 & 2032
- Table 29: Global Cloud Based Workload Scheduling Software Industry Revenue Million Forecast, by Country 2019 & 2032
Frequently Asked Questions
1. What is the projected Compound Annual Growth Rate (CAGR) of the Cloud Based Workload Scheduling Software Industry?
The projected CAGR is approximately 9.67%.
2. Which companies are prominent players in the Cloud Based Workload Scheduling Software Industry?
Key companies in the market include Adaptive Computing Enterprises Inc (ALA Services LLC), CA Inc (Broadcom Inc ), ASG Technologies Group Inc, IBM Corporation, Hitachi Ltd, Cisco Systems Inc, ManageIQ Inc (Red Hat Inc )*List Not Exhaustive, VMware Inc, BMC Software (Boxer Parent Company Inc ).
3. What are the main segments of the Cloud Based Workload Scheduling Software Industry?
The market segments include Cloud, End User.
4. Can you provide details about the market size?
The market size is estimated to be USD 1.68 Million as of 2022.
5. What are some drivers contributing to market growth?
Enterprises Shifting Towards Cloud-Based Services; Availability of Analytical tools in Cloud based Workload Scheduling Software.
6. What are the notable trends driving market growth?
Public Cloud-Based Services is set to hold the largest market share.
7. Are there any restraints impacting market growth?
Opensource-Free Software Hampering the Growth of Market.
8. Can you provide examples of recent developments in the market?
November 2023: IBM announced a strategic partnership with Amazon Web Services (AWS) on Amazon Relational Database Service (Amazon RDS) for Db2, a fully managed cloud offering designed to make it easier for database customers to manage data for artificial intelligence (AI) workloads across hybrid cloud environments. Amazon RDS for Db2 combines the operational expertise and ease of use of Amazon RDS to automate database administration with IBM Db2's decades of experience running mission-critical workloads for some of the world's significant banks, supply chain operations, and retail/e-commerce businesses.
9. What pricing options are available for accessing the report?
Pricing options include single-user, multi-user, and enterprise licenses priced at USD 4750, USD 5250, and USD 8750 respectively.
10. Is the market size provided in terms of value or volume?
The market size is provided in terms of value, measured in Million.
11. Are there any specific market keywords associated with the report?
Yes, the market keyword associated with the report is "Cloud Based Workload Scheduling Software Industry," which aids in identifying and referencing the specific market segment covered.
12. How do I determine which pricing option suits my needs best?
The pricing options vary based on user requirements and access needs. Individual users may opt for single-user licenses, while businesses requiring broader access may choose multi-user or enterprise licenses for cost-effective access to the report.
13. Are there any additional resources or data provided in the Cloud Based Workload Scheduling Software Industry report?
While the report offers comprehensive insights, it's advisable to review the specific contents or supplementary materials provided to ascertain if additional resources or data are available.
14. How can I stay updated on further developments or reports in the Cloud Based Workload Scheduling Software Industry?
To stay informed about further developments, trends, and reports in the Cloud Based Workload Scheduling Software Industry, consider subscribing to industry newsletters, following relevant companies and organizations, or regularly checking reputable industry news sources and publications.
Methodology
Step 1 - Identification of Relevant Samples Size from Population Database


Step 2 - Approaches for Defining Global Market Size (Value, Volume* & Price*)

Note*: In applicable scenarios
Step 3 - Data Sources
Primary Research
- Web Analytics
- Survey Reports
- Research Institute
- Latest Research Reports
- Opinion Leaders
Secondary Research
- Annual Reports
- White Paper
- Latest Press Release
- Industry Association
- Paid Database
- Investor Presentations

Step 4 - Data Triangulation
Involves using different sources of information in order to increase the validity of a study
These sources are likely to be stakeholders in a program - participants, other researchers, program staff, other community members, and so on.
Then we put all data in single framework & apply various statistical tools to find out the dynamic on the market.
During the analysis stage, feedback from the stakeholder groups would be compared to determine areas of agreement as well as areas of divergence


