
Key Insights
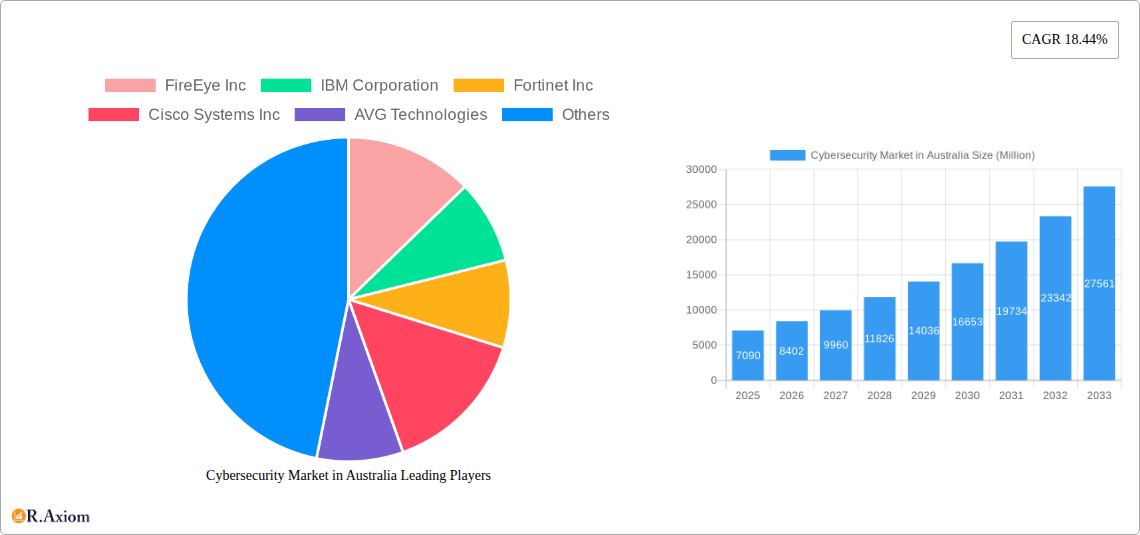
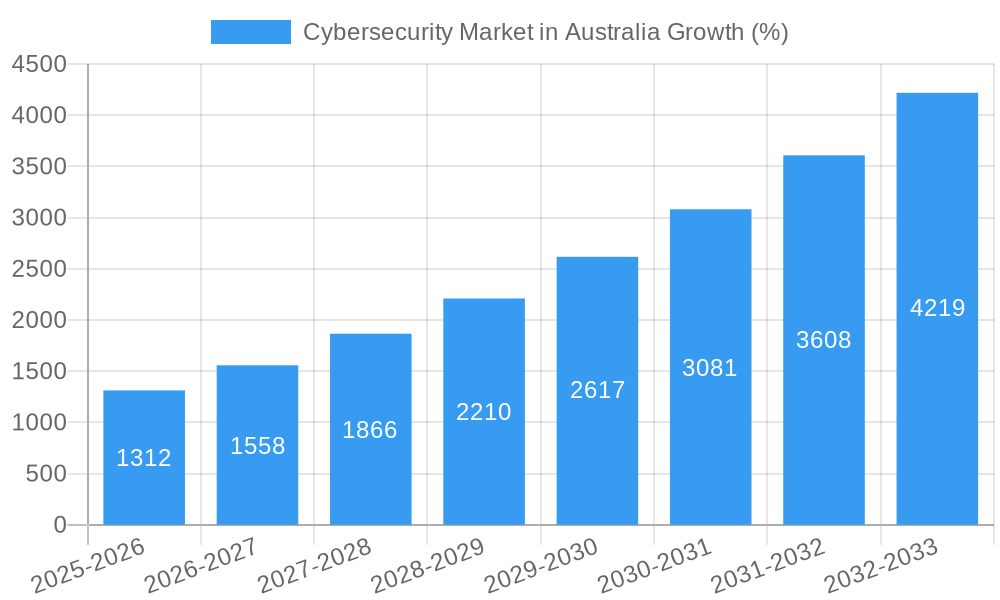
The Australian cybersecurity market, valued at approximately $7.09 billion in 2025, is experiencing robust growth, projected to expand at a compound annual growth rate (CAGR) of 18.44% from 2025 to 2033. This significant expansion is driven by several key factors. Increasing cyber threats targeting critical infrastructure, financial institutions (BFSI), and government agencies necessitate heightened security measures. The rising adoption of cloud computing and the expanding Internet of Things (IoT) ecosystem also contribute to market growth, as they introduce new attack vectors and vulnerabilities. Furthermore, stringent government regulations mandating data protection and privacy, such as the Notifiable Data Breaches scheme, are compelling organizations to invest heavily in advanced cybersecurity solutions. The market's diverse segments, including application security, cloud security, and identity and access management (IAM), offer a broad range of opportunities for vendors. Strong demand for managed security services, reflecting a shift towards outsourcing cybersecurity functions, further fuels market expansion.
The Australian cybersecurity landscape is characterized by a blend of established players and emerging innovative companies. While large multinational corporations such as IBM and Cisco hold significant market share, smaller, specialized firms are also thriving, offering niche solutions and expertise. The market's segmentation by end-user industry reveals significant opportunities across various sectors. BFSI and government sectors are major contributors, exhibiting strong investment in cybersecurity due to heightened regulatory scrutiny and the sensitivity of their data. However, growth is also evident in healthcare, aerospace & defense, and retail sectors, all increasingly vulnerable to sophisticated cyberattacks. The adoption of on-premise and cloud-based security solutions is expected to remain balanced, reflecting the diverse needs and IT infrastructures of different organizations. Future growth will likely be influenced by advancements in AI-powered threat detection, increased adoption of zero trust security models, and the expanding adoption of cybersecurity mesh architecture.
Cybersecurity Market in Australia: A Comprehensive Report (2019-2033)
This in-depth report provides a comprehensive analysis of the Australian cybersecurity market, covering market size, growth drivers, challenges, key players, and future outlook. The study period spans from 2019 to 2033, with 2025 as the base and estimated year. The forecast period is 2025-2033, and the historical period is 2019-2024. This report is essential for businesses, investors, and policymakers seeking to understand and navigate this rapidly evolving market. The total market value in 2025 is estimated at AU$ xx Million.
Cybersecurity Market in Australia Market Concentration & Innovation
The Australian cybersecurity market exhibits a moderately concentrated landscape, with a handful of multinational corporations holding significant market share. Key players like IBM Corporation, Cisco Systems Inc, Fortinet Inc, and Check Point Software Technologies Ltd dominate various segments. However, a vibrant ecosystem of smaller, specialized firms also contributes significantly to innovation and caters to niche market needs. Market share estimates for 2025 suggest IBM holds approximately 15%, Cisco at 12%, Fortinet at 10%, and Check Point at 8%, with the remaining share distributed among other players and smaller firms.
- Market Concentration: The Herfindahl-Hirschman Index (HHI) for the Australian cybersecurity market in 2025 is estimated at xx, indicating a moderately concentrated market.
- Innovation Drivers: Government initiatives promoting cybersecurity awareness, increasing cyber threats, and the growing adoption of cloud technologies are key drivers of innovation.
- Regulatory Frameworks: The Australian government’s ongoing efforts to strengthen cybersecurity regulations, including the mandatory breach notification scheme, influence market dynamics.
- Product Substitutes: Open-source security solutions and self-service security tools pose some competitive pressure to commercial offerings.
- End-User Trends: Increased adoption of cloud-based services and the rising significance of data protection drive demand for specific cybersecurity solutions.
- M&A Activities: The past five years have witnessed several M&A activities, with deal values ranging from AU$ xx Million to AU$ xx Million. These transactions reflect the industry’s consolidation trend and strategic expansion efforts. The average deal value in 2024 was AU$ xx Million.
Cybersecurity Market in Australia Industry Trends & Insights
The Australian cybersecurity market is experiencing robust growth, driven by a confluence of factors. The increasing sophistication of cyber threats, coupled with the rising adoption of digital technologies across various sectors, fuels demand for robust cybersecurity solutions. The market's CAGR during 2025-2033 is projected at xx%, demonstrating its significant growth trajectory. Market penetration for cloud security solutions is expected to reach xx% by 2033, reflecting the increasing reliance on cloud services. Technological disruptions, such as the widespread adoption of Artificial Intelligence (AI) and Machine Learning (ML) in cybersecurity, are reshaping the competitive landscape. Consumer preferences are shifting towards integrated, user-friendly security solutions that offer comprehensive protection across multiple devices and platforms. The competitive dynamics are marked by intense innovation, strategic partnerships, and a continuous race to stay ahead of evolving cyber threats.
Dominant Markets & Segments in Cybersecurity Market in Australia
The Australian cybersecurity market is segmented by end-user industry, product type, service type, and deployment model. While all segments exhibit growth, some are more dominant than others.
By End-User Industry: The BFSI (Banking, Financial Services, and Insurance) sector and the Government sector are the leading segments, driven by stringent regulatory compliance requirements and the sensitive nature of their data. The Healthcare and IT and Telecommunication sectors are also experiencing strong growth due to increasing digitalization and the vulnerability of their infrastructure.
By Product Type: Network Security Equipment and Cloud Security solutions are dominant due to their critical role in protecting network infrastructure and data in the cloud. Demand for Identity Access Management (IAM) and Data Security solutions is also rapidly growing.
By Service: Managed security services are gaining traction due to their cost-effectiveness and the ability to outsource security management to specialized providers. Professional services remain crucial for specialized tasks and complex security implementations.
By Deployment: Cloud deployment is becoming increasingly popular owing to its scalability, flexibility, and cost-effectiveness. However, on-premise solutions continue to be relevant for organizations with stringent data sovereignty and security requirements.
Key Drivers: Government initiatives, technological advancements, and a growing awareness of cyber risks contribute to this segment dominance. Economic policies supporting digital transformation and infrastructure investments significantly impact market growth.
Cybersecurity Market in Australia Product Developments
Recent product innovations focus on advanced threat detection, AI-powered security solutions, and enhanced user experience. The market witnesses a trend towards integrated security platforms that consolidate multiple security functions, offering comprehensive protection. This move towards integrated solutions reflects the evolving needs of organizations facing increasingly complex and sophisticated cyber threats. These products offer competitive advantages through enhanced efficacy, ease of use, and reduced management complexity.
Report Scope & Segmentation Analysis
This report comprehensively analyzes the Australian cybersecurity market across various segments:
By End-User Industry: Each industry segment (BFSI, Healthcare, etc.) is analyzed based on market size, growth rate, and key trends. Growth projections vary, with BFSI and Government showing higher growth than Retail.
By Product Type: The report delves into the market size and growth potential of each product category (Application Security, Cloud Security, etc.), detailing market dynamics and competitive landscapes.
By Service: Growth projections and competitive dynamics are presented for both professional and managed services, highlighting their varying strengths and market penetration.
By Deployment: The report compares market sizes and growth forecasts for on-premise and cloud deployments, considering factors like security concerns and scalability.
Key Drivers of Cybersecurity Market in Australia Growth
The Australian cybersecurity market's growth is fuelled by several factors:
- Rising Cyber Threats: The increasing frequency and severity of cyberattacks drive demand for sophisticated security solutions.
- Government Regulations: Mandatory data breach notification laws and other regulations compel organizations to invest in robust cybersecurity infrastructure.
- Technological Advancements: AI, ML, and other technologies enhance cybersecurity capabilities, expanding market opportunities.
- Cloud Adoption: The migration to cloud services necessitates robust cloud security solutions.
Challenges in the Cybersecurity Market in Australia Sector
The Australian cybersecurity market faces certain challenges:
- Skills Shortage: A lack of skilled cybersecurity professionals hinders effective security implementation and management.
- Cost of Implementation: Deploying and maintaining comprehensive cybersecurity solutions can be expensive for smaller organizations.
- Evolving Threats: Cybercriminals constantly adapt their tactics, requiring continuous updates and upgrades to security systems.
Emerging Opportunities in Cybersecurity Market in Australia
Significant opportunities exist for growth within the Australian cybersecurity market:
- IoT Security: The increasing number of connected devices creates a need for robust IoT security solutions.
- Managed Security Services: The demand for managed security services is expanding as organizations seek cost-effective solutions.
- AI-powered Security: AI and ML solutions offer the potential for advanced threat detection and response.
Leading Players in the Cybersecurity Market in Australia Market
- FireEye Inc
- IBM Corporation
- Fortinet Inc
- Cisco Systems Inc
- AVG Technologies
- Cyber Ark Software Ltd
- Dell Technologies Inc
- Check Point Software Technologies Ltd
- Imperva Inc
Key Developments in Cybersecurity Market in Australia Industry
- February 2022: Joint Cybersecurity Advisory issued by ACSC, CISA, FBI, and NSA highlighted the growing ransomware threat. This fueled increased demand for ransomware protection solutions.
- February 2022: IBM's multi-million dollar investment in APAC cybersecurity resources boosted market activity and increased awareness.
- August 2022: Wipro's launch of Wipro Shelde Australia increased competition and provided a sovereign cybersecurity option.
- December 2022: Navitas's bug bounty program demonstrates the increasing adoption of proactive security measures.
Strategic Outlook for Cybersecurity Market in Australia Market
The Australian cybersecurity market is poised for continued growth, driven by increasing cyber threats, government initiatives, and technological advancements. Organizations will increasingly adopt proactive security measures, including AI-powered solutions and managed security services. The market will continue to consolidate, with larger players acquiring smaller firms to expand their offerings and market share. The focus on data privacy and regulatory compliance will further drive demand for robust and comprehensive cybersecurity solutions.
Cybersecurity Market in Australia Segmentation
-
1. Product Type
- 1.1. Application Security
- 1.2. Cloud Security
- 1.3. Consumer Security Software
- 1.4. Data Security
- 1.5. Identity Access Management
- 1.6. Infrastructure Protection
- 1.7. Integrated Risk Management
- 1.8. Network Security Equipment
- 1.9. Other Solution Types
-
2. Service
- 2.1. Professional
- 2.2. Managed
-
3. Deployment
- 3.1. On-Premise
- 3.2. Cloud
-
4. End-User Industry
- 4.1. BFSI
- 4.2. Healthcare
- 4.3. Aerospace and Defense
- 4.4. IT and Telecommunication
- 4.5. Government
- 4.6. Retail
- 4.7. Manufacturing
- 4.8. Other End-user Industries
Cybersecurity Market in Australia Segmentation By Geography
-
1. North America
- 1.1. United States
- 1.2. Canada
- 1.3. Mexico
-
2. South America
- 2.1. Brazil
- 2.2. Argentina
- 2.3. Rest of South America
-
3. Europe
- 3.1. United Kingdom
- 3.2. Germany
- 3.3. France
- 3.4. Italy
- 3.5. Spain
- 3.6. Russia
- 3.7. Benelux
- 3.8. Nordics
- 3.9. Rest of Europe
-
4. Middle East & Africa
- 4.1. Turkey
- 4.2. Israel
- 4.3. GCC
- 4.4. North Africa
- 4.5. South Africa
- 4.6. Rest of Middle East & Africa
-
5. Asia Pacific
- 5.1. China
- 5.2. India
- 5.3. Japan
- 5.4. South Korea
- 5.5. ASEAN
- 5.6. Oceania
- 5.7. Rest of Asia Pacific
Cybersecurity Market in Australia REPORT HIGHLIGHTS
| Aspects | Details |
|---|---|
| Study Period | 2019-2033 |
| Base Year | 2024 |
| Estimated Year | 2025 |
| Forecast Period | 2025-2033 |
| Historical Period | 2019-2024 |
| Growth Rate | CAGR of 18.44% from 2019-2033 |
| Segmentation |
|
Table of Contents
- 1. Introduction
- 1.1. Research Scope
- 1.2. Market Segmentation
- 1.3. Research Methodology
- 1.4. Definitions and Assumptions
- 2. Executive Summary
- 2.1. Introduction
- 3. Market Dynamics
- 3.1. Introduction
- 3.2. Market Drivers
- 3.2.1. Rapidly Increasing Cybersecurity Incidents and Regulations Requiring their Reporting; Growing M2M/IoT Connections Demanding Strengthened Cybersecurity in Enterprises
- 3.3. Market Restrains
- 3.3.1. Lack of 3D Content Development; Cost-Intensive 3D Displays
- 3.4. Market Trends
- 3.4.1. Data Security to Show Significant Growth
- 4. Market Factor Analysis
- 4.1. Porters Five Forces
- 4.2. Supply/Value Chain
- 4.3. PESTEL analysis
- 4.4. Market Entropy
- 4.5. Patent/Trademark Analysis
- 5. Global Cybersecurity Market in Australia Analysis, Insights and Forecast, 2019-2031
- 5.1. Market Analysis, Insights and Forecast - by Product Type
- 5.1.1. Application Security
- 5.1.2. Cloud Security
- 5.1.3. Consumer Security Software
- 5.1.4. Data Security
- 5.1.5. Identity Access Management
- 5.1.6. Infrastructure Protection
- 5.1.7. Integrated Risk Management
- 5.1.8. Network Security Equipment
- 5.1.9. Other Solution Types
- 5.2. Market Analysis, Insights and Forecast - by Service
- 5.2.1. Professional
- 5.2.2. Managed
- 5.3. Market Analysis, Insights and Forecast - by Deployment
- 5.3.1. On-Premise
- 5.3.2. Cloud
- 5.4. Market Analysis, Insights and Forecast - by End-User Industry
- 5.4.1. BFSI
- 5.4.2. Healthcare
- 5.4.3. Aerospace and Defense
- 5.4.4. IT and Telecommunication
- 5.4.5. Government
- 5.4.6. Retail
- 5.4.7. Manufacturing
- 5.4.8. Other End-user Industries
- 5.5. Market Analysis, Insights and Forecast - by Region
- 5.5.1. North America
- 5.5.2. South America
- 5.5.3. Europe
- 5.5.4. Middle East & Africa
- 5.5.5. Asia Pacific
- 5.1. Market Analysis, Insights and Forecast - by Product Type
- 6. North America Cybersecurity Market in Australia Analysis, Insights and Forecast, 2019-2031
- 6.1. Market Analysis, Insights and Forecast - by Product Type
- 6.1.1. Application Security
- 6.1.2. Cloud Security
- 6.1.3. Consumer Security Software
- 6.1.4. Data Security
- 6.1.5. Identity Access Management
- 6.1.6. Infrastructure Protection
- 6.1.7. Integrated Risk Management
- 6.1.8. Network Security Equipment
- 6.1.9. Other Solution Types
- 6.2. Market Analysis, Insights and Forecast - by Service
- 6.2.1. Professional
- 6.2.2. Managed
- 6.3. Market Analysis, Insights and Forecast - by Deployment
- 6.3.1. On-Premise
- 6.3.2. Cloud
- 6.4. Market Analysis, Insights and Forecast - by End-User Industry
- 6.4.1. BFSI
- 6.4.2. Healthcare
- 6.4.3. Aerospace and Defense
- 6.4.4. IT and Telecommunication
- 6.4.5. Government
- 6.4.6. Retail
- 6.4.7. Manufacturing
- 6.4.8. Other End-user Industries
- 6.1. Market Analysis, Insights and Forecast - by Product Type
- 7. South America Cybersecurity Market in Australia Analysis, Insights and Forecast, 2019-2031
- 7.1. Market Analysis, Insights and Forecast - by Product Type
- 7.1.1. Application Security
- 7.1.2. Cloud Security
- 7.1.3. Consumer Security Software
- 7.1.4. Data Security
- 7.1.5. Identity Access Management
- 7.1.6. Infrastructure Protection
- 7.1.7. Integrated Risk Management
- 7.1.8. Network Security Equipment
- 7.1.9. Other Solution Types
- 7.2. Market Analysis, Insights and Forecast - by Service
- 7.2.1. Professional
- 7.2.2. Managed
- 7.3. Market Analysis, Insights and Forecast - by Deployment
- 7.3.1. On-Premise
- 7.3.2. Cloud
- 7.4. Market Analysis, Insights and Forecast - by End-User Industry
- 7.4.1. BFSI
- 7.4.2. Healthcare
- 7.4.3. Aerospace and Defense
- 7.4.4. IT and Telecommunication
- 7.4.5. Government
- 7.4.6. Retail
- 7.4.7. Manufacturing
- 7.4.8. Other End-user Industries
- 7.1. Market Analysis, Insights and Forecast - by Product Type
- 8. Europe Cybersecurity Market in Australia Analysis, Insights and Forecast, 2019-2031
- 8.1. Market Analysis, Insights and Forecast - by Product Type
- 8.1.1. Application Security
- 8.1.2. Cloud Security
- 8.1.3. Consumer Security Software
- 8.1.4. Data Security
- 8.1.5. Identity Access Management
- 8.1.6. Infrastructure Protection
- 8.1.7. Integrated Risk Management
- 8.1.8. Network Security Equipment
- 8.1.9. Other Solution Types
- 8.2. Market Analysis, Insights and Forecast - by Service
- 8.2.1. Professional
- 8.2.2. Managed
- 8.3. Market Analysis, Insights and Forecast - by Deployment
- 8.3.1. On-Premise
- 8.3.2. Cloud
- 8.4. Market Analysis, Insights and Forecast - by End-User Industry
- 8.4.1. BFSI
- 8.4.2. Healthcare
- 8.4.3. Aerospace and Defense
- 8.4.4. IT and Telecommunication
- 8.4.5. Government
- 8.4.6. Retail
- 8.4.7. Manufacturing
- 8.4.8. Other End-user Industries
- 8.1. Market Analysis, Insights and Forecast - by Product Type
- 9. Middle East & Africa Cybersecurity Market in Australia Analysis, Insights and Forecast, 2019-2031
- 9.1. Market Analysis, Insights and Forecast - by Product Type
- 9.1.1. Application Security
- 9.1.2. Cloud Security
- 9.1.3. Consumer Security Software
- 9.1.4. Data Security
- 9.1.5. Identity Access Management
- 9.1.6. Infrastructure Protection
- 9.1.7. Integrated Risk Management
- 9.1.8. Network Security Equipment
- 9.1.9. Other Solution Types
- 9.2. Market Analysis, Insights and Forecast - by Service
- 9.2.1. Professional
- 9.2.2. Managed
- 9.3. Market Analysis, Insights and Forecast - by Deployment
- 9.3.1. On-Premise
- 9.3.2. Cloud
- 9.4. Market Analysis, Insights and Forecast - by End-User Industry
- 9.4.1. BFSI
- 9.4.2. Healthcare
- 9.4.3. Aerospace and Defense
- 9.4.4. IT and Telecommunication
- 9.4.5. Government
- 9.4.6. Retail
- 9.4.7. Manufacturing
- 9.4.8. Other End-user Industries
- 9.1. Market Analysis, Insights and Forecast - by Product Type
- 10. Asia Pacific Cybersecurity Market in Australia Analysis, Insights and Forecast, 2019-2031
- 10.1. Market Analysis, Insights and Forecast - by Product Type
- 10.1.1. Application Security
- 10.1.2. Cloud Security
- 10.1.3. Consumer Security Software
- 10.1.4. Data Security
- 10.1.5. Identity Access Management
- 10.1.6. Infrastructure Protection
- 10.1.7. Integrated Risk Management
- 10.1.8. Network Security Equipment
- 10.1.9. Other Solution Types
- 10.2. Market Analysis, Insights and Forecast - by Service
- 10.2.1. Professional
- 10.2.2. Managed
- 10.3. Market Analysis, Insights and Forecast - by Deployment
- 10.3.1. On-Premise
- 10.3.2. Cloud
- 10.4. Market Analysis, Insights and Forecast - by End-User Industry
- 10.4.1. BFSI
- 10.4.2. Healthcare
- 10.4.3. Aerospace and Defense
- 10.4.4. IT and Telecommunication
- 10.4.5. Government
- 10.4.6. Retail
- 10.4.7. Manufacturing
- 10.4.8. Other End-user Industries
- 10.1. Market Analysis, Insights and Forecast - by Product Type
- 11. Competitive Analysis
- 11.1. Global Market Share Analysis 2024
- 11.2. Company Profiles
- 11.2.1 FireEye Inc
- 11.2.1.1. Overview
- 11.2.1.2. Products
- 11.2.1.3. SWOT Analysis
- 11.2.1.4. Recent Developments
- 11.2.1.5. Financials (Based on Availability)
- 11.2.2 IBM Corporation
- 11.2.2.1. Overview
- 11.2.2.2. Products
- 11.2.2.3. SWOT Analysis
- 11.2.2.4. Recent Developments
- 11.2.2.5. Financials (Based on Availability)
- 11.2.3 Fortinet Inc
- 11.2.3.1. Overview
- 11.2.3.2. Products
- 11.2.3.3. SWOT Analysis
- 11.2.3.4. Recent Developments
- 11.2.3.5. Financials (Based on Availability)
- 11.2.4 Cisco Systems Inc
- 11.2.4.1. Overview
- 11.2.4.2. Products
- 11.2.4.3. SWOT Analysis
- 11.2.4.4. Recent Developments
- 11.2.4.5. Financials (Based on Availability)
- 11.2.5 AVG Technologies
- 11.2.5.1. Overview
- 11.2.5.2. Products
- 11.2.5.3. SWOT Analysis
- 11.2.5.4. Recent Developments
- 11.2.5.5. Financials (Based on Availability)
- 11.2.6 Cyber Ark Software Ltd
- 11.2.6.1. Overview
- 11.2.6.2. Products
- 11.2.6.3. SWOT Analysis
- 11.2.6.4. Recent Developments
- 11.2.6.5. Financials (Based on Availability)
- 11.2.7 Dell Technologies Inc
- 11.2.7.1. Overview
- 11.2.7.2. Products
- 11.2.7.3. SWOT Analysis
- 11.2.7.4. Recent Developments
- 11.2.7.5. Financials (Based on Availability)
- 11.2.8 Check Point Software Technologies Ltd?
- 11.2.8.1. Overview
- 11.2.8.2. Products
- 11.2.8.3. SWOT Analysis
- 11.2.8.4. Recent Developments
- 11.2.8.5. Financials (Based on Availability)
- 11.2.9 Imperva Inc
- 11.2.9.1. Overview
- 11.2.9.2. Products
- 11.2.9.3. SWOT Analysis
- 11.2.9.4. Recent Developments
- 11.2.9.5. Financials (Based on Availability)
- 11.2.1 FireEye Inc
List of Figures
- Figure 1: Global Cybersecurity Market in Australia Revenue Breakdown (Million, %) by Region 2024 & 2032
- Figure 2: Global Cybersecurity Market in Australia Volume Breakdown (K Unit, %) by Region 2024 & 2032
- Figure 3: Australia Cybersecurity Market in Australia Revenue (Million), by Country 2024 & 2032
- Figure 4: Australia Cybersecurity Market in Australia Volume (K Unit), by Country 2024 & 2032
- Figure 5: Australia Cybersecurity Market in Australia Revenue Share (%), by Country 2024 & 2032
- Figure 6: Australia Cybersecurity Market in Australia Volume Share (%), by Country 2024 & 2032
- Figure 7: North America Cybersecurity Market in Australia Revenue (Million), by Product Type 2024 & 2032
- Figure 8: North America Cybersecurity Market in Australia Volume (K Unit), by Product Type 2024 & 2032
- Figure 9: North America Cybersecurity Market in Australia Revenue Share (%), by Product Type 2024 & 2032
- Figure 10: North America Cybersecurity Market in Australia Volume Share (%), by Product Type 2024 & 2032
- Figure 11: North America Cybersecurity Market in Australia Revenue (Million), by Service 2024 & 2032
- Figure 12: North America Cybersecurity Market in Australia Volume (K Unit), by Service 2024 & 2032
- Figure 13: North America Cybersecurity Market in Australia Revenue Share (%), by Service 2024 & 2032
- Figure 14: North America Cybersecurity Market in Australia Volume Share (%), by Service 2024 & 2032
- Figure 15: North America Cybersecurity Market in Australia Revenue (Million), by Deployment 2024 & 2032
- Figure 16: North America Cybersecurity Market in Australia Volume (K Unit), by Deployment 2024 & 2032
- Figure 17: North America Cybersecurity Market in Australia Revenue Share (%), by Deployment 2024 & 2032
- Figure 18: North America Cybersecurity Market in Australia Volume Share (%), by Deployment 2024 & 2032
- Figure 19: North America Cybersecurity Market in Australia Revenue (Million), by End-User Industry 2024 & 2032
- Figure 20: North America Cybersecurity Market in Australia Volume (K Unit), by End-User Industry 2024 & 2032
- Figure 21: North America Cybersecurity Market in Australia Revenue Share (%), by End-User Industry 2024 & 2032
- Figure 22: North America Cybersecurity Market in Australia Volume Share (%), by End-User Industry 2024 & 2032
- Figure 23: North America Cybersecurity Market in Australia Revenue (Million), by Country 2024 & 2032
- Figure 24: North America Cybersecurity Market in Australia Volume (K Unit), by Country 2024 & 2032
- Figure 25: North America Cybersecurity Market in Australia Revenue Share (%), by Country 2024 & 2032
- Figure 26: North America Cybersecurity Market in Australia Volume Share (%), by Country 2024 & 2032
- Figure 27: South America Cybersecurity Market in Australia Revenue (Million), by Product Type 2024 & 2032
- Figure 28: South America Cybersecurity Market in Australia Volume (K Unit), by Product Type 2024 & 2032
- Figure 29: South America Cybersecurity Market in Australia Revenue Share (%), by Product Type 2024 & 2032
- Figure 30: South America Cybersecurity Market in Australia Volume Share (%), by Product Type 2024 & 2032
- Figure 31: South America Cybersecurity Market in Australia Revenue (Million), by Service 2024 & 2032
- Figure 32: South America Cybersecurity Market in Australia Volume (K Unit), by Service 2024 & 2032
- Figure 33: South America Cybersecurity Market in Australia Revenue Share (%), by Service 2024 & 2032
- Figure 34: South America Cybersecurity Market in Australia Volume Share (%), by Service 2024 & 2032
- Figure 35: South America Cybersecurity Market in Australia Revenue (Million), by Deployment 2024 & 2032
- Figure 36: South America Cybersecurity Market in Australia Volume (K Unit), by Deployment 2024 & 2032
- Figure 37: South America Cybersecurity Market in Australia Revenue Share (%), by Deployment 2024 & 2032
- Figure 38: South America Cybersecurity Market in Australia Volume Share (%), by Deployment 2024 & 2032
- Figure 39: South America Cybersecurity Market in Australia Revenue (Million), by End-User Industry 2024 & 2032
- Figure 40: South America Cybersecurity Market in Australia Volume (K Unit), by End-User Industry 2024 & 2032
- Figure 41: South America Cybersecurity Market in Australia Revenue Share (%), by End-User Industry 2024 & 2032
- Figure 42: South America Cybersecurity Market in Australia Volume Share (%), by End-User Industry 2024 & 2032
- Figure 43: South America Cybersecurity Market in Australia Revenue (Million), by Country 2024 & 2032
- Figure 44: South America Cybersecurity Market in Australia Volume (K Unit), by Country 2024 & 2032
- Figure 45: South America Cybersecurity Market in Australia Revenue Share (%), by Country 2024 & 2032
- Figure 46: South America Cybersecurity Market in Australia Volume Share (%), by Country 2024 & 2032
- Figure 47: Europe Cybersecurity Market in Australia Revenue (Million), by Product Type 2024 & 2032
- Figure 48: Europe Cybersecurity Market in Australia Volume (K Unit), by Product Type 2024 & 2032
- Figure 49: Europe Cybersecurity Market in Australia Revenue Share (%), by Product Type 2024 & 2032
- Figure 50: Europe Cybersecurity Market in Australia Volume Share (%), by Product Type 2024 & 2032
- Figure 51: Europe Cybersecurity Market in Australia Revenue (Million), by Service 2024 & 2032
- Figure 52: Europe Cybersecurity Market in Australia Volume (K Unit), by Service 2024 & 2032
- Figure 53: Europe Cybersecurity Market in Australia Revenue Share (%), by Service 2024 & 2032
- Figure 54: Europe Cybersecurity Market in Australia Volume Share (%), by Service 2024 & 2032
- Figure 55: Europe Cybersecurity Market in Australia Revenue (Million), by Deployment 2024 & 2032
- Figure 56: Europe Cybersecurity Market in Australia Volume (K Unit), by Deployment 2024 & 2032
- Figure 57: Europe Cybersecurity Market in Australia Revenue Share (%), by Deployment 2024 & 2032
- Figure 58: Europe Cybersecurity Market in Australia Volume Share (%), by Deployment 2024 & 2032
- Figure 59: Europe Cybersecurity Market in Australia Revenue (Million), by End-User Industry 2024 & 2032
- Figure 60: Europe Cybersecurity Market in Australia Volume (K Unit), by End-User Industry 2024 & 2032
- Figure 61: Europe Cybersecurity Market in Australia Revenue Share (%), by End-User Industry 2024 & 2032
- Figure 62: Europe Cybersecurity Market in Australia Volume Share (%), by End-User Industry 2024 & 2032
- Figure 63: Europe Cybersecurity Market in Australia Revenue (Million), by Country 2024 & 2032
- Figure 64: Europe Cybersecurity Market in Australia Volume (K Unit), by Country 2024 & 2032
- Figure 65: Europe Cybersecurity Market in Australia Revenue Share (%), by Country 2024 & 2032
- Figure 66: Europe Cybersecurity Market in Australia Volume Share (%), by Country 2024 & 2032
- Figure 67: Middle East & Africa Cybersecurity Market in Australia Revenue (Million), by Product Type 2024 & 2032
- Figure 68: Middle East & Africa Cybersecurity Market in Australia Volume (K Unit), by Product Type 2024 & 2032
- Figure 69: Middle East & Africa Cybersecurity Market in Australia Revenue Share (%), by Product Type 2024 & 2032
- Figure 70: Middle East & Africa Cybersecurity Market in Australia Volume Share (%), by Product Type 2024 & 2032
- Figure 71: Middle East & Africa Cybersecurity Market in Australia Revenue (Million), by Service 2024 & 2032
- Figure 72: Middle East & Africa Cybersecurity Market in Australia Volume (K Unit), by Service 2024 & 2032
- Figure 73: Middle East & Africa Cybersecurity Market in Australia Revenue Share (%), by Service 2024 & 2032
- Figure 74: Middle East & Africa Cybersecurity Market in Australia Volume Share (%), by Service 2024 & 2032
- Figure 75: Middle East & Africa Cybersecurity Market in Australia Revenue (Million), by Deployment 2024 & 2032
- Figure 76: Middle East & Africa Cybersecurity Market in Australia Volume (K Unit), by Deployment 2024 & 2032
- Figure 77: Middle East & Africa Cybersecurity Market in Australia Revenue Share (%), by Deployment 2024 & 2032
- Figure 78: Middle East & Africa Cybersecurity Market in Australia Volume Share (%), by Deployment 2024 & 2032
- Figure 79: Middle East & Africa Cybersecurity Market in Australia Revenue (Million), by End-User Industry 2024 & 2032
- Figure 80: Middle East & Africa Cybersecurity Market in Australia Volume (K Unit), by End-User Industry 2024 & 2032
- Figure 81: Middle East & Africa Cybersecurity Market in Australia Revenue Share (%), by End-User Industry 2024 & 2032
- Figure 82: Middle East & Africa Cybersecurity Market in Australia Volume Share (%), by End-User Industry 2024 & 2032
- Figure 83: Middle East & Africa Cybersecurity Market in Australia Revenue (Million), by Country 2024 & 2032
- Figure 84: Middle East & Africa Cybersecurity Market in Australia Volume (K Unit), by Country 2024 & 2032
- Figure 85: Middle East & Africa Cybersecurity Market in Australia Revenue Share (%), by Country 2024 & 2032
- Figure 86: Middle East & Africa Cybersecurity Market in Australia Volume Share (%), by Country 2024 & 2032
- Figure 87: Asia Pacific Cybersecurity Market in Australia Revenue (Million), by Product Type 2024 & 2032
- Figure 88: Asia Pacific Cybersecurity Market in Australia Volume (K Unit), by Product Type 2024 & 2032
- Figure 89: Asia Pacific Cybersecurity Market in Australia Revenue Share (%), by Product Type 2024 & 2032
- Figure 90: Asia Pacific Cybersecurity Market in Australia Volume Share (%), by Product Type 2024 & 2032
- Figure 91: Asia Pacific Cybersecurity Market in Australia Revenue (Million), by Service 2024 & 2032
- Figure 92: Asia Pacific Cybersecurity Market in Australia Volume (K Unit), by Service 2024 & 2032
- Figure 93: Asia Pacific Cybersecurity Market in Australia Revenue Share (%), by Service 2024 & 2032
- Figure 94: Asia Pacific Cybersecurity Market in Australia Volume Share (%), by Service 2024 & 2032
- Figure 95: Asia Pacific Cybersecurity Market in Australia Revenue (Million), by Deployment 2024 & 2032
- Figure 96: Asia Pacific Cybersecurity Market in Australia Volume (K Unit), by Deployment 2024 & 2032
- Figure 97: Asia Pacific Cybersecurity Market in Australia Revenue Share (%), by Deployment 2024 & 2032
- Figure 98: Asia Pacific Cybersecurity Market in Australia Volume Share (%), by Deployment 2024 & 2032
- Figure 99: Asia Pacific Cybersecurity Market in Australia Revenue (Million), by End-User Industry 2024 & 2032
- Figure 100: Asia Pacific Cybersecurity Market in Australia Volume (K Unit), by End-User Industry 2024 & 2032
- Figure 101: Asia Pacific Cybersecurity Market in Australia Revenue Share (%), by End-User Industry 2024 & 2032
- Figure 102: Asia Pacific Cybersecurity Market in Australia Volume Share (%), by End-User Industry 2024 & 2032
- Figure 103: Asia Pacific Cybersecurity Market in Australia Revenue (Million), by Country 2024 & 2032
- Figure 104: Asia Pacific Cybersecurity Market in Australia Volume (K Unit), by Country 2024 & 2032
- Figure 105: Asia Pacific Cybersecurity Market in Australia Revenue Share (%), by Country 2024 & 2032
- Figure 106: Asia Pacific Cybersecurity Market in Australia Volume Share (%), by Country 2024 & 2032
List of Tables
- Table 1: Global Cybersecurity Market in Australia Revenue Million Forecast, by Region 2019 & 2032
- Table 2: Global Cybersecurity Market in Australia Volume K Unit Forecast, by Region 2019 & 2032
- Table 3: Global Cybersecurity Market in Australia Revenue Million Forecast, by Product Type 2019 & 2032
- Table 4: Global Cybersecurity Market in Australia Volume K Unit Forecast, by Product Type 2019 & 2032
- Table 5: Global Cybersecurity Market in Australia Revenue Million Forecast, by Service 2019 & 2032
- Table 6: Global Cybersecurity Market in Australia Volume K Unit Forecast, by Service 2019 & 2032
- Table 7: Global Cybersecurity Market in Australia Revenue Million Forecast, by Deployment 2019 & 2032
- Table 8: Global Cybersecurity Market in Australia Volume K Unit Forecast, by Deployment 2019 & 2032
- Table 9: Global Cybersecurity Market in Australia Revenue Million Forecast, by End-User Industry 2019 & 2032
- Table 10: Global Cybersecurity Market in Australia Volume K Unit Forecast, by End-User Industry 2019 & 2032
- Table 11: Global Cybersecurity Market in Australia Revenue Million Forecast, by Region 2019 & 2032
- Table 12: Global Cybersecurity Market in Australia Volume K Unit Forecast, by Region 2019 & 2032
- Table 13: Global Cybersecurity Market in Australia Revenue Million Forecast, by Country 2019 & 2032
- Table 14: Global Cybersecurity Market in Australia Volume K Unit Forecast, by Country 2019 & 2032
- Table 15: Global Cybersecurity Market in Australia Revenue Million Forecast, by Product Type 2019 & 2032
- Table 16: Global Cybersecurity Market in Australia Volume K Unit Forecast, by Product Type 2019 & 2032
- Table 17: Global Cybersecurity Market in Australia Revenue Million Forecast, by Service 2019 & 2032
- Table 18: Global Cybersecurity Market in Australia Volume K Unit Forecast, by Service 2019 & 2032
- Table 19: Global Cybersecurity Market in Australia Revenue Million Forecast, by Deployment 2019 & 2032
- Table 20: Global Cybersecurity Market in Australia Volume K Unit Forecast, by Deployment 2019 & 2032
- Table 21: Global Cybersecurity Market in Australia Revenue Million Forecast, by End-User Industry 2019 & 2032
- Table 22: Global Cybersecurity Market in Australia Volume K Unit Forecast, by End-User Industry 2019 & 2032
- Table 23: Global Cybersecurity Market in Australia Revenue Million Forecast, by Country 2019 & 2032
- Table 24: Global Cybersecurity Market in Australia Volume K Unit Forecast, by Country 2019 & 2032
- Table 25: United States Cybersecurity Market in Australia Revenue (Million) Forecast, by Application 2019 & 2032
- Table 26: United States Cybersecurity Market in Australia Volume (K Unit) Forecast, by Application 2019 & 2032
- Table 27: Canada Cybersecurity Market in Australia Revenue (Million) Forecast, by Application 2019 & 2032
- Table 28: Canada Cybersecurity Market in Australia Volume (K Unit) Forecast, by Application 2019 & 2032
- Table 29: Mexico Cybersecurity Market in Australia Revenue (Million) Forecast, by Application 2019 & 2032
- Table 30: Mexico Cybersecurity Market in Australia Volume (K Unit) Forecast, by Application 2019 & 2032
- Table 31: Global Cybersecurity Market in Australia Revenue Million Forecast, by Product Type 2019 & 2032
- Table 32: Global Cybersecurity Market in Australia Volume K Unit Forecast, by Product Type 2019 & 2032
- Table 33: Global Cybersecurity Market in Australia Revenue Million Forecast, by Service 2019 & 2032
- Table 34: Global Cybersecurity Market in Australia Volume K Unit Forecast, by Service 2019 & 2032
- Table 35: Global Cybersecurity Market in Australia Revenue Million Forecast, by Deployment 2019 & 2032
- Table 36: Global Cybersecurity Market in Australia Volume K Unit Forecast, by Deployment 2019 & 2032
- Table 37: Global Cybersecurity Market in Australia Revenue Million Forecast, by End-User Industry 2019 & 2032
- Table 38: Global Cybersecurity Market in Australia Volume K Unit Forecast, by End-User Industry 2019 & 2032
- Table 39: Global Cybersecurity Market in Australia Revenue Million Forecast, by Country 2019 & 2032
- Table 40: Global Cybersecurity Market in Australia Volume K Unit Forecast, by Country 2019 & 2032
- Table 41: Brazil Cybersecurity Market in Australia Revenue (Million) Forecast, by Application 2019 & 2032
- Table 42: Brazil Cybersecurity Market in Australia Volume (K Unit) Forecast, by Application 2019 & 2032
- Table 43: Argentina Cybersecurity Market in Australia Revenue (Million) Forecast, by Application 2019 & 2032
- Table 44: Argentina Cybersecurity Market in Australia Volume (K Unit) Forecast, by Application 2019 & 2032
- Table 45: Rest of South America Cybersecurity Market in Australia Revenue (Million) Forecast, by Application 2019 & 2032
- Table 46: Rest of South America Cybersecurity Market in Australia Volume (K Unit) Forecast, by Application 2019 & 2032
- Table 47: Global Cybersecurity Market in Australia Revenue Million Forecast, by Product Type 2019 & 2032
- Table 48: Global Cybersecurity Market in Australia Volume K Unit Forecast, by Product Type 2019 & 2032
- Table 49: Global Cybersecurity Market in Australia Revenue Million Forecast, by Service 2019 & 2032
- Table 50: Global Cybersecurity Market in Australia Volume K Unit Forecast, by Service 2019 & 2032
- Table 51: Global Cybersecurity Market in Australia Revenue Million Forecast, by Deployment 2019 & 2032
- Table 52: Global Cybersecurity Market in Australia Volume K Unit Forecast, by Deployment 2019 & 2032
- Table 53: Global Cybersecurity Market in Australia Revenue Million Forecast, by End-User Industry 2019 & 2032
- Table 54: Global Cybersecurity Market in Australia Volume K Unit Forecast, by End-User Industry 2019 & 2032
- Table 55: Global Cybersecurity Market in Australia Revenue Million Forecast, by Country 2019 & 2032
- Table 56: Global Cybersecurity Market in Australia Volume K Unit Forecast, by Country 2019 & 2032
- Table 57: United Kingdom Cybersecurity Market in Australia Revenue (Million) Forecast, by Application 2019 & 2032
- Table 58: United Kingdom Cybersecurity Market in Australia Volume (K Unit) Forecast, by Application 2019 & 2032
- Table 59: Germany Cybersecurity Market in Australia Revenue (Million) Forecast, by Application 2019 & 2032
- Table 60: Germany Cybersecurity Market in Australia Volume (K Unit) Forecast, by Application 2019 & 2032
- Table 61: France Cybersecurity Market in Australia Revenue (Million) Forecast, by Application 2019 & 2032
- Table 62: France Cybersecurity Market in Australia Volume (K Unit) Forecast, by Application 2019 & 2032
- Table 63: Italy Cybersecurity Market in Australia Revenue (Million) Forecast, by Application 2019 & 2032
- Table 64: Italy Cybersecurity Market in Australia Volume (K Unit) Forecast, by Application 2019 & 2032
- Table 65: Spain Cybersecurity Market in Australia Revenue (Million) Forecast, by Application 2019 & 2032
- Table 66: Spain Cybersecurity Market in Australia Volume (K Unit) Forecast, by Application 2019 & 2032
- Table 67: Russia Cybersecurity Market in Australia Revenue (Million) Forecast, by Application 2019 & 2032
- Table 68: Russia Cybersecurity Market in Australia Volume (K Unit) Forecast, by Application 2019 & 2032
- Table 69: Benelux Cybersecurity Market in Australia Revenue (Million) Forecast, by Application 2019 & 2032
- Table 70: Benelux Cybersecurity Market in Australia Volume (K Unit) Forecast, by Application 2019 & 2032
- Table 71: Nordics Cybersecurity Market in Australia Revenue (Million) Forecast, by Application 2019 & 2032
- Table 72: Nordics Cybersecurity Market in Australia Volume (K Unit) Forecast, by Application 2019 & 2032
- Table 73: Rest of Europe Cybersecurity Market in Australia Revenue (Million) Forecast, by Application 2019 & 2032
- Table 74: Rest of Europe Cybersecurity Market in Australia Volume (K Unit) Forecast, by Application 2019 & 2032
- Table 75: Global Cybersecurity Market in Australia Revenue Million Forecast, by Product Type 2019 & 2032
- Table 76: Global Cybersecurity Market in Australia Volume K Unit Forecast, by Product Type 2019 & 2032
- Table 77: Global Cybersecurity Market in Australia Revenue Million Forecast, by Service 2019 & 2032
- Table 78: Global Cybersecurity Market in Australia Volume K Unit Forecast, by Service 2019 & 2032
- Table 79: Global Cybersecurity Market in Australia Revenue Million Forecast, by Deployment 2019 & 2032
- Table 80: Global Cybersecurity Market in Australia Volume K Unit Forecast, by Deployment 2019 & 2032
- Table 81: Global Cybersecurity Market in Australia Revenue Million Forecast, by End-User Industry 2019 & 2032
- Table 82: Global Cybersecurity Market in Australia Volume K Unit Forecast, by End-User Industry 2019 & 2032
- Table 83: Global Cybersecurity Market in Australia Revenue Million Forecast, by Country 2019 & 2032
- Table 84: Global Cybersecurity Market in Australia Volume K Unit Forecast, by Country 2019 & 2032
- Table 85: Turkey Cybersecurity Market in Australia Revenue (Million) Forecast, by Application 2019 & 2032
- Table 86: Turkey Cybersecurity Market in Australia Volume (K Unit) Forecast, by Application 2019 & 2032
- Table 87: Israel Cybersecurity Market in Australia Revenue (Million) Forecast, by Application 2019 & 2032
- Table 88: Israel Cybersecurity Market in Australia Volume (K Unit) Forecast, by Application 2019 & 2032
- Table 89: GCC Cybersecurity Market in Australia Revenue (Million) Forecast, by Application 2019 & 2032
- Table 90: GCC Cybersecurity Market in Australia Volume (K Unit) Forecast, by Application 2019 & 2032
- Table 91: North Africa Cybersecurity Market in Australia Revenue (Million) Forecast, by Application 2019 & 2032
- Table 92: North Africa Cybersecurity Market in Australia Volume (K Unit) Forecast, by Application 2019 & 2032
- Table 93: South Africa Cybersecurity Market in Australia Revenue (Million) Forecast, by Application 2019 & 2032
- Table 94: South Africa Cybersecurity Market in Australia Volume (K Unit) Forecast, by Application 2019 & 2032
- Table 95: Rest of Middle East & Africa Cybersecurity Market in Australia Revenue (Million) Forecast, by Application 2019 & 2032
- Table 96: Rest of Middle East & Africa Cybersecurity Market in Australia Volume (K Unit) Forecast, by Application 2019 & 2032
- Table 97: Global Cybersecurity Market in Australia Revenue Million Forecast, by Product Type 2019 & 2032
- Table 98: Global Cybersecurity Market in Australia Volume K Unit Forecast, by Product Type 2019 & 2032
- Table 99: Global Cybersecurity Market in Australia Revenue Million Forecast, by Service 2019 & 2032
- Table 100: Global Cybersecurity Market in Australia Volume K Unit Forecast, by Service 2019 & 2032
- Table 101: Global Cybersecurity Market in Australia Revenue Million Forecast, by Deployment 2019 & 2032
- Table 102: Global Cybersecurity Market in Australia Volume K Unit Forecast, by Deployment 2019 & 2032
- Table 103: Global Cybersecurity Market in Australia Revenue Million Forecast, by End-User Industry 2019 & 2032
- Table 104: Global Cybersecurity Market in Australia Volume K Unit Forecast, by End-User Industry 2019 & 2032
- Table 105: Global Cybersecurity Market in Australia Revenue Million Forecast, by Country 2019 & 2032
- Table 106: Global Cybersecurity Market in Australia Volume K Unit Forecast, by Country 2019 & 2032
- Table 107: China Cybersecurity Market in Australia Revenue (Million) Forecast, by Application 2019 & 2032
- Table 108: China Cybersecurity Market in Australia Volume (K Unit) Forecast, by Application 2019 & 2032
- Table 109: India Cybersecurity Market in Australia Revenue (Million) Forecast, by Application 2019 & 2032
- Table 110: India Cybersecurity Market in Australia Volume (K Unit) Forecast, by Application 2019 & 2032
- Table 111: Japan Cybersecurity Market in Australia Revenue (Million) Forecast, by Application 2019 & 2032
- Table 112: Japan Cybersecurity Market in Australia Volume (K Unit) Forecast, by Application 2019 & 2032
- Table 113: South Korea Cybersecurity Market in Australia Revenue (Million) Forecast, by Application 2019 & 2032
- Table 114: South Korea Cybersecurity Market in Australia Volume (K Unit) Forecast, by Application 2019 & 2032
- Table 115: ASEAN Cybersecurity Market in Australia Revenue (Million) Forecast, by Application 2019 & 2032
- Table 116: ASEAN Cybersecurity Market in Australia Volume (K Unit) Forecast, by Application 2019 & 2032
- Table 117: Oceania Cybersecurity Market in Australia Revenue (Million) Forecast, by Application 2019 & 2032
- Table 118: Oceania Cybersecurity Market in Australia Volume (K Unit) Forecast, by Application 2019 & 2032
- Table 119: Rest of Asia Pacific Cybersecurity Market in Australia Revenue (Million) Forecast, by Application 2019 & 2032
- Table 120: Rest of Asia Pacific Cybersecurity Market in Australia Volume (K Unit) Forecast, by Application 2019 & 2032
Frequently Asked Questions
1. What is the projected Compound Annual Growth Rate (CAGR) of the Cybersecurity Market in Australia?
The projected CAGR is approximately 18.44%.
2. Which companies are prominent players in the Cybersecurity Market in Australia?
Key companies in the market include FireEye Inc, IBM Corporation, Fortinet Inc, Cisco Systems Inc, AVG Technologies, Cyber Ark Software Ltd, Dell Technologies Inc, Check Point Software Technologies Ltd?, Imperva Inc .
3. What are the main segments of the Cybersecurity Market in Australia?
The market segments include Product Type, Service, Deployment, End-User Industry.
4. Can you provide details about the market size?
The market size is estimated to be USD 7.09 Million as of 2022.
5. What are some drivers contributing to market growth?
Rapidly Increasing Cybersecurity Incidents and Regulations Requiring their Reporting; Growing M2M/IoT Connections Demanding Strengthened Cybersecurity in Enterprises.
6. What are the notable trends driving market growth?
Data Security to Show Significant Growth.
7. Are there any restraints impacting market growth?
Lack of 3D Content Development; Cost-Intensive 3D Displays.
8. Can you provide examples of recent developments in the market?
February 2022 : Australian Cyber Security Centre (ACSC), the Cybersecurity and Infrastructure Security Agency (CISA), along with the Federal Bureau of Investigation (FBI), National Security Agency (NSA), among others, issued a joint Cybersecurity Advisory outlining the growing international threat posed by ransomware over the past year.
9. What pricing options are available for accessing the report?
Pricing options include single-user, multi-user, and enterprise licenses priced at USD 3800, USD 4500, and USD 5800 respectively.
10. Is the market size provided in terms of value or volume?
The market size is provided in terms of value, measured in Million and volume, measured in K Unit.
11. Are there any specific market keywords associated with the report?
Yes, the market keyword associated with the report is "Cybersecurity Market in Australia," which aids in identifying and referencing the specific market segment covered.
12. How do I determine which pricing option suits my needs best?
The pricing options vary based on user requirements and access needs. Individual users may opt for single-user licenses, while businesses requiring broader access may choose multi-user or enterprise licenses for cost-effective access to the report.
13. Are there any additional resources or data provided in the Cybersecurity Market in Australia report?
While the report offers comprehensive insights, it's advisable to review the specific contents or supplementary materials provided to ascertain if additional resources or data are available.
14. How can I stay updated on further developments or reports in the Cybersecurity Market in Australia?
To stay informed about further developments, trends, and reports in the Cybersecurity Market in Australia, consider subscribing to industry newsletters, following relevant companies and organizations, or regularly checking reputable industry news sources and publications.
Methodology
Step 1 - Identification of Relevant Samples Size from Population Database


Step 2 - Approaches for Defining Global Market Size (Value, Volume* & Price*)

Note*: In applicable scenarios
Step 3 - Data Sources
Primary Research
- Web Analytics
- Survey Reports
- Research Institute
- Latest Research Reports
- Opinion Leaders
Secondary Research
- Annual Reports
- White Paper
- Latest Press Release
- Industry Association
- Paid Database
- Investor Presentations

Step 4 - Data Triangulation
Involves using different sources of information in order to increase the validity of a study
These sources are likely to be stakeholders in a program - participants, other researchers, program staff, other community members, and so on.
Then we put all data in single framework & apply various statistical tools to find out the dynamic on the market.
During the analysis stage, feedback from the stakeholder groups would be compared to determine areas of agreement as well as areas of divergence


