
Key Insights
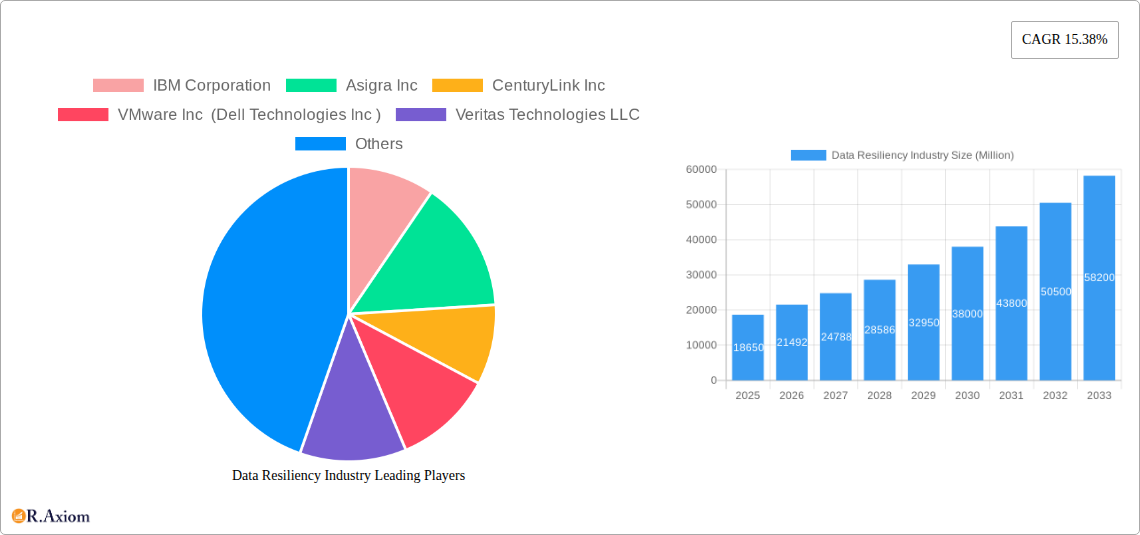
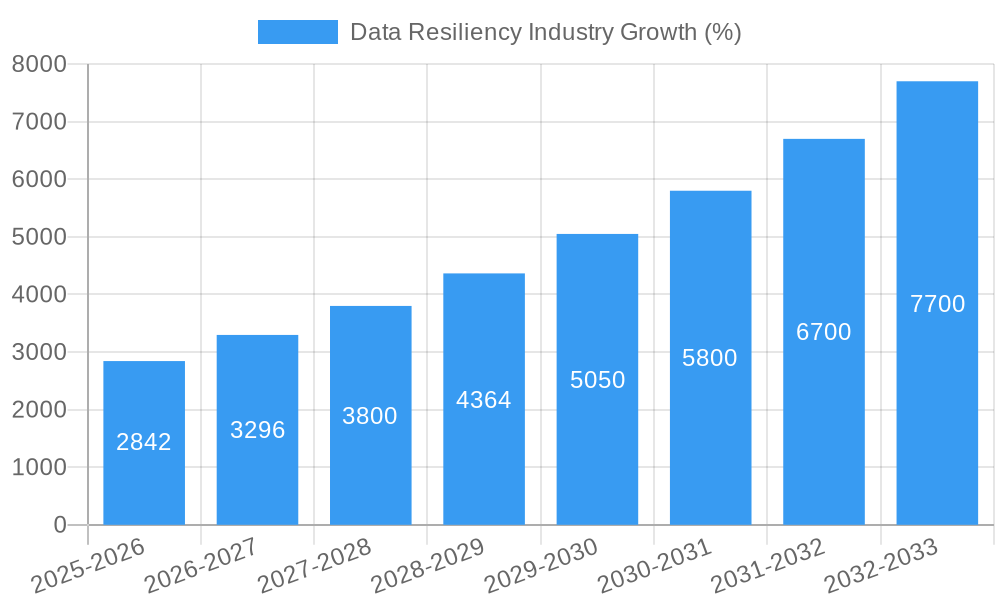
The Data Resiliency market is experiencing robust growth, projected to reach $18.65 billion in 2025 and exhibiting a Compound Annual Growth Rate (CAGR) of 15.38% from 2025 to 2033. This expansion is fueled by several key drivers. The increasing frequency and severity of cyberattacks, coupled with stringent data privacy regulations like GDPR and CCPA, are compelling organizations across all sectors to prioritize data protection and recovery capabilities. The rising adoption of cloud computing, while offering scalability and cost-effectiveness, also necessitates robust data resiliency strategies to mitigate risks associated with data loss and breaches in cloud environments. Furthermore, the growing reliance on big data analytics and the Internet of Things (IoT) generates massive volumes of data, significantly increasing the need for effective data resiliency solutions to ensure business continuity and operational efficiency. The market segmentation reveals a significant demand across various end-user verticals, notably BFSI (Banking, Financial Services, and Insurance), IT & Telecommunication, and Government, each contributing substantially to the overall market value.
The market's growth trajectory is further shaped by emerging trends such as the integration of artificial intelligence (AI) and machine learning (ML) into data resiliency solutions, enhancing automation and predictive capabilities. This includes automated backup and recovery processes, intelligent threat detection, and proactive risk mitigation strategies. However, the market faces certain restraints, including the high initial investment costs associated with implementing advanced data resiliency solutions and the complexity of managing and integrating these solutions across diverse IT infrastructures. Despite these challenges, the overall market outlook remains positive, driven by the escalating need for robust data protection and the continuous evolution of technology to address these evolving challenges. The competitive landscape is characterized by a mix of established players and emerging vendors, each offering a range of solutions tailored to specific market needs and customer requirements. This competitive environment fosters innovation and drives the development of more sophisticated and effective data resiliency technologies.
This comprehensive report provides an in-depth analysis of the Data Resiliency Industry, offering invaluable insights for stakeholders, investors, and industry professionals. The study covers the period 2019-2033, with a focus on 2025 as the base and estimated year. The report projects a market valued at $XX Million in 2025, with a Compound Annual Growth Rate (CAGR) of XX% during the forecast period (2025-2033).
Data Resiliency Industry Market Concentration & Innovation
The Data Resiliency market exhibits a moderately consolidated landscape, with key players like IBM Corporation, IBM, Microsoft Corporation, Microsoft, and Veritas Technologies LLC holding significant market share. In 2024, the top five players collectively accounted for approximately XX% of the global market. However, the market shows signs of increasing fragmentation due to the emergence of niche players and innovative solutions.
Innovation is driven by factors such as the increasing volume and complexity of data, growing concerns about data breaches and cyberattacks, and stringent regulatory compliance requirements (e.g., GDPR, CCPA). Mergers and acquisitions (M&A) activity has played a crucial role in shaping the market landscape, with notable deals such as (Example: Acronis' acquisition of XX company in 2022 for an estimated $XX Million) contributing to market consolidation and technological advancements.
- Market Concentration: Top 5 players hold XX% market share (2024).
- M&A Activity: Significant deals totaling $XX Million (2019-2024) influenced market dynamics.
- Innovation Drivers: Growing data volume, cybersecurity threats, and regulatory compliance.
- Product Substitutes: Open-source solutions and cloud-based alternatives pose some competitive pressure.
- End-User Trends: Increased adoption of cloud-based solutions and demand for comprehensive data protection strategies.
Data Resiliency Industry Industry Trends & Insights
The Data Resiliency market is experiencing robust growth, fueled by the exponential growth of data, increasing digital transformation initiatives across industries, and heightened awareness of data security risks. The market is witnessing a significant shift towards cloud-based solutions, driven by their scalability, cost-effectiveness, and ease of management. This trend is complemented by the rising adoption of AI and machine learning in data protection and recovery.
The competitive landscape is characterized by intense competition among established players and emerging startups. Key players are focusing on developing innovative solutions, expanding their product portfolios, and forging strategic partnerships to gain a competitive edge. Consumer preferences are leaning towards solutions that offer enhanced security features, automated data management capabilities, and seamless integration with existing IT infrastructures. The market penetration of cloud-based solutions is expected to reach XX% by 2033, while the overall market size will likely exceed $XX Million.
The industry's CAGR is projected to remain strong throughout the forecast period, driven by factors such as:
- Rising adoption of cloud computing
- Increased cyber threats and data breaches
- Growing regulatory compliance requirements
Dominant Markets & Segments in Data Resiliency Industry
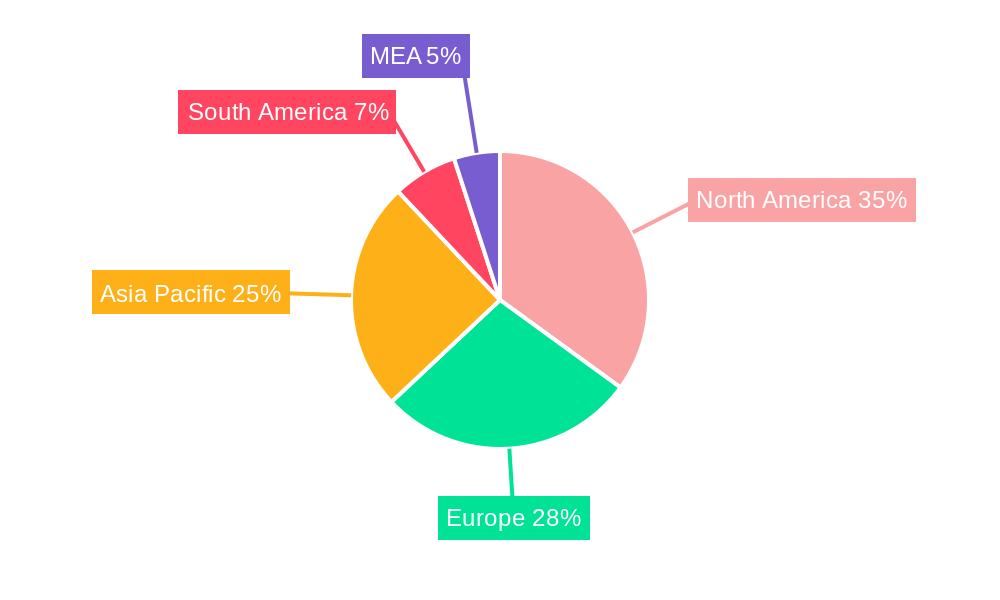
The North American region currently dominates the Data Resiliency market, driven by factors such as early adoption of cloud technologies, robust IT infrastructure, and stringent data protection regulations. Within the segments:
- By Deployment: The cloud segment is experiencing faster growth than on-premise, driven by cost optimization and scalability.
- By End-user Vertical: BFSI and IT & Telecommunication sectors are the largest contributors, followed by the Government and Healthcare sectors. This is due to the large amount of sensitive data handled by these sectors and the stringent regulations governing their data protection.
Key Drivers for Dominant Regions and Segments:
- North America: Strong IT infrastructure, early adoption of cloud technologies, stringent regulations.
- BFSI: High volume of sensitive data, stringent compliance requirements.
- IT & Telecommunication: Large data volume, critical data infrastructure.
- Cloud Deployment: Scalability, cost-effectiveness, ease of management.
Data Resiliency Industry Product Developments
Recent product innovations focus on advanced features such as AI-powered data protection, automated backup and recovery, and improved disaster recovery solutions. The market is seeing a trend towards integrated solutions that combine data protection, disaster recovery, and cybersecurity features. These developments address evolving customer needs for enhanced security, simplified management, and cost-optimization.
Report Scope & Segmentation Analysis
This report comprehensively analyzes the Data Resiliency market across various segments:
By Deployment: On-premise and Cloud. The cloud segment is projected to grow at a CAGR of XX% during the forecast period, driven by the increasing adoption of cloud-based services. The on-premise segment is expected to witness slower growth due to the shift towards cloud solutions.
By End-user Vertical: BFSI, IT & Telecommunication, Government, Manufacturing, Healthcare, and Other. The BFSI and IT & Telecommunication sectors are expected to be the fastest-growing segments, driven by their high reliance on data and stringent regulatory requirements.
Key Drivers of Data Resiliency Industry Growth
The Data Resiliency industry’s growth is primarily fueled by:
- Technological advancements: The development of AI-powered solutions, automated backup and recovery systems, and improved disaster recovery mechanisms is driving adoption.
- Economic factors: Increasing digitization and the rising adoption of cloud computing are key drivers.
- Regulatory compliance: Stringent data protection regulations worldwide are mandating businesses to invest in robust data resiliency solutions.
Challenges in the Data Resiliency Industry Sector
Significant challenges facing the Data Resiliency industry include:
- Data Complexity: Managing increasingly diverse and distributed data sources.
- Cybersecurity Threats: Rising sophistication of cyberattacks requires constant innovation in security measures.
- Cost of Implementation: The initial investment for robust data resiliency can be substantial.
Emerging Opportunities in Data Resiliency Industry
The Data Resiliency market presents significant opportunities in:
- Edge Computing: Protecting data at the edge of the network is becoming crucial.
- IoT Security: Securing data generated by the proliferation of IoT devices.
- Specialized Solutions: Meeting the unique data resiliency needs of specific industries.
Leading Players in the Data Resiliency Industry Market
- IBM Corporation
- Asigra Inc
- CenturyLink Inc
- VMware Inc (Dell Technologies Inc)
- Veritas Technologies LLC
- Microsoft Corporation
- NetApp Inc
- Carbonite Inc (OpenText Corporation)
- Acronis International GmbH
- Micro Focus International plc
- Commvault Systems Inc
Key Developments in Data Resiliency Industry Industry
- 2022 Q3: IBM launched its enhanced data protection platform with enhanced AI capabilities.
- 2023 Q1: Microsoft announced a strategic partnership with XX company to improve data recovery services.
- 2024 Q2: Veritas Technologies unveiled a new ransomware protection solution. (Further examples required)
Strategic Outlook for Data Resiliency Industry Market
The Data Resiliency market is poised for sustained growth, driven by the ongoing digital transformation and increasing adoption of cloud-based solutions. The market will continue to be shaped by technological innovations, strategic partnerships, and regulatory developments. Opportunities exist for players who can deliver innovative, secure, and cost-effective solutions that meet the evolving needs of businesses across various sectors.
Data Resiliency Industry Segmentation
-
1. Deployment
- 1.1. On-premise
- 1.2. Cloud
-
2. End-user Vertical
- 2.1. BFSI
- 2.2. IT & Telecommunication
- 2.3. Government
- 2.4. Manufacturing
- 2.5. Healthcare
- 2.6. Other End-user Vertical
Data Resiliency Industry Segmentation By Geography
- 1. North America
- 2. Europe
- 3. Asia Pacific
- 4. Latin America
- 5. Middle East
Data Resiliency Industry REPORT HIGHLIGHTS
| Aspects | Details |
|---|---|
| Study Period | 2019-2033 |
| Base Year | 2024 |
| Estimated Year | 2025 |
| Forecast Period | 2025-2033 |
| Historical Period | 2019-2024 |
| Growth Rate | CAGR of 15.38% from 2019-2033 |
| Segmentation |
|
Table of Contents
- 1. Introduction
- 1.1. Research Scope
- 1.2. Market Segmentation
- 1.3. Research Methodology
- 1.4. Definitions and Assumptions
- 2. Executive Summary
- 2.1. Introduction
- 3. Market Dynamics
- 3.1. Introduction
- 3.2. Market Drivers
- 3.2.1. ; Rapid Growth in Data being Generated from Multiple Sources; Increasing Privacy Concerns and Rising Need for Data Security
- 3.3. Market Restrains
- 3.3.1. ; Availability of open-source alternatives
- 3.4. Market Trends
- 3.4.1. BFSI Segment is Expected to Witness Significant Growth
- 4. Market Factor Analysis
- 4.1. Porters Five Forces
- 4.2. Supply/Value Chain
- 4.3. PESTEL analysis
- 4.4. Market Entropy
- 4.5. Patent/Trademark Analysis
- 5. Global Data Resiliency Industry Analysis, Insights and Forecast, 2019-2031
- 5.1. Market Analysis, Insights and Forecast - by Deployment
- 5.1.1. On-premise
- 5.1.2. Cloud
- 5.2. Market Analysis, Insights and Forecast - by End-user Vertical
- 5.2.1. BFSI
- 5.2.2. IT & Telecommunication
- 5.2.3. Government
- 5.2.4. Manufacturing
- 5.2.5. Healthcare
- 5.2.6. Other End-user Vertical
- 5.3. Market Analysis, Insights and Forecast - by Region
- 5.3.1. North America
- 5.3.2. Europe
- 5.3.3. Asia Pacific
- 5.3.4. Latin America
- 5.3.5. Middle East
- 5.1. Market Analysis, Insights and Forecast - by Deployment
- 6. North America Data Resiliency Industry Analysis, Insights and Forecast, 2019-2031
- 6.1. Market Analysis, Insights and Forecast - by Deployment
- 6.1.1. On-premise
- 6.1.2. Cloud
- 6.2. Market Analysis, Insights and Forecast - by End-user Vertical
- 6.2.1. BFSI
- 6.2.2. IT & Telecommunication
- 6.2.3. Government
- 6.2.4. Manufacturing
- 6.2.5. Healthcare
- 6.2.6. Other End-user Vertical
- 6.1. Market Analysis, Insights and Forecast - by Deployment
- 7. Europe Data Resiliency Industry Analysis, Insights and Forecast, 2019-2031
- 7.1. Market Analysis, Insights and Forecast - by Deployment
- 7.1.1. On-premise
- 7.1.2. Cloud
- 7.2. Market Analysis, Insights and Forecast - by End-user Vertical
- 7.2.1. BFSI
- 7.2.2. IT & Telecommunication
- 7.2.3. Government
- 7.2.4. Manufacturing
- 7.2.5. Healthcare
- 7.2.6. Other End-user Vertical
- 7.1. Market Analysis, Insights and Forecast - by Deployment
- 8. Asia Pacific Data Resiliency Industry Analysis, Insights and Forecast, 2019-2031
- 8.1. Market Analysis, Insights and Forecast - by Deployment
- 8.1.1. On-premise
- 8.1.2. Cloud
- 8.2. Market Analysis, Insights and Forecast - by End-user Vertical
- 8.2.1. BFSI
- 8.2.2. IT & Telecommunication
- 8.2.3. Government
- 8.2.4. Manufacturing
- 8.2.5. Healthcare
- 8.2.6. Other End-user Vertical
- 8.1. Market Analysis, Insights and Forecast - by Deployment
- 9. Latin America Data Resiliency Industry Analysis, Insights and Forecast, 2019-2031
- 9.1. Market Analysis, Insights and Forecast - by Deployment
- 9.1.1. On-premise
- 9.1.2. Cloud
- 9.2. Market Analysis, Insights and Forecast - by End-user Vertical
- 9.2.1. BFSI
- 9.2.2. IT & Telecommunication
- 9.2.3. Government
- 9.2.4. Manufacturing
- 9.2.5. Healthcare
- 9.2.6. Other End-user Vertical
- 9.1. Market Analysis, Insights and Forecast - by Deployment
- 10. Middle East Data Resiliency Industry Analysis, Insights and Forecast, 2019-2031
- 10.1. Market Analysis, Insights and Forecast - by Deployment
- 10.1.1. On-premise
- 10.1.2. Cloud
- 10.2. Market Analysis, Insights and Forecast - by End-user Vertical
- 10.2.1. BFSI
- 10.2.2. IT & Telecommunication
- 10.2.3. Government
- 10.2.4. Manufacturing
- 10.2.5. Healthcare
- 10.2.6. Other End-user Vertical
- 10.1. Market Analysis, Insights and Forecast - by Deployment
- 11. North America Data Resiliency Industry Analysis, Insights and Forecast, 2019-2031
- 11.1. Market Analysis, Insights and Forecast - By Country/Sub-region
- 11.1.1 United States
- 11.1.2 Canada
- 11.1.3 Mexico
- 12. Europe Data Resiliency Industry Analysis, Insights and Forecast, 2019-2031
- 12.1. Market Analysis, Insights and Forecast - By Country/Sub-region
- 12.1.1 Germany
- 12.1.2 United Kingdom
- 12.1.3 France
- 12.1.4 Spain
- 12.1.5 Italy
- 12.1.6 Spain
- 12.1.7 Belgium
- 12.1.8 Netherland
- 12.1.9 Nordics
- 12.1.10 Rest of Europe
- 13. Asia Pacific Data Resiliency Industry Analysis, Insights and Forecast, 2019-2031
- 13.1. Market Analysis, Insights and Forecast - By Country/Sub-region
- 13.1.1 China
- 13.1.2 Japan
- 13.1.3 India
- 13.1.4 South Korea
- 13.1.5 Southeast Asia
- 13.1.6 Australia
- 13.1.7 Indonesia
- 13.1.8 Phillipes
- 13.1.9 Singapore
- 13.1.10 Thailandc
- 13.1.11 Rest of Asia Pacific
- 14. South America Data Resiliency Industry Analysis, Insights and Forecast, 2019-2031
- 14.1. Market Analysis, Insights and Forecast - By Country/Sub-region
- 14.1.1 Brazil
- 14.1.2 Argentina
- 14.1.3 Peru
- 14.1.4 Chile
- 14.1.5 Colombia
- 14.1.6 Ecuador
- 14.1.7 Venezuela
- 14.1.8 Rest of South America
- 15. North America Data Resiliency Industry Analysis, Insights and Forecast, 2019-2031
- 15.1. Market Analysis, Insights and Forecast - By Country/Sub-region
- 15.1.1 United States
- 15.1.2 Canada
- 15.1.3 Mexico
- 16. MEA Data Resiliency Industry Analysis, Insights and Forecast, 2019-2031
- 16.1. Market Analysis, Insights and Forecast - By Country/Sub-region
- 16.1.1 United Arab Emirates
- 16.1.2 Saudi Arabia
- 16.1.3 South Africa
- 16.1.4 Rest of Middle East and Africa
- 17. Competitive Analysis
- 17.1. Global Market Share Analysis 2024
- 17.2. Company Profiles
- 17.2.1 IBM Corporation
- 17.2.1.1. Overview
- 17.2.1.2. Products
- 17.2.1.3. SWOT Analysis
- 17.2.1.4. Recent Developments
- 17.2.1.5. Financials (Based on Availability)
- 17.2.2 Asigra Inc
- 17.2.2.1. Overview
- 17.2.2.2. Products
- 17.2.2.3. SWOT Analysis
- 17.2.2.4. Recent Developments
- 17.2.2.5. Financials (Based on Availability)
- 17.2.3 CenturyLink Inc
- 17.2.3.1. Overview
- 17.2.3.2. Products
- 17.2.3.3. SWOT Analysis
- 17.2.3.4. Recent Developments
- 17.2.3.5. Financials (Based on Availability)
- 17.2.4 VMware Inc (Dell Technologies Inc )
- 17.2.4.1. Overview
- 17.2.4.2. Products
- 17.2.4.3. SWOT Analysis
- 17.2.4.4. Recent Developments
- 17.2.4.5. Financials (Based on Availability)
- 17.2.5 Veritas Technologies LLC
- 17.2.5.1. Overview
- 17.2.5.2. Products
- 17.2.5.3. SWOT Analysis
- 17.2.5.4. Recent Developments
- 17.2.5.5. Financials (Based on Availability)
- 17.2.6 Microsoft Corporation
- 17.2.6.1. Overview
- 17.2.6.2. Products
- 17.2.6.3. SWOT Analysis
- 17.2.6.4. Recent Developments
- 17.2.6.5. Financials (Based on Availability)
- 17.2.7 NetApp Inc
- 17.2.7.1. Overview
- 17.2.7.2. Products
- 17.2.7.3. SWOT Analysis
- 17.2.7.4. Recent Developments
- 17.2.7.5. Financials (Based on Availability)
- 17.2.8 Carbonite Inc (OpenText Corporation)
- 17.2.8.1. Overview
- 17.2.8.2. Products
- 17.2.8.3. SWOT Analysis
- 17.2.8.4. Recent Developments
- 17.2.8.5. Financials (Based on Availability)
- 17.2.9 Acronis International GmbH
- 17.2.9.1. Overview
- 17.2.9.2. Products
- 17.2.9.3. SWOT Analysis
- 17.2.9.4. Recent Developments
- 17.2.9.5. Financials (Based on Availability)
- 17.2.10 Micro Focus International plc
- 17.2.10.1. Overview
- 17.2.10.2. Products
- 17.2.10.3. SWOT Analysis
- 17.2.10.4. Recent Developments
- 17.2.10.5. Financials (Based on Availability)
- 17.2.11 Commvault Systems Inc
- 17.2.11.1. Overview
- 17.2.11.2. Products
- 17.2.11.3. SWOT Analysis
- 17.2.11.4. Recent Developments
- 17.2.11.5. Financials (Based on Availability)
- 17.2.1 IBM Corporation
List of Figures
- Figure 1: Global Data Resiliency Industry Revenue Breakdown (Million, %) by Region 2024 & 2032
- Figure 2: Global Data Resiliency Industry Volume Breakdown (K Unit, %) by Region 2024 & 2032
- Figure 3: North America Data Resiliency Industry Revenue (Million), by Country 2024 & 2032
- Figure 4: North America Data Resiliency Industry Volume (K Unit), by Country 2024 & 2032
- Figure 5: North America Data Resiliency Industry Revenue Share (%), by Country 2024 & 2032
- Figure 6: North America Data Resiliency Industry Volume Share (%), by Country 2024 & 2032
- Figure 7: Europe Data Resiliency Industry Revenue (Million), by Country 2024 & 2032
- Figure 8: Europe Data Resiliency Industry Volume (K Unit), by Country 2024 & 2032
- Figure 9: Europe Data Resiliency Industry Revenue Share (%), by Country 2024 & 2032
- Figure 10: Europe Data Resiliency Industry Volume Share (%), by Country 2024 & 2032
- Figure 11: Asia Pacific Data Resiliency Industry Revenue (Million), by Country 2024 & 2032
- Figure 12: Asia Pacific Data Resiliency Industry Volume (K Unit), by Country 2024 & 2032
- Figure 13: Asia Pacific Data Resiliency Industry Revenue Share (%), by Country 2024 & 2032
- Figure 14: Asia Pacific Data Resiliency Industry Volume Share (%), by Country 2024 & 2032
- Figure 15: South America Data Resiliency Industry Revenue (Million), by Country 2024 & 2032
- Figure 16: South America Data Resiliency Industry Volume (K Unit), by Country 2024 & 2032
- Figure 17: South America Data Resiliency Industry Revenue Share (%), by Country 2024 & 2032
- Figure 18: South America Data Resiliency Industry Volume Share (%), by Country 2024 & 2032
- Figure 19: North America Data Resiliency Industry Revenue (Million), by Country 2024 & 2032
- Figure 20: North America Data Resiliency Industry Volume (K Unit), by Country 2024 & 2032
- Figure 21: North America Data Resiliency Industry Revenue Share (%), by Country 2024 & 2032
- Figure 22: North America Data Resiliency Industry Volume Share (%), by Country 2024 & 2032
- Figure 23: MEA Data Resiliency Industry Revenue (Million), by Country 2024 & 2032
- Figure 24: MEA Data Resiliency Industry Volume (K Unit), by Country 2024 & 2032
- Figure 25: MEA Data Resiliency Industry Revenue Share (%), by Country 2024 & 2032
- Figure 26: MEA Data Resiliency Industry Volume Share (%), by Country 2024 & 2032
- Figure 27: North America Data Resiliency Industry Revenue (Million), by Deployment 2024 & 2032
- Figure 28: North America Data Resiliency Industry Volume (K Unit), by Deployment 2024 & 2032
- Figure 29: North America Data Resiliency Industry Revenue Share (%), by Deployment 2024 & 2032
- Figure 30: North America Data Resiliency Industry Volume Share (%), by Deployment 2024 & 2032
- Figure 31: North America Data Resiliency Industry Revenue (Million), by End-user Vertical 2024 & 2032
- Figure 32: North America Data Resiliency Industry Volume (K Unit), by End-user Vertical 2024 & 2032
- Figure 33: North America Data Resiliency Industry Revenue Share (%), by End-user Vertical 2024 & 2032
- Figure 34: North America Data Resiliency Industry Volume Share (%), by End-user Vertical 2024 & 2032
- Figure 35: North America Data Resiliency Industry Revenue (Million), by Country 2024 & 2032
- Figure 36: North America Data Resiliency Industry Volume (K Unit), by Country 2024 & 2032
- Figure 37: North America Data Resiliency Industry Revenue Share (%), by Country 2024 & 2032
- Figure 38: North America Data Resiliency Industry Volume Share (%), by Country 2024 & 2032
- Figure 39: Europe Data Resiliency Industry Revenue (Million), by Deployment 2024 & 2032
- Figure 40: Europe Data Resiliency Industry Volume (K Unit), by Deployment 2024 & 2032
- Figure 41: Europe Data Resiliency Industry Revenue Share (%), by Deployment 2024 & 2032
- Figure 42: Europe Data Resiliency Industry Volume Share (%), by Deployment 2024 & 2032
- Figure 43: Europe Data Resiliency Industry Revenue (Million), by End-user Vertical 2024 & 2032
- Figure 44: Europe Data Resiliency Industry Volume (K Unit), by End-user Vertical 2024 & 2032
- Figure 45: Europe Data Resiliency Industry Revenue Share (%), by End-user Vertical 2024 & 2032
- Figure 46: Europe Data Resiliency Industry Volume Share (%), by End-user Vertical 2024 & 2032
- Figure 47: Europe Data Resiliency Industry Revenue (Million), by Country 2024 & 2032
- Figure 48: Europe Data Resiliency Industry Volume (K Unit), by Country 2024 & 2032
- Figure 49: Europe Data Resiliency Industry Revenue Share (%), by Country 2024 & 2032
- Figure 50: Europe Data Resiliency Industry Volume Share (%), by Country 2024 & 2032
- Figure 51: Asia Pacific Data Resiliency Industry Revenue (Million), by Deployment 2024 & 2032
- Figure 52: Asia Pacific Data Resiliency Industry Volume (K Unit), by Deployment 2024 & 2032
- Figure 53: Asia Pacific Data Resiliency Industry Revenue Share (%), by Deployment 2024 & 2032
- Figure 54: Asia Pacific Data Resiliency Industry Volume Share (%), by Deployment 2024 & 2032
- Figure 55: Asia Pacific Data Resiliency Industry Revenue (Million), by End-user Vertical 2024 & 2032
- Figure 56: Asia Pacific Data Resiliency Industry Volume (K Unit), by End-user Vertical 2024 & 2032
- Figure 57: Asia Pacific Data Resiliency Industry Revenue Share (%), by End-user Vertical 2024 & 2032
- Figure 58: Asia Pacific Data Resiliency Industry Volume Share (%), by End-user Vertical 2024 & 2032
- Figure 59: Asia Pacific Data Resiliency Industry Revenue (Million), by Country 2024 & 2032
- Figure 60: Asia Pacific Data Resiliency Industry Volume (K Unit), by Country 2024 & 2032
- Figure 61: Asia Pacific Data Resiliency Industry Revenue Share (%), by Country 2024 & 2032
- Figure 62: Asia Pacific Data Resiliency Industry Volume Share (%), by Country 2024 & 2032
- Figure 63: Latin America Data Resiliency Industry Revenue (Million), by Deployment 2024 & 2032
- Figure 64: Latin America Data Resiliency Industry Volume (K Unit), by Deployment 2024 & 2032
- Figure 65: Latin America Data Resiliency Industry Revenue Share (%), by Deployment 2024 & 2032
- Figure 66: Latin America Data Resiliency Industry Volume Share (%), by Deployment 2024 & 2032
- Figure 67: Latin America Data Resiliency Industry Revenue (Million), by End-user Vertical 2024 & 2032
- Figure 68: Latin America Data Resiliency Industry Volume (K Unit), by End-user Vertical 2024 & 2032
- Figure 69: Latin America Data Resiliency Industry Revenue Share (%), by End-user Vertical 2024 & 2032
- Figure 70: Latin America Data Resiliency Industry Volume Share (%), by End-user Vertical 2024 & 2032
- Figure 71: Latin America Data Resiliency Industry Revenue (Million), by Country 2024 & 2032
- Figure 72: Latin America Data Resiliency Industry Volume (K Unit), by Country 2024 & 2032
- Figure 73: Latin America Data Resiliency Industry Revenue Share (%), by Country 2024 & 2032
- Figure 74: Latin America Data Resiliency Industry Volume Share (%), by Country 2024 & 2032
- Figure 75: Middle East Data Resiliency Industry Revenue (Million), by Deployment 2024 & 2032
- Figure 76: Middle East Data Resiliency Industry Volume (K Unit), by Deployment 2024 & 2032
- Figure 77: Middle East Data Resiliency Industry Revenue Share (%), by Deployment 2024 & 2032
- Figure 78: Middle East Data Resiliency Industry Volume Share (%), by Deployment 2024 & 2032
- Figure 79: Middle East Data Resiliency Industry Revenue (Million), by End-user Vertical 2024 & 2032
- Figure 80: Middle East Data Resiliency Industry Volume (K Unit), by End-user Vertical 2024 & 2032
- Figure 81: Middle East Data Resiliency Industry Revenue Share (%), by End-user Vertical 2024 & 2032
- Figure 82: Middle East Data Resiliency Industry Volume Share (%), by End-user Vertical 2024 & 2032
- Figure 83: Middle East Data Resiliency Industry Revenue (Million), by Country 2024 & 2032
- Figure 84: Middle East Data Resiliency Industry Volume (K Unit), by Country 2024 & 2032
- Figure 85: Middle East Data Resiliency Industry Revenue Share (%), by Country 2024 & 2032
- Figure 86: Middle East Data Resiliency Industry Volume Share (%), by Country 2024 & 2032
List of Tables
- Table 1: Global Data Resiliency Industry Revenue Million Forecast, by Region 2019 & 2032
- Table 2: Global Data Resiliency Industry Volume K Unit Forecast, by Region 2019 & 2032
- Table 3: Global Data Resiliency Industry Revenue Million Forecast, by Deployment 2019 & 2032
- Table 4: Global Data Resiliency Industry Volume K Unit Forecast, by Deployment 2019 & 2032
- Table 5: Global Data Resiliency Industry Revenue Million Forecast, by End-user Vertical 2019 & 2032
- Table 6: Global Data Resiliency Industry Volume K Unit Forecast, by End-user Vertical 2019 & 2032
- Table 7: Global Data Resiliency Industry Revenue Million Forecast, by Region 2019 & 2032
- Table 8: Global Data Resiliency Industry Volume K Unit Forecast, by Region 2019 & 2032
- Table 9: Global Data Resiliency Industry Revenue Million Forecast, by Country 2019 & 2032
- Table 10: Global Data Resiliency Industry Volume K Unit Forecast, by Country 2019 & 2032
- Table 11: United States Data Resiliency Industry Revenue (Million) Forecast, by Application 2019 & 2032
- Table 12: United States Data Resiliency Industry Volume (K Unit) Forecast, by Application 2019 & 2032
- Table 13: Canada Data Resiliency Industry Revenue (Million) Forecast, by Application 2019 & 2032
- Table 14: Canada Data Resiliency Industry Volume (K Unit) Forecast, by Application 2019 & 2032
- Table 15: Mexico Data Resiliency Industry Revenue (Million) Forecast, by Application 2019 & 2032
- Table 16: Mexico Data Resiliency Industry Volume (K Unit) Forecast, by Application 2019 & 2032
- Table 17: Global Data Resiliency Industry Revenue Million Forecast, by Country 2019 & 2032
- Table 18: Global Data Resiliency Industry Volume K Unit Forecast, by Country 2019 & 2032
- Table 19: Germany Data Resiliency Industry Revenue (Million) Forecast, by Application 2019 & 2032
- Table 20: Germany Data Resiliency Industry Volume (K Unit) Forecast, by Application 2019 & 2032
- Table 21: United Kingdom Data Resiliency Industry Revenue (Million) Forecast, by Application 2019 & 2032
- Table 22: United Kingdom Data Resiliency Industry Volume (K Unit) Forecast, by Application 2019 & 2032
- Table 23: France Data Resiliency Industry Revenue (Million) Forecast, by Application 2019 & 2032
- Table 24: France Data Resiliency Industry Volume (K Unit) Forecast, by Application 2019 & 2032
- Table 25: Spain Data Resiliency Industry Revenue (Million) Forecast, by Application 2019 & 2032
- Table 26: Spain Data Resiliency Industry Volume (K Unit) Forecast, by Application 2019 & 2032
- Table 27: Italy Data Resiliency Industry Revenue (Million) Forecast, by Application 2019 & 2032
- Table 28: Italy Data Resiliency Industry Volume (K Unit) Forecast, by Application 2019 & 2032
- Table 29: Spain Data Resiliency Industry Revenue (Million) Forecast, by Application 2019 & 2032
- Table 30: Spain Data Resiliency Industry Volume (K Unit) Forecast, by Application 2019 & 2032
- Table 31: Belgium Data Resiliency Industry Revenue (Million) Forecast, by Application 2019 & 2032
- Table 32: Belgium Data Resiliency Industry Volume (K Unit) Forecast, by Application 2019 & 2032
- Table 33: Netherland Data Resiliency Industry Revenue (Million) Forecast, by Application 2019 & 2032
- Table 34: Netherland Data Resiliency Industry Volume (K Unit) Forecast, by Application 2019 & 2032
- Table 35: Nordics Data Resiliency Industry Revenue (Million) Forecast, by Application 2019 & 2032
- Table 36: Nordics Data Resiliency Industry Volume (K Unit) Forecast, by Application 2019 & 2032
- Table 37: Rest of Europe Data Resiliency Industry Revenue (Million) Forecast, by Application 2019 & 2032
- Table 38: Rest of Europe Data Resiliency Industry Volume (K Unit) Forecast, by Application 2019 & 2032
- Table 39: Global Data Resiliency Industry Revenue Million Forecast, by Country 2019 & 2032
- Table 40: Global Data Resiliency Industry Volume K Unit Forecast, by Country 2019 & 2032
- Table 41: China Data Resiliency Industry Revenue (Million) Forecast, by Application 2019 & 2032
- Table 42: China Data Resiliency Industry Volume (K Unit) Forecast, by Application 2019 & 2032
- Table 43: Japan Data Resiliency Industry Revenue (Million) Forecast, by Application 2019 & 2032
- Table 44: Japan Data Resiliency Industry Volume (K Unit) Forecast, by Application 2019 & 2032
- Table 45: India Data Resiliency Industry Revenue (Million) Forecast, by Application 2019 & 2032
- Table 46: India Data Resiliency Industry Volume (K Unit) Forecast, by Application 2019 & 2032
- Table 47: South Korea Data Resiliency Industry Revenue (Million) Forecast, by Application 2019 & 2032
- Table 48: South Korea Data Resiliency Industry Volume (K Unit) Forecast, by Application 2019 & 2032
- Table 49: Southeast Asia Data Resiliency Industry Revenue (Million) Forecast, by Application 2019 & 2032
- Table 50: Southeast Asia Data Resiliency Industry Volume (K Unit) Forecast, by Application 2019 & 2032
- Table 51: Australia Data Resiliency Industry Revenue (Million) Forecast, by Application 2019 & 2032
- Table 52: Australia Data Resiliency Industry Volume (K Unit) Forecast, by Application 2019 & 2032
- Table 53: Indonesia Data Resiliency Industry Revenue (Million) Forecast, by Application 2019 & 2032
- Table 54: Indonesia Data Resiliency Industry Volume (K Unit) Forecast, by Application 2019 & 2032
- Table 55: Phillipes Data Resiliency Industry Revenue (Million) Forecast, by Application 2019 & 2032
- Table 56: Phillipes Data Resiliency Industry Volume (K Unit) Forecast, by Application 2019 & 2032
- Table 57: Singapore Data Resiliency Industry Revenue (Million) Forecast, by Application 2019 & 2032
- Table 58: Singapore Data Resiliency Industry Volume (K Unit) Forecast, by Application 2019 & 2032
- Table 59: Thailandc Data Resiliency Industry Revenue (Million) Forecast, by Application 2019 & 2032
- Table 60: Thailandc Data Resiliency Industry Volume (K Unit) Forecast, by Application 2019 & 2032
- Table 61: Rest of Asia Pacific Data Resiliency Industry Revenue (Million) Forecast, by Application 2019 & 2032
- Table 62: Rest of Asia Pacific Data Resiliency Industry Volume (K Unit) Forecast, by Application 2019 & 2032
- Table 63: Global Data Resiliency Industry Revenue Million Forecast, by Country 2019 & 2032
- Table 64: Global Data Resiliency Industry Volume K Unit Forecast, by Country 2019 & 2032
- Table 65: Brazil Data Resiliency Industry Revenue (Million) Forecast, by Application 2019 & 2032
- Table 66: Brazil Data Resiliency Industry Volume (K Unit) Forecast, by Application 2019 & 2032
- Table 67: Argentina Data Resiliency Industry Revenue (Million) Forecast, by Application 2019 & 2032
- Table 68: Argentina Data Resiliency Industry Volume (K Unit) Forecast, by Application 2019 & 2032
- Table 69: Peru Data Resiliency Industry Revenue (Million) Forecast, by Application 2019 & 2032
- Table 70: Peru Data Resiliency Industry Volume (K Unit) Forecast, by Application 2019 & 2032
- Table 71: Chile Data Resiliency Industry Revenue (Million) Forecast, by Application 2019 & 2032
- Table 72: Chile Data Resiliency Industry Volume (K Unit) Forecast, by Application 2019 & 2032
- Table 73: Colombia Data Resiliency Industry Revenue (Million) Forecast, by Application 2019 & 2032
- Table 74: Colombia Data Resiliency Industry Volume (K Unit) Forecast, by Application 2019 & 2032
- Table 75: Ecuador Data Resiliency Industry Revenue (Million) Forecast, by Application 2019 & 2032
- Table 76: Ecuador Data Resiliency Industry Volume (K Unit) Forecast, by Application 2019 & 2032
- Table 77: Venezuela Data Resiliency Industry Revenue (Million) Forecast, by Application 2019 & 2032
- Table 78: Venezuela Data Resiliency Industry Volume (K Unit) Forecast, by Application 2019 & 2032
- Table 79: Rest of South America Data Resiliency Industry Revenue (Million) Forecast, by Application 2019 & 2032
- Table 80: Rest of South America Data Resiliency Industry Volume (K Unit) Forecast, by Application 2019 & 2032
- Table 81: Global Data Resiliency Industry Revenue Million Forecast, by Country 2019 & 2032
- Table 82: Global Data Resiliency Industry Volume K Unit Forecast, by Country 2019 & 2032
- Table 83: United States Data Resiliency Industry Revenue (Million) Forecast, by Application 2019 & 2032
- Table 84: United States Data Resiliency Industry Volume (K Unit) Forecast, by Application 2019 & 2032
- Table 85: Canada Data Resiliency Industry Revenue (Million) Forecast, by Application 2019 & 2032
- Table 86: Canada Data Resiliency Industry Volume (K Unit) Forecast, by Application 2019 & 2032
- Table 87: Mexico Data Resiliency Industry Revenue (Million) Forecast, by Application 2019 & 2032
- Table 88: Mexico Data Resiliency Industry Volume (K Unit) Forecast, by Application 2019 & 2032
- Table 89: Global Data Resiliency Industry Revenue Million Forecast, by Country 2019 & 2032
- Table 90: Global Data Resiliency Industry Volume K Unit Forecast, by Country 2019 & 2032
- Table 91: United Arab Emirates Data Resiliency Industry Revenue (Million) Forecast, by Application 2019 & 2032
- Table 92: United Arab Emirates Data Resiliency Industry Volume (K Unit) Forecast, by Application 2019 & 2032
- Table 93: Saudi Arabia Data Resiliency Industry Revenue (Million) Forecast, by Application 2019 & 2032
- Table 94: Saudi Arabia Data Resiliency Industry Volume (K Unit) Forecast, by Application 2019 & 2032
- Table 95: South Africa Data Resiliency Industry Revenue (Million) Forecast, by Application 2019 & 2032
- Table 96: South Africa Data Resiliency Industry Volume (K Unit) Forecast, by Application 2019 & 2032
- Table 97: Rest of Middle East and Africa Data Resiliency Industry Revenue (Million) Forecast, by Application 2019 & 2032
- Table 98: Rest of Middle East and Africa Data Resiliency Industry Volume (K Unit) Forecast, by Application 2019 & 2032
- Table 99: Global Data Resiliency Industry Revenue Million Forecast, by Deployment 2019 & 2032
- Table 100: Global Data Resiliency Industry Volume K Unit Forecast, by Deployment 2019 & 2032
- Table 101: Global Data Resiliency Industry Revenue Million Forecast, by End-user Vertical 2019 & 2032
- Table 102: Global Data Resiliency Industry Volume K Unit Forecast, by End-user Vertical 2019 & 2032
- Table 103: Global Data Resiliency Industry Revenue Million Forecast, by Country 2019 & 2032
- Table 104: Global Data Resiliency Industry Volume K Unit Forecast, by Country 2019 & 2032
- Table 105: Global Data Resiliency Industry Revenue Million Forecast, by Deployment 2019 & 2032
- Table 106: Global Data Resiliency Industry Volume K Unit Forecast, by Deployment 2019 & 2032
- Table 107: Global Data Resiliency Industry Revenue Million Forecast, by End-user Vertical 2019 & 2032
- Table 108: Global Data Resiliency Industry Volume K Unit Forecast, by End-user Vertical 2019 & 2032
- Table 109: Global Data Resiliency Industry Revenue Million Forecast, by Country 2019 & 2032
- Table 110: Global Data Resiliency Industry Volume K Unit Forecast, by Country 2019 & 2032
- Table 111: Global Data Resiliency Industry Revenue Million Forecast, by Deployment 2019 & 2032
- Table 112: Global Data Resiliency Industry Volume K Unit Forecast, by Deployment 2019 & 2032
- Table 113: Global Data Resiliency Industry Revenue Million Forecast, by End-user Vertical 2019 & 2032
- Table 114: Global Data Resiliency Industry Volume K Unit Forecast, by End-user Vertical 2019 & 2032
- Table 115: Global Data Resiliency Industry Revenue Million Forecast, by Country 2019 & 2032
- Table 116: Global Data Resiliency Industry Volume K Unit Forecast, by Country 2019 & 2032
- Table 117: Global Data Resiliency Industry Revenue Million Forecast, by Deployment 2019 & 2032
- Table 118: Global Data Resiliency Industry Volume K Unit Forecast, by Deployment 2019 & 2032
- Table 119: Global Data Resiliency Industry Revenue Million Forecast, by End-user Vertical 2019 & 2032
- Table 120: Global Data Resiliency Industry Volume K Unit Forecast, by End-user Vertical 2019 & 2032
- Table 121: Global Data Resiliency Industry Revenue Million Forecast, by Country 2019 & 2032
- Table 122: Global Data Resiliency Industry Volume K Unit Forecast, by Country 2019 & 2032
- Table 123: Global Data Resiliency Industry Revenue Million Forecast, by Deployment 2019 & 2032
- Table 124: Global Data Resiliency Industry Volume K Unit Forecast, by Deployment 2019 & 2032
- Table 125: Global Data Resiliency Industry Revenue Million Forecast, by End-user Vertical 2019 & 2032
- Table 126: Global Data Resiliency Industry Volume K Unit Forecast, by End-user Vertical 2019 & 2032
- Table 127: Global Data Resiliency Industry Revenue Million Forecast, by Country 2019 & 2032
- Table 128: Global Data Resiliency Industry Volume K Unit Forecast, by Country 2019 & 2032
Frequently Asked Questions
1. What is the projected Compound Annual Growth Rate (CAGR) of the Data Resiliency Industry?
The projected CAGR is approximately 15.38%.
2. Which companies are prominent players in the Data Resiliency Industry?
Key companies in the market include IBM Corporation, Asigra Inc, CenturyLink Inc, VMware Inc (Dell Technologies Inc ), Veritas Technologies LLC, Microsoft Corporation, NetApp Inc, Carbonite Inc (OpenText Corporation), Acronis International GmbH, Micro Focus International plc, Commvault Systems Inc.
3. What are the main segments of the Data Resiliency Industry?
The market segments include Deployment, End-user Vertical.
4. Can you provide details about the market size?
The market size is estimated to be USD 18.65 Million as of 2022.
5. What are some drivers contributing to market growth?
; Rapid Growth in Data being Generated from Multiple Sources; Increasing Privacy Concerns and Rising Need for Data Security.
6. What are the notable trends driving market growth?
BFSI Segment is Expected to Witness Significant Growth.
7. Are there any restraints impacting market growth?
; Availability of open-source alternatives.
8. Can you provide examples of recent developments in the market?
N/A
9. What pricing options are available for accessing the report?
Pricing options include single-user, multi-user, and enterprise licenses priced at USD 4750, USD 5250, and USD 8750 respectively.
10. Is the market size provided in terms of value or volume?
The market size is provided in terms of value, measured in Million and volume, measured in K Unit.
11. Are there any specific market keywords associated with the report?
Yes, the market keyword associated with the report is "Data Resiliency Industry," which aids in identifying and referencing the specific market segment covered.
12. How do I determine which pricing option suits my needs best?
The pricing options vary based on user requirements and access needs. Individual users may opt for single-user licenses, while businesses requiring broader access may choose multi-user or enterprise licenses for cost-effective access to the report.
13. Are there any additional resources or data provided in the Data Resiliency Industry report?
While the report offers comprehensive insights, it's advisable to review the specific contents or supplementary materials provided to ascertain if additional resources or data are available.
14. How can I stay updated on further developments or reports in the Data Resiliency Industry?
To stay informed about further developments, trends, and reports in the Data Resiliency Industry, consider subscribing to industry newsletters, following relevant companies and organizations, or regularly checking reputable industry news sources and publications.
Methodology
Step 1 - Identification of Relevant Samples Size from Population Database


Step 2 - Approaches for Defining Global Market Size (Value, Volume* & Price*)

Note*: In applicable scenarios
Step 3 - Data Sources
Primary Research
- Web Analytics
- Survey Reports
- Research Institute
- Latest Research Reports
- Opinion Leaders
Secondary Research
- Annual Reports
- White Paper
- Latest Press Release
- Industry Association
- Paid Database
- Investor Presentations

Step 4 - Data Triangulation
Involves using different sources of information in order to increase the validity of a study
These sources are likely to be stakeholders in a program - participants, other researchers, program staff, other community members, and so on.
Then we put all data in single framework & apply various statistical tools to find out the dynamic on the market.
During the analysis stage, feedback from the stakeholder groups would be compared to determine areas of agreement as well as areas of divergence


