
Key Insights
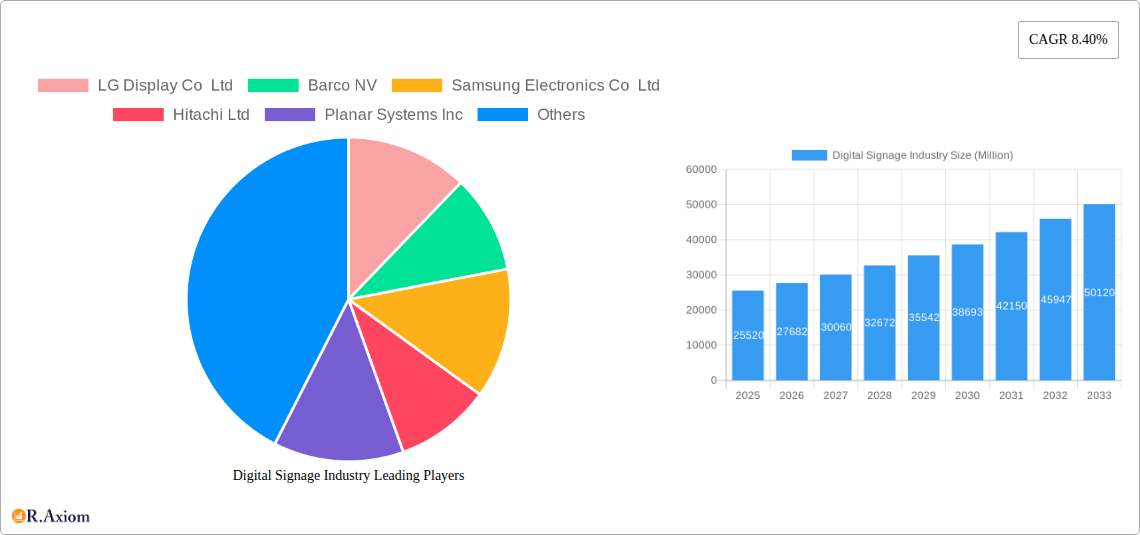
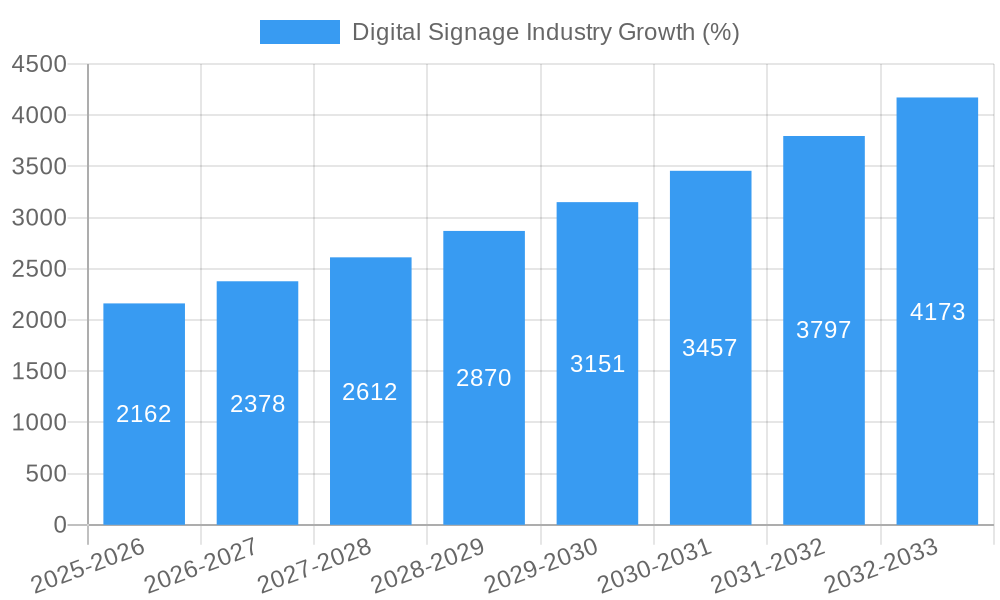
The digital signage market, valued at $25.52 billion in 2025, is experiencing robust growth, projected to expand at a compound annual growth rate (CAGR) of 8.40% from 2025 to 2033. This expansion is fueled by several key drivers. The increasing adoption of digital signage across diverse sectors, including retail (for enhanced customer engagement and targeted advertising), transportation (for informative displays and advertising revenue generation), and hospitality (for wayfinding and brand promotion), is a major catalyst. Furthermore, technological advancements, such as the development of higher-resolution displays, interactive features, and improved content management systems, are enhancing the appeal and functionality of digital signage solutions. The rise of programmatic advertising capabilities within digital signage networks allows for more precise targeting and optimized ad spending, further bolstering market growth. The shift towards smart cities and the growing need for effective communication in public spaces also contribute significantly to market expansion. Different screen sizes cater to various applications, with larger displays frequently used in outdoor environments and corporate settings, while smaller screens are common in retail and hospitality. Hardware components, software solutions, and ongoing services collectively constitute the market's value chain, indicating a diverse and interconnected ecosystem.
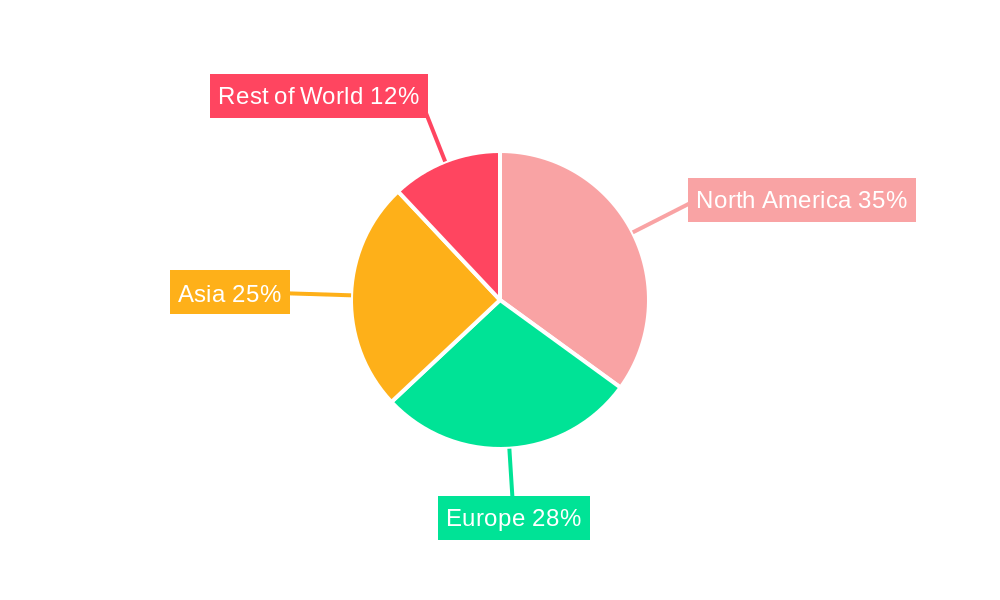
However, market growth faces some challenges. The high initial investment cost associated with implementing digital signage systems can be a barrier to entry for smaller businesses. Furthermore, the need for ongoing maintenance and content updates represents a recurring expense. Competition among established players and emerging technology providers could influence pricing strategies and market share dynamics. Despite these restraints, the long-term outlook for the digital signage market remains positive, driven by continuous innovation, expanding applications, and the increasing demand for efficient and impactful communication strategies across multiple industries. The market segmentation by component (hardware, software, services), screen size (below 32”, 32”-52”, above 52”), location (in-store, outdoor), application (retail, transportation, hospitality, etc.), and type (video wall, video screen, kiosk, etc.) provides insights into the diverse nature and varied opportunities within this growing market. Geographic analysis, encompassing regions like North America, Asia, Europe, and others, reveals regional variations in market penetration and growth potential, influenced by factors such as economic development, technological infrastructure, and consumer behavior.
Digital Signage Industry Market Report: 2019-2033
This comprehensive report provides a detailed analysis of the digital signage industry, covering market size, segmentation, key players, growth drivers, challenges, and future outlook. With a study period spanning 2019-2033, a base year of 2025, and an estimated and forecast period of 2025-2033, this report offers invaluable insights for industry stakeholders, investors, and businesses seeking to understand and capitalize on the opportunities within this dynamic market. The report projects a xx Million market value by 2033, representing a significant CAGR of xx%.
Digital Signage Industry Market Concentration & Innovation
The digital signage market is characterized by a moderately concentrated landscape, with a few dominant players holding significant market share. Companies like Samsung Electronics Co Ltd, LG Display Co Ltd, and NEC Display Solutions Ltd currently command a large portion of the global market, estimated at xx Million in 2025. However, the industry also exhibits a high level of innovation, driven by advancements in display technology (e.g., LED, OLED, MicroLED), software capabilities (content management systems, analytics), and connectivity (cloud-based solutions).
- Market Share: Samsung Electronics Co Ltd holds an estimated xx% market share, followed by LG Display Co Ltd with xx% and NEC Display Solutions Ltd with xx%.
- Innovation Drivers: Advancements in display technology, software solutions, and connectivity are major drivers.
- Regulatory Frameworks: Regulations concerning data privacy and advertising compliance influence market dynamics.
- Product Substitutes: Traditional advertising methods (billboards, print media) pose some level of substitution.
- End-User Trends: Growing demand for interactive and personalized digital signage experiences.
- M&A Activities: The industry has witnessed several mergers and acquisitions (M&A) in recent years, with deal values totaling an estimated xx Million in the last five years. These activities often aim to expand market reach, enhance product portfolios, and integrate technologies.
Digital Signage Industry Industry Trends & Insights
The digital signage market is experiencing robust growth, driven by several key factors. The increasing adoption of digital signage across various sectors—retail, transportation, hospitality, and corporate—is a major contributor. This is further fueled by technological advancements enabling higher resolution, improved interactivity, and data-driven insights. Consumer preferences are shifting towards more engaging and personalized digital experiences, leading to a demand for sophisticated content management systems and analytics tools. The competitive landscape remains dynamic, with established players and new entrants vying for market share through product innovation and strategic partnerships. The market is projected to reach xx Million by 2033, with a CAGR of xx%. Market penetration in key sectors like retail and transportation is steadily increasing, reaching an estimated xx% in 2025.
Dominant Markets & Segments in Digital Signage Industry
The North American market currently dominates the global digital signage landscape due to factors such as high technological adoption, robust economic conditions, and a well-developed retail infrastructure. Within the segmentation:
Key Drivers:
- Retail: High consumer traffic and the need for effective brand promotion.
- In-store Location: Direct engagement with consumers at the point of sale.
- Video Screen Type: High demand for clear visuals and a broad range of sizes.
- 32'-52' Size: This segment represents the optimal balance between viewing distance, cost, and resolution.
Dominance Analysis: The in-store retail segment in North America holds the largest market share, driven by the high concentration of retail businesses and the increasing adoption of digital signage for enhanced customer experiences. The 32'-52' screen size range dominates due to its versatility and applicability across various settings. The video screen type remains most prevalent due to established technology and mass adoption.
Digital Signage Industry Product Developments
Recent product innovations emphasize higher resolutions, improved brightness, and integrated smart features like touchscreens and interactive capabilities. The market is witnessing a surge in the adoption of cloud-based content management systems which streamline content delivery and reduce management complexities. These advancements offer improved user experience and enhanced operational efficiency, bolstering the competitive advantages of leading players.
Report Scope & Segmentation Analysis
This report segments the digital signage market across multiple dimensions:
Component: Hardware (xx Million in 2025), Other Hardware (xx Million in 2025), Software (xx Million in 2025), and Services (xx Million in 2025). The Hardware segment is the largest, reflecting the significant investment required in display technology.
Size: Below 32' (xx Million in 2025), 32'-52' (xx Million in 2025), and Above 52' (xx Million in 2025). The 32'-52' size range holds the highest market share.
Location: In-store (xx Million in 2025) and Outdoor (xx Million in 2025). In-store deployments dominate due to high consumer traffic.
Application: Retail (xx Million in 2025), Transportation (xx Million in 2025), Hospitality (xx Million in 2025), Corporate (xx Million in 2025), Education (xx Million in 2025), Government (xx Million in 2025), and Other Applications (xx Million in 2025). Retail and Transportation are major application areas.
Type: Video Wall (xx Million in 2025), Video Screen (xx Million in 2025), Kiosk (xx Million in 2025), Transparent LCD Screen (xx Million in 2025), Digital Poster (xx Million in 2025), and Other Types (xx Million in 2025). Video screens remain the dominant type due to their versatility and wide applicability. Each segment exhibits unique growth projections and competitive dynamics, detailed in the full report.
Key Drivers of Digital Signage Industry Growth
Technological advancements, particularly in display technology and software capabilities, are a primary driver. The increasing need for effective and engaging customer communication across various industries fuels demand. Economic factors, like increasing disposable incomes and rising consumer spending, also contribute to the market's growth. Government initiatives promoting smart cities and digital infrastructure further bolster adoption rates.
Challenges in the Digital Signage Industry Sector
High initial investment costs for hardware and software can be a barrier to entry for smaller businesses. Supply chain disruptions and fluctuations in raw material prices impact profitability. Intense competition among established players and the emergence of new entrants create a challenging environment. Furthermore, regulatory compliance and data security concerns add complexity to operations.
Emerging Opportunities in Digital Signage Industry
The growing adoption of Artificial Intelligence (AI) and machine learning (ML) in digital signage offers opportunities for personalized content delivery and advanced analytics. Expansion into new application areas, such as healthcare and smart homes, represents significant potential for growth. The integration of interactive technologies and augmented reality (AR) can further enhance user engagement and attract new customers.
Leading Players in the Digital Signage Industry Market
- LG Display Co Ltd
- Barco NV
- Samsung Electronics Co Ltd
- Hitachi Ltd
- Planar Systems Inc
- Cisco Systems Inc
- NEC Display Solutions Ltd
- Goodview
- Panasonic Corporation
- Stratacache
- Sony Corporation
Key Developments in Digital Signage Industry Industry
- May 2024: Quest Technology Management and Samsung Electronics America launch a managed service for SMBs via Telarus.
- March 2024: Quest Technology Management and Samsung announce a partnership offering a holistic digital signage service through Telarus. These collaborations highlight the industry's movement towards comprehensive, managed solutions, catering to the evolving needs of businesses of all sizes.
Strategic Outlook for Digital Signage Industry Market
The digital signage market is poised for continued growth, driven by technological innovations, expanding applications, and the increasing demand for engaging customer experiences. The focus on integrated solutions, data analytics, and interactive technologies will shape future market dynamics. New market segments and applications will emerge, creating opportunities for both established players and new entrants. The strategic adoption of AI and AR technologies will be crucial for achieving a competitive edge and driving further market expansion.
Digital Signage Industry Segmentation
-
1. Type
- 1.1. Video Wall
- 1.2. Video Screen
- 1.3. Kiosk
- 1.4. Transparent LCD Screen
- 1.5. Digital Poster
- 1.6. Other Types
-
2. Component
-
2.1. Hardware
- 2.1.1. LCD/LED Display
- 2.1.2. OLED Display
- 2.1.3. Media Players
- 2.1.4. Projector/Projection Screens
- 2.1.5. Other Hardware
- 2.2. Software
- 2.3. Services
-
2.1. Hardware
-
3. Size
- 3.1. Below 32'
- 3.2. 32' - 52'
- 3.3. Above 52'
-
4. Location
- 4.1. In-store
- 4.2. Outdoor
-
5. Application
- 5.1. Retail
- 5.2. Transportation
- 5.3. Hospitality
- 5.4. Corporate
- 5.5. Education
- 5.6. Government
- 5.7. Other Applications
Digital Signage Industry Segmentation By Geography
- 1. North America
- 2. Asia
- 3. Australia and New Zealand
- 4. Europe
- 5. Latin America
- 6. Middle East and Africa
Digital Signage Industry REPORT HIGHLIGHTS
| Aspects | Details |
|---|---|
| Study Period | 2019-2033 |
| Base Year | 2024 |
| Estimated Year | 2025 |
| Forecast Period | 2025-2033 |
| Historical Period | 2019-2024 |
| Growth Rate | CAGR of 8.40% from 2019-2033 |
| Segmentation |
|
Table of Contents
- 1. Introduction
- 1.1. Research Scope
- 1.2. Market Segmentation
- 1.3. Research Methodology
- 1.4. Definitions and Assumptions
- 2. Executive Summary
- 2.1. Introduction
- 3. Market Dynamics
- 3.1. Introduction
- 3.2. Market Drivers
- 3.2.1. Convergence of Digital Signage with Cross-platform Media Tool; Evolution of Turnkey Solutions; Diminishing Cost of Infrastructure Leading to Higher Penetration
- 3.3. Market Restrains
- 3.3.1. Poor Integration with Complex Business Requirements
- 3.4. Market Trends
- 3.4.1. OLED Display is Expected to Experience Healthy Growth
- 4. Market Factor Analysis
- 4.1. Porters Five Forces
- 4.2. Supply/Value Chain
- 4.3. PESTEL analysis
- 4.4. Market Entropy
- 4.5. Patent/Trademark Analysis
- 5. Global Digital Signage Industry Analysis, Insights and Forecast, 2019-2031
- 5.1. Market Analysis, Insights and Forecast - by Type
- 5.1.1. Video Wall
- 5.1.2. Video Screen
- 5.1.3. Kiosk
- 5.1.4. Transparent LCD Screen
- 5.1.5. Digital Poster
- 5.1.6. Other Types
- 5.2. Market Analysis, Insights and Forecast - by Component
- 5.2.1. Hardware
- 5.2.1.1. LCD/LED Display
- 5.2.1.2. OLED Display
- 5.2.1.3. Media Players
- 5.2.1.4. Projector/Projection Screens
- 5.2.1.5. Other Hardware
- 5.2.2. Software
- 5.2.3. Services
- 5.2.1. Hardware
- 5.3. Market Analysis, Insights and Forecast - by Size
- 5.3.1. Below 32'
- 5.3.2. 32' - 52'
- 5.3.3. Above 52'
- 5.4. Market Analysis, Insights and Forecast - by Location
- 5.4.1. In-store
- 5.4.2. Outdoor
- 5.5. Market Analysis, Insights and Forecast - by Application
- 5.5.1. Retail
- 5.5.2. Transportation
- 5.5.3. Hospitality
- 5.5.4. Corporate
- 5.5.5. Education
- 5.5.6. Government
- 5.5.7. Other Applications
- 5.6. Market Analysis, Insights and Forecast - by Region
- 5.6.1. North America
- 5.6.2. Asia
- 5.6.3. Australia and New Zealand
- 5.6.4. Europe
- 5.6.5. Latin America
- 5.6.6. Middle East and Africa
- 5.1. Market Analysis, Insights and Forecast - by Type
- 6. North America Digital Signage Industry Analysis, Insights and Forecast, 2019-2031
- 6.1. Market Analysis, Insights and Forecast - by Type
- 6.1.1. Video Wall
- 6.1.2. Video Screen
- 6.1.3. Kiosk
- 6.1.4. Transparent LCD Screen
- 6.1.5. Digital Poster
- 6.1.6. Other Types
- 6.2. Market Analysis, Insights and Forecast - by Component
- 6.2.1. Hardware
- 6.2.1.1. LCD/LED Display
- 6.2.1.2. OLED Display
- 6.2.1.3. Media Players
- 6.2.1.4. Projector/Projection Screens
- 6.2.1.5. Other Hardware
- 6.2.2. Software
- 6.2.3. Services
- 6.2.1. Hardware
- 6.3. Market Analysis, Insights and Forecast - by Size
- 6.3.1. Below 32'
- 6.3.2. 32' - 52'
- 6.3.3. Above 52'
- 6.4. Market Analysis, Insights and Forecast - by Location
- 6.4.1. In-store
- 6.4.2. Outdoor
- 6.5. Market Analysis, Insights and Forecast - by Application
- 6.5.1. Retail
- 6.5.2. Transportation
- 6.5.3. Hospitality
- 6.5.4. Corporate
- 6.5.5. Education
- 6.5.6. Government
- 6.5.7. Other Applications
- 6.1. Market Analysis, Insights and Forecast - by Type
- 7. Asia Digital Signage Industry Analysis, Insights and Forecast, 2019-2031
- 7.1. Market Analysis, Insights and Forecast - by Type
- 7.1.1. Video Wall
- 7.1.2. Video Screen
- 7.1.3. Kiosk
- 7.1.4. Transparent LCD Screen
- 7.1.5. Digital Poster
- 7.1.6. Other Types
- 7.2. Market Analysis, Insights and Forecast - by Component
- 7.2.1. Hardware
- 7.2.1.1. LCD/LED Display
- 7.2.1.2. OLED Display
- 7.2.1.3. Media Players
- 7.2.1.4. Projector/Projection Screens
- 7.2.1.5. Other Hardware
- 7.2.2. Software
- 7.2.3. Services
- 7.2.1. Hardware
- 7.3. Market Analysis, Insights and Forecast - by Size
- 7.3.1. Below 32'
- 7.3.2. 32' - 52'
- 7.3.3. Above 52'
- 7.4. Market Analysis, Insights and Forecast - by Location
- 7.4.1. In-store
- 7.4.2. Outdoor
- 7.5. Market Analysis, Insights and Forecast - by Application
- 7.5.1. Retail
- 7.5.2. Transportation
- 7.5.3. Hospitality
- 7.5.4. Corporate
- 7.5.5. Education
- 7.5.6. Government
- 7.5.7. Other Applications
- 7.1. Market Analysis, Insights and Forecast - by Type
- 8. Australia and New Zealand Digital Signage Industry Analysis, Insights and Forecast, 2019-2031
- 8.1. Market Analysis, Insights and Forecast - by Type
- 8.1.1. Video Wall
- 8.1.2. Video Screen
- 8.1.3. Kiosk
- 8.1.4. Transparent LCD Screen
- 8.1.5. Digital Poster
- 8.1.6. Other Types
- 8.2. Market Analysis, Insights and Forecast - by Component
- 8.2.1. Hardware
- 8.2.1.1. LCD/LED Display
- 8.2.1.2. OLED Display
- 8.2.1.3. Media Players
- 8.2.1.4. Projector/Projection Screens
- 8.2.1.5. Other Hardware
- 8.2.2. Software
- 8.2.3. Services
- 8.2.1. Hardware
- 8.3. Market Analysis, Insights and Forecast - by Size
- 8.3.1. Below 32'
- 8.3.2. 32' - 52'
- 8.3.3. Above 52'
- 8.4. Market Analysis, Insights and Forecast - by Location
- 8.4.1. In-store
- 8.4.2. Outdoor
- 8.5. Market Analysis, Insights and Forecast - by Application
- 8.5.1. Retail
- 8.5.2. Transportation
- 8.5.3. Hospitality
- 8.5.4. Corporate
- 8.5.5. Education
- 8.5.6. Government
- 8.5.7. Other Applications
- 8.1. Market Analysis, Insights and Forecast - by Type
- 9. Europe Digital Signage Industry Analysis, Insights and Forecast, 2019-2031
- 9.1. Market Analysis, Insights and Forecast - by Type
- 9.1.1. Video Wall
- 9.1.2. Video Screen
- 9.1.3. Kiosk
- 9.1.4. Transparent LCD Screen
- 9.1.5. Digital Poster
- 9.1.6. Other Types
- 9.2. Market Analysis, Insights and Forecast - by Component
- 9.2.1. Hardware
- 9.2.1.1. LCD/LED Display
- 9.2.1.2. OLED Display
- 9.2.1.3. Media Players
- 9.2.1.4. Projector/Projection Screens
- 9.2.1.5. Other Hardware
- 9.2.2. Software
- 9.2.3. Services
- 9.2.1. Hardware
- 9.3. Market Analysis, Insights and Forecast - by Size
- 9.3.1. Below 32'
- 9.3.2. 32' - 52'
- 9.3.3. Above 52'
- 9.4. Market Analysis, Insights and Forecast - by Location
- 9.4.1. In-store
- 9.4.2. Outdoor
- 9.5. Market Analysis, Insights and Forecast - by Application
- 9.5.1. Retail
- 9.5.2. Transportation
- 9.5.3. Hospitality
- 9.5.4. Corporate
- 9.5.5. Education
- 9.5.6. Government
- 9.5.7. Other Applications
- 9.1. Market Analysis, Insights and Forecast - by Type
- 10. Latin America Digital Signage Industry Analysis, Insights and Forecast, 2019-2031
- 10.1. Market Analysis, Insights and Forecast - by Type
- 10.1.1. Video Wall
- 10.1.2. Video Screen
- 10.1.3. Kiosk
- 10.1.4. Transparent LCD Screen
- 10.1.5. Digital Poster
- 10.1.6. Other Types
- 10.2. Market Analysis, Insights and Forecast - by Component
- 10.2.1. Hardware
- 10.2.1.1. LCD/LED Display
- 10.2.1.2. OLED Display
- 10.2.1.3. Media Players
- 10.2.1.4. Projector/Projection Screens
- 10.2.1.5. Other Hardware
- 10.2.2. Software
- 10.2.3. Services
- 10.2.1. Hardware
- 10.3. Market Analysis, Insights and Forecast - by Size
- 10.3.1. Below 32'
- 10.3.2. 32' - 52'
- 10.3.3. Above 52'
- 10.4. Market Analysis, Insights and Forecast - by Location
- 10.4.1. In-store
- 10.4.2. Outdoor
- 10.5. Market Analysis, Insights and Forecast - by Application
- 10.5.1. Retail
- 10.5.2. Transportation
- 10.5.3. Hospitality
- 10.5.4. Corporate
- 10.5.5. Education
- 10.5.6. Government
- 10.5.7. Other Applications
- 10.1. Market Analysis, Insights and Forecast - by Type
- 11. Middle East and Africa Digital Signage Industry Analysis, Insights and Forecast, 2019-2031
- 11.1. Market Analysis, Insights and Forecast - by Type
- 11.1.1. Video Wall
- 11.1.2. Video Screen
- 11.1.3. Kiosk
- 11.1.4. Transparent LCD Screen
- 11.1.5. Digital Poster
- 11.1.6. Other Types
- 11.2. Market Analysis, Insights and Forecast - by Component
- 11.2.1. Hardware
- 11.2.1.1. LCD/LED Display
- 11.2.1.2. OLED Display
- 11.2.1.3. Media Players
- 11.2.1.4. Projector/Projection Screens
- 11.2.1.5. Other Hardware
- 11.2.2. Software
- 11.2.3. Services
- 11.2.1. Hardware
- 11.3. Market Analysis, Insights and Forecast - by Size
- 11.3.1. Below 32'
- 11.3.2. 32' - 52'
- 11.3.3. Above 52'
- 11.4. Market Analysis, Insights and Forecast - by Location
- 11.4.1. In-store
- 11.4.2. Outdoor
- 11.5. Market Analysis, Insights and Forecast - by Application
- 11.5.1. Retail
- 11.5.2. Transportation
- 11.5.3. Hospitality
- 11.5.4. Corporate
- 11.5.5. Education
- 11.5.6. Government
- 11.5.7. Other Applications
- 11.1. Market Analysis, Insights and Forecast - by Type
- 12. North America Digital Signage Industry Analysis, Insights and Forecast, 2019-2031
- 12.1. Market Analysis, Insights and Forecast - By Country/Sub-region
- 12.1.1.
- 13. Asia Digital Signage Industry Analysis, Insights and Forecast, 2019-2031
- 13.1. Market Analysis, Insights and Forecast - By Country/Sub-region
- 13.1.1.
- 14. Australia and New Zealand Digital Signage Industry Analysis, Insights and Forecast, 2019-2031
- 14.1. Market Analysis, Insights and Forecast - By Country/Sub-region
- 14.1.1.
- 15. Europe Digital Signage Industry Analysis, Insights and Forecast, 2019-2031
- 15.1. Market Analysis, Insights and Forecast - By Country/Sub-region
- 15.1.1.
- 16. Latin America Digital Signage Industry Analysis, Insights and Forecast, 2019-2031
- 16.1. Market Analysis, Insights and Forecast - By Country/Sub-region
- 16.1.1.
- 17. Middle East and Africa Digital Signage Industry Analysis, Insights and Forecast, 2019-2031
- 17.1. Market Analysis, Insights and Forecast - By Country/Sub-region
- 17.1.1.
- 18. Competitive Analysis
- 18.1. Global Market Share Analysis 2024
- 18.2. Company Profiles
- 18.2.1 LG Display Co Ltd
- 18.2.1.1. Overview
- 18.2.1.2. Products
- 18.2.1.3. SWOT Analysis
- 18.2.1.4. Recent Developments
- 18.2.1.5. Financials (Based on Availability)
- 18.2.2 Barco NV
- 18.2.2.1. Overview
- 18.2.2.2. Products
- 18.2.2.3. SWOT Analysis
- 18.2.2.4. Recent Developments
- 18.2.2.5. Financials (Based on Availability)
- 18.2.3 Samsung Electronics Co Ltd
- 18.2.3.1. Overview
- 18.2.3.2. Products
- 18.2.3.3. SWOT Analysis
- 18.2.3.4. Recent Developments
- 18.2.3.5. Financials (Based on Availability)
- 18.2.4 Hitachi Ltd
- 18.2.4.1. Overview
- 18.2.4.2. Products
- 18.2.4.3. SWOT Analysis
- 18.2.4.4. Recent Developments
- 18.2.4.5. Financials (Based on Availability)
- 18.2.5 Planar Systems Inc
- 18.2.5.1. Overview
- 18.2.5.2. Products
- 18.2.5.3. SWOT Analysis
- 18.2.5.4. Recent Developments
- 18.2.5.5. Financials (Based on Availability)
- 18.2.6 Cisco Systems Inc
- 18.2.6.1. Overview
- 18.2.6.2. Products
- 18.2.6.3. SWOT Analysis
- 18.2.6.4. Recent Developments
- 18.2.6.5. Financials (Based on Availability)
- 18.2.7 NEC Display Solutions Ltd
- 18.2.7.1. Overview
- 18.2.7.2. Products
- 18.2.7.3. SWOT Analysis
- 18.2.7.4. Recent Developments
- 18.2.7.5. Financials (Based on Availability)
- 18.2.8 Goodview
- 18.2.8.1. Overview
- 18.2.8.2. Products
- 18.2.8.3. SWOT Analysis
- 18.2.8.4. Recent Developments
- 18.2.8.5. Financials (Based on Availability)
- 18.2.9 Panasonic Corporation
- 18.2.9.1. Overview
- 18.2.9.2. Products
- 18.2.9.3. SWOT Analysis
- 18.2.9.4. Recent Developments
- 18.2.9.5. Financials (Based on Availability)
- 18.2.10 Stratacache
- 18.2.10.1. Overview
- 18.2.10.2. Products
- 18.2.10.3. SWOT Analysis
- 18.2.10.4. Recent Developments
- 18.2.10.5. Financials (Based on Availability)
- 18.2.11 Sony Corporation
- 18.2.11.1. Overview
- 18.2.11.2. Products
- 18.2.11.3. SWOT Analysis
- 18.2.11.4. Recent Developments
- 18.2.11.5. Financials (Based on Availability)
- 18.2.1 LG Display Co Ltd
List of Figures
- Figure 1: Global Digital Signage Industry Revenue Breakdown (Million, %) by Region 2024 & 2032
- Figure 2: North America Digital Signage Industry Revenue (Million), by Country 2024 & 2032
- Figure 3: North America Digital Signage Industry Revenue Share (%), by Country 2024 & 2032
- Figure 4: Asia Digital Signage Industry Revenue (Million), by Country 2024 & 2032
- Figure 5: Asia Digital Signage Industry Revenue Share (%), by Country 2024 & 2032
- Figure 6: Australia and New Zealand Digital Signage Industry Revenue (Million), by Country 2024 & 2032
- Figure 7: Australia and New Zealand Digital Signage Industry Revenue Share (%), by Country 2024 & 2032
- Figure 8: Europe Digital Signage Industry Revenue (Million), by Country 2024 & 2032
- Figure 9: Europe Digital Signage Industry Revenue Share (%), by Country 2024 & 2032
- Figure 10: Latin America Digital Signage Industry Revenue (Million), by Country 2024 & 2032
- Figure 11: Latin America Digital Signage Industry Revenue Share (%), by Country 2024 & 2032
- Figure 12: Middle East and Africa Digital Signage Industry Revenue (Million), by Country 2024 & 2032
- Figure 13: Middle East and Africa Digital Signage Industry Revenue Share (%), by Country 2024 & 2032
- Figure 14: North America Digital Signage Industry Revenue (Million), by Type 2024 & 2032
- Figure 15: North America Digital Signage Industry Revenue Share (%), by Type 2024 & 2032
- Figure 16: North America Digital Signage Industry Revenue (Million), by Component 2024 & 2032
- Figure 17: North America Digital Signage Industry Revenue Share (%), by Component 2024 & 2032
- Figure 18: North America Digital Signage Industry Revenue (Million), by Size 2024 & 2032
- Figure 19: North America Digital Signage Industry Revenue Share (%), by Size 2024 & 2032
- Figure 20: North America Digital Signage Industry Revenue (Million), by Location 2024 & 2032
- Figure 21: North America Digital Signage Industry Revenue Share (%), by Location 2024 & 2032
- Figure 22: North America Digital Signage Industry Revenue (Million), by Application 2024 & 2032
- Figure 23: North America Digital Signage Industry Revenue Share (%), by Application 2024 & 2032
- Figure 24: North America Digital Signage Industry Revenue (Million), by Country 2024 & 2032
- Figure 25: North America Digital Signage Industry Revenue Share (%), by Country 2024 & 2032
- Figure 26: Asia Digital Signage Industry Revenue (Million), by Type 2024 & 2032
- Figure 27: Asia Digital Signage Industry Revenue Share (%), by Type 2024 & 2032
- Figure 28: Asia Digital Signage Industry Revenue (Million), by Component 2024 & 2032
- Figure 29: Asia Digital Signage Industry Revenue Share (%), by Component 2024 & 2032
- Figure 30: Asia Digital Signage Industry Revenue (Million), by Size 2024 & 2032
- Figure 31: Asia Digital Signage Industry Revenue Share (%), by Size 2024 & 2032
- Figure 32: Asia Digital Signage Industry Revenue (Million), by Location 2024 & 2032
- Figure 33: Asia Digital Signage Industry Revenue Share (%), by Location 2024 & 2032
- Figure 34: Asia Digital Signage Industry Revenue (Million), by Application 2024 & 2032
- Figure 35: Asia Digital Signage Industry Revenue Share (%), by Application 2024 & 2032
- Figure 36: Asia Digital Signage Industry Revenue (Million), by Country 2024 & 2032
- Figure 37: Asia Digital Signage Industry Revenue Share (%), by Country 2024 & 2032
- Figure 38: Australia and New Zealand Digital Signage Industry Revenue (Million), by Type 2024 & 2032
- Figure 39: Australia and New Zealand Digital Signage Industry Revenue Share (%), by Type 2024 & 2032
- Figure 40: Australia and New Zealand Digital Signage Industry Revenue (Million), by Component 2024 & 2032
- Figure 41: Australia and New Zealand Digital Signage Industry Revenue Share (%), by Component 2024 & 2032
- Figure 42: Australia and New Zealand Digital Signage Industry Revenue (Million), by Size 2024 & 2032
- Figure 43: Australia and New Zealand Digital Signage Industry Revenue Share (%), by Size 2024 & 2032
- Figure 44: Australia and New Zealand Digital Signage Industry Revenue (Million), by Location 2024 & 2032
- Figure 45: Australia and New Zealand Digital Signage Industry Revenue Share (%), by Location 2024 & 2032
- Figure 46: Australia and New Zealand Digital Signage Industry Revenue (Million), by Application 2024 & 2032
- Figure 47: Australia and New Zealand Digital Signage Industry Revenue Share (%), by Application 2024 & 2032
- Figure 48: Australia and New Zealand Digital Signage Industry Revenue (Million), by Country 2024 & 2032
- Figure 49: Australia and New Zealand Digital Signage Industry Revenue Share (%), by Country 2024 & 2032
- Figure 50: Europe Digital Signage Industry Revenue (Million), by Type 2024 & 2032
- Figure 51: Europe Digital Signage Industry Revenue Share (%), by Type 2024 & 2032
- Figure 52: Europe Digital Signage Industry Revenue (Million), by Component 2024 & 2032
- Figure 53: Europe Digital Signage Industry Revenue Share (%), by Component 2024 & 2032
- Figure 54: Europe Digital Signage Industry Revenue (Million), by Size 2024 & 2032
- Figure 55: Europe Digital Signage Industry Revenue Share (%), by Size 2024 & 2032
- Figure 56: Europe Digital Signage Industry Revenue (Million), by Location 2024 & 2032
- Figure 57: Europe Digital Signage Industry Revenue Share (%), by Location 2024 & 2032
- Figure 58: Europe Digital Signage Industry Revenue (Million), by Application 2024 & 2032
- Figure 59: Europe Digital Signage Industry Revenue Share (%), by Application 2024 & 2032
- Figure 60: Europe Digital Signage Industry Revenue (Million), by Country 2024 & 2032
- Figure 61: Europe Digital Signage Industry Revenue Share (%), by Country 2024 & 2032
- Figure 62: Latin America Digital Signage Industry Revenue (Million), by Type 2024 & 2032
- Figure 63: Latin America Digital Signage Industry Revenue Share (%), by Type 2024 & 2032
- Figure 64: Latin America Digital Signage Industry Revenue (Million), by Component 2024 & 2032
- Figure 65: Latin America Digital Signage Industry Revenue Share (%), by Component 2024 & 2032
- Figure 66: Latin America Digital Signage Industry Revenue (Million), by Size 2024 & 2032
- Figure 67: Latin America Digital Signage Industry Revenue Share (%), by Size 2024 & 2032
- Figure 68: Latin America Digital Signage Industry Revenue (Million), by Location 2024 & 2032
- Figure 69: Latin America Digital Signage Industry Revenue Share (%), by Location 2024 & 2032
- Figure 70: Latin America Digital Signage Industry Revenue (Million), by Application 2024 & 2032
- Figure 71: Latin America Digital Signage Industry Revenue Share (%), by Application 2024 & 2032
- Figure 72: Latin America Digital Signage Industry Revenue (Million), by Country 2024 & 2032
- Figure 73: Latin America Digital Signage Industry Revenue Share (%), by Country 2024 & 2032
- Figure 74: Middle East and Africa Digital Signage Industry Revenue (Million), by Type 2024 & 2032
- Figure 75: Middle East and Africa Digital Signage Industry Revenue Share (%), by Type 2024 & 2032
- Figure 76: Middle East and Africa Digital Signage Industry Revenue (Million), by Component 2024 & 2032
- Figure 77: Middle East and Africa Digital Signage Industry Revenue Share (%), by Component 2024 & 2032
- Figure 78: Middle East and Africa Digital Signage Industry Revenue (Million), by Size 2024 & 2032
- Figure 79: Middle East and Africa Digital Signage Industry Revenue Share (%), by Size 2024 & 2032
- Figure 80: Middle East and Africa Digital Signage Industry Revenue (Million), by Location 2024 & 2032
- Figure 81: Middle East and Africa Digital Signage Industry Revenue Share (%), by Location 2024 & 2032
- Figure 82: Middle East and Africa Digital Signage Industry Revenue (Million), by Application 2024 & 2032
- Figure 83: Middle East and Africa Digital Signage Industry Revenue Share (%), by Application 2024 & 2032
- Figure 84: Middle East and Africa Digital Signage Industry Revenue (Million), by Country 2024 & 2032
- Figure 85: Middle East and Africa Digital Signage Industry Revenue Share (%), by Country 2024 & 2032
List of Tables
- Table 1: Global Digital Signage Industry Revenue Million Forecast, by Region 2019 & 2032
- Table 2: Global Digital Signage Industry Revenue Million Forecast, by Type 2019 & 2032
- Table 3: Global Digital Signage Industry Revenue Million Forecast, by Component 2019 & 2032
- Table 4: Global Digital Signage Industry Revenue Million Forecast, by Size 2019 & 2032
- Table 5: Global Digital Signage Industry Revenue Million Forecast, by Location 2019 & 2032
- Table 6: Global Digital Signage Industry Revenue Million Forecast, by Application 2019 & 2032
- Table 7: Global Digital Signage Industry Revenue Million Forecast, by Region 2019 & 2032
- Table 8: Global Digital Signage Industry Revenue Million Forecast, by Country 2019 & 2032
- Table 9: Digital Signage Industry Revenue (Million) Forecast, by Application 2019 & 2032
- Table 10: Global Digital Signage Industry Revenue Million Forecast, by Country 2019 & 2032
- Table 11: Digital Signage Industry Revenue (Million) Forecast, by Application 2019 & 2032
- Table 12: Global Digital Signage Industry Revenue Million Forecast, by Country 2019 & 2032
- Table 13: Digital Signage Industry Revenue (Million) Forecast, by Application 2019 & 2032
- Table 14: Global Digital Signage Industry Revenue Million Forecast, by Country 2019 & 2032
- Table 15: Digital Signage Industry Revenue (Million) Forecast, by Application 2019 & 2032
- Table 16: Global Digital Signage Industry Revenue Million Forecast, by Country 2019 & 2032
- Table 17: Digital Signage Industry Revenue (Million) Forecast, by Application 2019 & 2032
- Table 18: Global Digital Signage Industry Revenue Million Forecast, by Country 2019 & 2032
- Table 19: Digital Signage Industry Revenue (Million) Forecast, by Application 2019 & 2032
- Table 20: Global Digital Signage Industry Revenue Million Forecast, by Type 2019 & 2032
- Table 21: Global Digital Signage Industry Revenue Million Forecast, by Component 2019 & 2032
- Table 22: Global Digital Signage Industry Revenue Million Forecast, by Size 2019 & 2032
- Table 23: Global Digital Signage Industry Revenue Million Forecast, by Location 2019 & 2032
- Table 24: Global Digital Signage Industry Revenue Million Forecast, by Application 2019 & 2032
- Table 25: Global Digital Signage Industry Revenue Million Forecast, by Country 2019 & 2032
- Table 26: Global Digital Signage Industry Revenue Million Forecast, by Type 2019 & 2032
- Table 27: Global Digital Signage Industry Revenue Million Forecast, by Component 2019 & 2032
- Table 28: Global Digital Signage Industry Revenue Million Forecast, by Size 2019 & 2032
- Table 29: Global Digital Signage Industry Revenue Million Forecast, by Location 2019 & 2032
- Table 30: Global Digital Signage Industry Revenue Million Forecast, by Application 2019 & 2032
- Table 31: Global Digital Signage Industry Revenue Million Forecast, by Country 2019 & 2032
- Table 32: Global Digital Signage Industry Revenue Million Forecast, by Type 2019 & 2032
- Table 33: Global Digital Signage Industry Revenue Million Forecast, by Component 2019 & 2032
- Table 34: Global Digital Signage Industry Revenue Million Forecast, by Size 2019 & 2032
- Table 35: Global Digital Signage Industry Revenue Million Forecast, by Location 2019 & 2032
- Table 36: Global Digital Signage Industry Revenue Million Forecast, by Application 2019 & 2032
- Table 37: Global Digital Signage Industry Revenue Million Forecast, by Country 2019 & 2032
- Table 38: Global Digital Signage Industry Revenue Million Forecast, by Type 2019 & 2032
- Table 39: Global Digital Signage Industry Revenue Million Forecast, by Component 2019 & 2032
- Table 40: Global Digital Signage Industry Revenue Million Forecast, by Size 2019 & 2032
- Table 41: Global Digital Signage Industry Revenue Million Forecast, by Location 2019 & 2032
- Table 42: Global Digital Signage Industry Revenue Million Forecast, by Application 2019 & 2032
- Table 43: Global Digital Signage Industry Revenue Million Forecast, by Country 2019 & 2032
- Table 44: Global Digital Signage Industry Revenue Million Forecast, by Type 2019 & 2032
- Table 45: Global Digital Signage Industry Revenue Million Forecast, by Component 2019 & 2032
- Table 46: Global Digital Signage Industry Revenue Million Forecast, by Size 2019 & 2032
- Table 47: Global Digital Signage Industry Revenue Million Forecast, by Location 2019 & 2032
- Table 48: Global Digital Signage Industry Revenue Million Forecast, by Application 2019 & 2032
- Table 49: Global Digital Signage Industry Revenue Million Forecast, by Country 2019 & 2032
- Table 50: Global Digital Signage Industry Revenue Million Forecast, by Type 2019 & 2032
- Table 51: Global Digital Signage Industry Revenue Million Forecast, by Component 2019 & 2032
- Table 52: Global Digital Signage Industry Revenue Million Forecast, by Size 2019 & 2032
- Table 53: Global Digital Signage Industry Revenue Million Forecast, by Location 2019 & 2032
- Table 54: Global Digital Signage Industry Revenue Million Forecast, by Application 2019 & 2032
- Table 55: Global Digital Signage Industry Revenue Million Forecast, by Country 2019 & 2032
Frequently Asked Questions
1. What is the projected Compound Annual Growth Rate (CAGR) of the Digital Signage Industry?
The projected CAGR is approximately 8.40%.
2. Which companies are prominent players in the Digital Signage Industry?
Key companies in the market include LG Display Co Ltd, Barco NV, Samsung Electronics Co Ltd, Hitachi Ltd, Planar Systems Inc, Cisco Systems Inc, NEC Display Solutions Ltd, Goodview, Panasonic Corporation, Stratacache, Sony Corporation.
3. What are the main segments of the Digital Signage Industry?
The market segments include Type, Component, Size, Location, Application.
4. Can you provide details about the market size?
The market size is estimated to be USD 25.52 Million as of 2022.
5. What are some drivers contributing to market growth?
Convergence of Digital Signage with Cross-platform Media Tool; Evolution of Turnkey Solutions; Diminishing Cost of Infrastructure Leading to Higher Penetration.
6. What are the notable trends driving market growth?
OLED Display is Expected to Experience Healthy Growth.
7. Are there any restraints impacting market growth?
Poor Integration with Complex Business Requirements.
8. Can you provide examples of recent developments in the market?
May 2024 - Quest Technology Management and Samsung Electronics America have collaborated to launch a pioneering managed service tailored for small and midsize businesses (SMBs). This service is available through Telarus technology advisors. The comprehensive package streamlines content and device management and features advanced displays, empowering SMB owners to revamp their business settings and enhance their brand's visibility.
9. What pricing options are available for accessing the report?
Pricing options include single-user, multi-user, and enterprise licenses priced at USD 4750, USD 5250, and USD 8750 respectively.
10. Is the market size provided in terms of value or volume?
The market size is provided in terms of value, measured in Million.
11. Are there any specific market keywords associated with the report?
Yes, the market keyword associated with the report is "Digital Signage Industry," which aids in identifying and referencing the specific market segment covered.
12. How do I determine which pricing option suits my needs best?
The pricing options vary based on user requirements and access needs. Individual users may opt for single-user licenses, while businesses requiring broader access may choose multi-user or enterprise licenses for cost-effective access to the report.
13. Are there any additional resources or data provided in the Digital Signage Industry report?
While the report offers comprehensive insights, it's advisable to review the specific contents or supplementary materials provided to ascertain if additional resources or data are available.
14. How can I stay updated on further developments or reports in the Digital Signage Industry?
To stay informed about further developments, trends, and reports in the Digital Signage Industry, consider subscribing to industry newsletters, following relevant companies and organizations, or regularly checking reputable industry news sources and publications.
Methodology
Step 1 - Identification of Relevant Samples Size from Population Database


Step 2 - Approaches for Defining Global Market Size (Value, Volume* & Price*)

Note*: In applicable scenarios
Step 3 - Data Sources
Primary Research
- Web Analytics
- Survey Reports
- Research Institute
- Latest Research Reports
- Opinion Leaders
Secondary Research
- Annual Reports
- White Paper
- Latest Press Release
- Industry Association
- Paid Database
- Investor Presentations

Step 4 - Data Triangulation
Involves using different sources of information in order to increase the validity of a study
These sources are likely to be stakeholders in a program - participants, other researchers, program staff, other community members, and so on.
Then we put all data in single framework & apply various statistical tools to find out the dynamic on the market.
During the analysis stage, feedback from the stakeholder groups would be compared to determine areas of agreement as well as areas of divergence


