
Key Insights
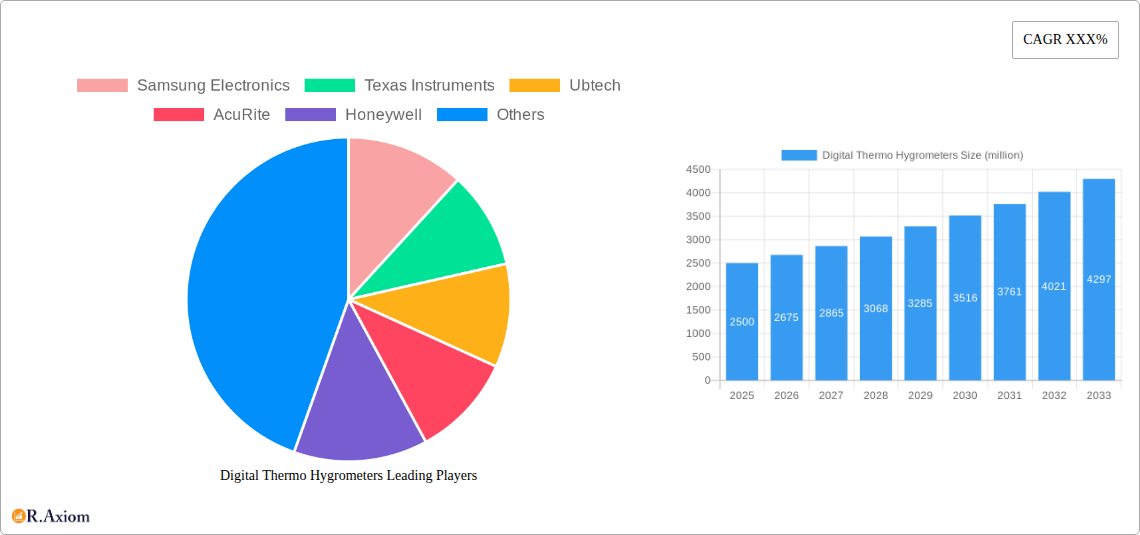
The global market for digital thermo-hygrometers is experiencing robust growth, driven by increasing demand across diverse sectors. The market, estimated at $2.5 billion in 2025, is projected to exhibit a Compound Annual Growth Rate (CAGR) of 7% from 2025 to 2033, reaching approximately $4.2 billion by 2033. This growth is fueled by several key factors. The expanding industrial automation sector necessitates precise environmental monitoring, significantly boosting demand for accurate and reliable digital thermo-hygrometers in manufacturing, pharmaceuticals, and food processing. Furthermore, the rising awareness of indoor air quality (IAQ) is driving consumer adoption in residential and commercial settings, particularly in smart homes and buildings equipped with IoT devices. Technological advancements, such as the integration of wireless connectivity and data logging capabilities, are also contributing to market expansion. Key players like Samsung, Texas Instruments, and Honeywell are continuously innovating to offer advanced features, enhanced accuracy, and improved user interfaces. While challenges remain, such as price sensitivity in certain market segments and competition from less sophisticated analog devices, the overall market outlook remains optimistic.
The competitive landscape is characterized by the presence of established players alongside emerging companies. Established players like Samsung Electronics and Honeywell leverage their brand recognition and extensive distribution networks to maintain a significant market share. Meanwhile, smaller players and innovative startups focus on niche applications or developing technologically advanced products with specific features like improved data analytics or integration with existing building management systems. Regional variations exist; North America and Europe currently hold a larger market share, owing to higher adoption rates and strong regulatory frameworks for environmental monitoring. However, emerging economies in Asia-Pacific are showing rapid growth, presenting substantial opportunities for market expansion. The increasing demand for precise environmental control in sectors such as data centers and healthcare facilities will continue to underpin the market's expansion in the coming years.
This comprehensive report provides a detailed analysis of the global Digital Thermo Hygrometers market, offering invaluable insights for industry stakeholders, investors, and market researchers. Spanning the period from 2019 to 2033, with a focus on the 2025-2033 forecast period, this report meticulously examines market trends, competitive dynamics, and future growth opportunities. The base year for this analysis is 2025. Millions are used for all value estimations.
Digital Thermo Hygrometers Market Concentration & Innovation
The global digital thermo hygrometer market exhibits a moderately concentrated landscape, with key players like Samsung Electronics, Honeywell, and Testo holding significant market share. However, numerous smaller players and regional manufacturers also contribute to the overall market volume. The market's innovation is driven by the demand for higher accuracy, enhanced connectivity features (e.g., IoT integration), and miniaturization for various applications. Stringent regulatory frameworks related to environmental monitoring and industrial safety influence product design and manufacturing. Product substitutes, such as less accurate mechanical devices, are being steadily replaced by the advantages offered by digital versions. End-user trends toward automation and data-driven decision-making are further driving market growth. Recent M&A activity has been moderate, with xx million in deal values recorded in the past 5 years, primarily involving smaller companies being acquired by larger players to expand their product portfolios and geographic reach.
- Market Share: Samsung Electronics (xx%), Honeywell (xx%), Testo (xx%), Others (xx%).
- M&A Deal Values (2019-2024): xx million.
- Key Innovation Drivers: IoT integration, improved accuracy, miniaturization, data logging capabilities.
Digital Thermo Hygrometers Industry Trends & Insights
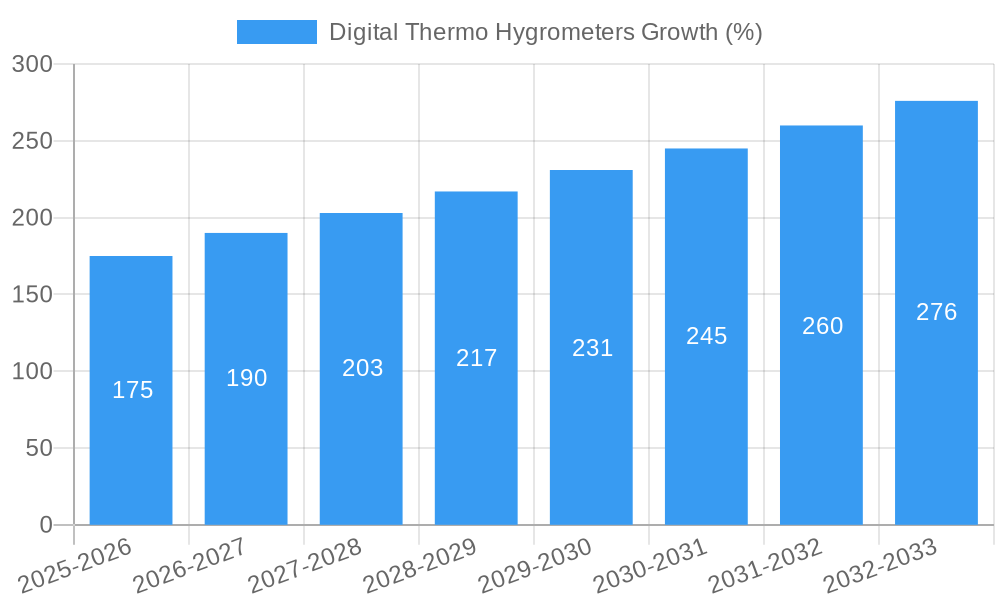
The global digital thermo hygrometer market is experiencing robust growth, projected to reach xx million units by 2033, with a CAGR of xx% during the forecast period (2025-2033). This growth is primarily fueled by increasing demand across diverse sectors, including industrial automation, healthcare, agriculture, and meteorology. Technological advancements such as improved sensor technology and the incorporation of advanced data analysis capabilities are revolutionizing the market. Consumer preferences are shifting towards compact, easy-to-use devices with enhanced data visualization and wireless connectivity. The competitive landscape is characterized by intense rivalry among established players and emerging companies, pushing innovation and driving down prices. Market penetration is increasing steadily, particularly in developing economies experiencing rapid industrialization.
Dominant Markets & Segments in Digital Thermo Hygrometers
North America currently dominates the digital thermo hygrometer market, driven by strong industrial automation, robust healthcare infrastructure, and high consumer adoption rates. Europe and Asia Pacific follow closely, with significant market potential in emerging economies.
- Key Drivers for North American Dominance:
- Advanced industrial infrastructure
- Stringent environmental regulations
- High consumer demand for precise climate control
- Substantial R&D investments
- Key Drivers for European growth: Stringent environmental regulations, high adoption in agricultural and industrial sectors.
- Key Drivers for Asia-Pacific growth: Rapid industrialization, rising disposable incomes, increasing awareness of environmental issues.
The market is segmented by product type (portable, stationary, industrial, etc.), application (HVAC, healthcare, agriculture, etc.), and end-user industry (manufacturing, pharmaceuticals, food processing, etc.). The industrial segment holds the largest market share due to the high demand for precise environmental monitoring and control in various industrial processes.
Digital Thermo Hygrometers Product Developments
Recent product developments in digital thermo hygrometers include the integration of wireless connectivity (Wi-Fi, Bluetooth), advanced data logging and analysis capabilities, and improved sensor technologies for increased accuracy and reliability. These innovations are enhancing the functionality and usability of the devices, catering to the needs of diverse end-users across various industries. The trend toward miniaturization and ruggedized designs is further enhancing market accessibility and expanding applications in harsh environments.
Report Scope & Segmentation Analysis
This report comprehensively segments the digital thermo hygrometer market by product type (portable, stationary, industrial), application (HVAC, healthcare, agriculture, meteorology), and end-user industry (manufacturing, pharmaceuticals, food processing, etc.). Each segment's growth projections, market size, and competitive dynamics are carefully analyzed, providing insights into the evolving market landscape. The industrial segment holds the highest market share, with a projected value of xx million by 2033. The healthcare and agricultural segments demonstrate strong growth potential.
Key Drivers of Digital Thermo Hygrometers Growth
The growth of the digital thermo hygrometer market is driven by several key factors: increasing automation across various industries, stringent environmental regulations necessitating accurate monitoring, rising consumer awareness regarding environmental control, and the advancement of sensor technology enabling improved accuracy and reliability. Government initiatives promoting sustainable practices also contribute to market expansion. Furthermore, the integration of IoT technologies enhances data management and facilitates remote monitoring, further boosting market growth.
Challenges in the Digital Thermo Hygrometers Sector
The digital thermo hygrometer market faces challenges including supply chain disruptions, especially concerning the availability of crucial components like sensors, competition from low-cost manufacturers, and the potential for standardization inconsistencies across different products. Regulatory hurdles and compliance requirements in certain regions can also impede market growth. These challenges, if not managed effectively, could negatively impact the market's growth trajectory by xx%.
Emerging Opportunities in Digital Thermo Hygrometers
Emerging opportunities include the integration of artificial intelligence (AI) and machine learning (ML) for predictive maintenance and improved data analysis, the expansion of the market into emerging economies, and the development of specialized sensors for specific applications in various industries like food safety and environmental monitoring. The development of sustainable and energy-efficient devices also presents a significant opportunity.
Leading Players in the Digital Thermo Hygrometers Market
- Samsung Electronics
- Texas Instruments
- Ubtech
- AcuRite
- Honeywell
- Lecon
- Seagate Technology
- Midea Group
- Chinavasion
- Luxshare Precision
- OMEGA Engineering
- E+E Elektronik
- Testo
- KIMO
- B&K Precision
- ROTRONIC
- Delta OHM
- Tecpel
Key Developments in Digital Thermo Hygrometers Industry
- 2022 Q4: Honeywell launched a new series of IoT-enabled digital thermo hygrometers.
- 2023 Q1: Samsung Electronics acquired a smaller sensor manufacturer, expanding its product portfolio.
- 2023 Q3: Testo released a new high-accuracy digital thermo hygrometer designed for laboratory use.
- 2024 Q2: A significant merger between two smaller companies created a new major player in the market. (Details are available in the full report).
Strategic Outlook for Digital Thermo Hygrometers Market
The future of the digital thermo hygrometer market looks promising, driven by continued technological advancements, increasing demand from diverse sectors, and the potential for expansion in emerging markets. The integration of IoT, AI, and ML will further enhance the capabilities of these devices, leading to new applications and market opportunities. Strategic partnerships, acquisitions, and product innovations will continue to shape the competitive landscape. The market is poised for sustained growth, with significant potential for increased market penetration across various industries and regions.
Digital Thermo Hygrometers Segmentation
-
1. Application
- 1.1. Petrochemical Industry
- 1.2. Pharmaceutical Industry
- 1.3. Food Industry
- 1.4. Other Industries
-
2. Type
- 2.1. Fixed
- 2.2. Portable
Digital Thermo Hygrometers Segmentation By Geography
-
1. North America
- 1.1. United States
- 1.2. Canada
- 1.3. Mexico
-
2. South America
- 2.1. Brazil
- 2.2. Argentina
- 2.3. Rest of South America
-
3. Europe
- 3.1. United Kingdom
- 3.2. Germany
- 3.3. France
- 3.4. Italy
- 3.5. Spain
- 3.6. Russia
- 3.7. Benelux
- 3.8. Nordics
- 3.9. Rest of Europe
-
4. Middle East & Africa
- 4.1. Turkey
- 4.2. Israel
- 4.3. GCC
- 4.4. North Africa
- 4.5. South Africa
- 4.6. Rest of Middle East & Africa
-
5. Asia Pacific
- 5.1. China
- 5.2. India
- 5.3. Japan
- 5.4. South Korea
- 5.5. ASEAN
- 5.6. Oceania
- 5.7. Rest of Asia Pacific

Digital Thermo Hygrometers REPORT HIGHLIGHTS
| Aspects | Details |
|---|---|
| Study Period | 2019-2033 |
| Base Year | 2024 |
| Estimated Year | 2025 |
| Forecast Period | 2025-2033 |
| Historical Period | 2019-2024 |
| Growth Rate | CAGR of XXX% from 2019-2033 |
| Segmentation |
|
Table of Contents
- 1. Introduction
- 1.1. Research Scope
- 1.2. Market Segmentation
- 1.3. Research Methodology
- 1.4. Definitions and Assumptions
- 2. Executive Summary
- 2.1. Introduction
- 3. Market Dynamics
- 3.1. Introduction
- 3.2. Market Drivers
- 3.3. Market Restrains
- 3.4. Market Trends
- 4. Market Factor Analysis
- 4.1. Porters Five Forces
- 4.2. Supply/Value Chain
- 4.3. PESTEL analysis
- 4.4. Market Entropy
- 4.5. Patent/Trademark Analysis
- 5. Global Digital Thermo Hygrometers Analysis, Insights and Forecast, 2019-2031
- 5.1. Market Analysis, Insights and Forecast - by Application
- 5.1.1. Petrochemical Industry
- 5.1.2. Pharmaceutical Industry
- 5.1.3. Food Industry
- 5.1.4. Other Industries
- 5.2. Market Analysis, Insights and Forecast - by Type
- 5.2.1. Fixed
- 5.2.2. Portable
- 5.3. Market Analysis, Insights and Forecast - by Region
- 5.3.1. North America
- 5.3.2. South America
- 5.3.3. Europe
- 5.3.4. Middle East & Africa
- 5.3.5. Asia Pacific
- 5.1. Market Analysis, Insights and Forecast - by Application
- 6. North America Digital Thermo Hygrometers Analysis, Insights and Forecast, 2019-2031
- 6.1. Market Analysis, Insights and Forecast - by Application
- 6.1.1. Petrochemical Industry
- 6.1.2. Pharmaceutical Industry
- 6.1.3. Food Industry
- 6.1.4. Other Industries
- 6.2. Market Analysis, Insights and Forecast - by Type
- 6.2.1. Fixed
- 6.2.2. Portable
- 6.1. Market Analysis, Insights and Forecast - by Application
- 7. South America Digital Thermo Hygrometers Analysis, Insights and Forecast, 2019-2031
- 7.1. Market Analysis, Insights and Forecast - by Application
- 7.1.1. Petrochemical Industry
- 7.1.2. Pharmaceutical Industry
- 7.1.3. Food Industry
- 7.1.4. Other Industries
- 7.2. Market Analysis, Insights and Forecast - by Type
- 7.2.1. Fixed
- 7.2.2. Portable
- 7.1. Market Analysis, Insights and Forecast - by Application
- 8. Europe Digital Thermo Hygrometers Analysis, Insights and Forecast, 2019-2031
- 8.1. Market Analysis, Insights and Forecast - by Application
- 8.1.1. Petrochemical Industry
- 8.1.2. Pharmaceutical Industry
- 8.1.3. Food Industry
- 8.1.4. Other Industries
- 8.2. Market Analysis, Insights and Forecast - by Type
- 8.2.1. Fixed
- 8.2.2. Portable
- 8.1. Market Analysis, Insights and Forecast - by Application
- 9. Middle East & Africa Digital Thermo Hygrometers Analysis, Insights and Forecast, 2019-2031
- 9.1. Market Analysis, Insights and Forecast - by Application
- 9.1.1. Petrochemical Industry
- 9.1.2. Pharmaceutical Industry
- 9.1.3. Food Industry
- 9.1.4. Other Industries
- 9.2. Market Analysis, Insights and Forecast - by Type
- 9.2.1. Fixed
- 9.2.2. Portable
- 9.1. Market Analysis, Insights and Forecast - by Application
- 10. Asia Pacific Digital Thermo Hygrometers Analysis, Insights and Forecast, 2019-2031
- 10.1. Market Analysis, Insights and Forecast - by Application
- 10.1.1. Petrochemical Industry
- 10.1.2. Pharmaceutical Industry
- 10.1.3. Food Industry
- 10.1.4. Other Industries
- 10.2. Market Analysis, Insights and Forecast - by Type
- 10.2.1. Fixed
- 10.2.2. Portable
- 10.1. Market Analysis, Insights and Forecast - by Application
- 11. Competitive Analysis
- 11.1. Global Market Share Analysis 2024
- 11.2. Company Profiles
- 11.2.1 Samsung Electronics
- 11.2.1.1. Overview
- 11.2.1.2. Products
- 11.2.1.3. SWOT Analysis
- 11.2.1.4. Recent Developments
- 11.2.1.5. Financials (Based on Availability)
- 11.2.2 Texas Instruments
- 11.2.2.1. Overview
- 11.2.2.2. Products
- 11.2.2.3. SWOT Analysis
- 11.2.2.4. Recent Developments
- 11.2.2.5. Financials (Based on Availability)
- 11.2.3 Ubtech
- 11.2.3.1. Overview
- 11.2.3.2. Products
- 11.2.3.3. SWOT Analysis
- 11.2.3.4. Recent Developments
- 11.2.3.5. Financials (Based on Availability)
- 11.2.4 AcuRite
- 11.2.4.1. Overview
- 11.2.4.2. Products
- 11.2.4.3. SWOT Analysis
- 11.2.4.4. Recent Developments
- 11.2.4.5. Financials (Based on Availability)
- 11.2.5 Honeywell
- 11.2.5.1. Overview
- 11.2.5.2. Products
- 11.2.5.3. SWOT Analysis
- 11.2.5.4. Recent Developments
- 11.2.5.5. Financials (Based on Availability)
- 11.2.6 Lecon
- 11.2.6.1. Overview
- 11.2.6.2. Products
- 11.2.6.3. SWOT Analysis
- 11.2.6.4. Recent Developments
- 11.2.6.5. Financials (Based on Availability)
- 11.2.7 Seagate Technology
- 11.2.7.1. Overview
- 11.2.7.2. Products
- 11.2.7.3. SWOT Analysis
- 11.2.7.4. Recent Developments
- 11.2.7.5. Financials (Based on Availability)
- 11.2.8 Midea Group
- 11.2.8.1. Overview
- 11.2.8.2. Products
- 11.2.8.3. SWOT Analysis
- 11.2.8.4. Recent Developments
- 11.2.8.5. Financials (Based on Availability)
- 11.2.9 Chinavasion
- 11.2.9.1. Overview
- 11.2.9.2. Products
- 11.2.9.3. SWOT Analysis
- 11.2.9.4. Recent Developments
- 11.2.9.5. Financials (Based on Availability)
- 11.2.10 Luxshare Precision
- 11.2.10.1. Overview
- 11.2.10.2. Products
- 11.2.10.3. SWOT Analysis
- 11.2.10.4. Recent Developments
- 11.2.10.5. Financials (Based on Availability)
- 11.2.11 OMEGA Engineering
- 11.2.11.1. Overview
- 11.2.11.2. Products
- 11.2.11.3. SWOT Analysis
- 11.2.11.4. Recent Developments
- 11.2.11.5. Financials (Based on Availability)
- 11.2.12 E+E Elektronik
- 11.2.12.1. Overview
- 11.2.12.2. Products
- 11.2.12.3. SWOT Analysis
- 11.2.12.4. Recent Developments
- 11.2.12.5. Financials (Based on Availability)
- 11.2.13 Testo
- 11.2.13.1. Overview
- 11.2.13.2. Products
- 11.2.13.3. SWOT Analysis
- 11.2.13.4. Recent Developments
- 11.2.13.5. Financials (Based on Availability)
- 11.2.14 KIMO
- 11.2.14.1. Overview
- 11.2.14.2. Products
- 11.2.14.3. SWOT Analysis
- 11.2.14.4. Recent Developments
- 11.2.14.5. Financials (Based on Availability)
- 11.2.15 B&K Precision
- 11.2.15.1. Overview
- 11.2.15.2. Products
- 11.2.15.3. SWOT Analysis
- 11.2.15.4. Recent Developments
- 11.2.15.5. Financials (Based on Availability)
- 11.2.16 ROTRONIC
- 11.2.16.1. Overview
- 11.2.16.2. Products
- 11.2.16.3. SWOT Analysis
- 11.2.16.4. Recent Developments
- 11.2.16.5. Financials (Based on Availability)
- 11.2.17 Delta OHM
- 11.2.17.1. Overview
- 11.2.17.2. Products
- 11.2.17.3. SWOT Analysis
- 11.2.17.4. Recent Developments
- 11.2.17.5. Financials (Based on Availability)
- 11.2.18 Tecpel
- 11.2.18.1. Overview
- 11.2.18.2. Products
- 11.2.18.3. SWOT Analysis
- 11.2.18.4. Recent Developments
- 11.2.18.5. Financials (Based on Availability)
- 11.2.1 Samsung Electronics
List of Figures
- Figure 1: Global Digital Thermo Hygrometers Revenue Breakdown (million, %) by Region 2024 & 2032
- Figure 2: North America Digital Thermo Hygrometers Revenue (million), by Application 2024 & 2032
- Figure 3: North America Digital Thermo Hygrometers Revenue Share (%), by Application 2024 & 2032
- Figure 4: North America Digital Thermo Hygrometers Revenue (million), by Type 2024 & 2032
- Figure 5: North America Digital Thermo Hygrometers Revenue Share (%), by Type 2024 & 2032
- Figure 6: North America Digital Thermo Hygrometers Revenue (million), by Country 2024 & 2032
- Figure 7: North America Digital Thermo Hygrometers Revenue Share (%), by Country 2024 & 2032
- Figure 8: South America Digital Thermo Hygrometers Revenue (million), by Application 2024 & 2032
- Figure 9: South America Digital Thermo Hygrometers Revenue Share (%), by Application 2024 & 2032
- Figure 10: South America Digital Thermo Hygrometers Revenue (million), by Type 2024 & 2032
- Figure 11: South America Digital Thermo Hygrometers Revenue Share (%), by Type 2024 & 2032
- Figure 12: South America Digital Thermo Hygrometers Revenue (million), by Country 2024 & 2032
- Figure 13: South America Digital Thermo Hygrometers Revenue Share (%), by Country 2024 & 2032
- Figure 14: Europe Digital Thermo Hygrometers Revenue (million), by Application 2024 & 2032
- Figure 15: Europe Digital Thermo Hygrometers Revenue Share (%), by Application 2024 & 2032
- Figure 16: Europe Digital Thermo Hygrometers Revenue (million), by Type 2024 & 2032
- Figure 17: Europe Digital Thermo Hygrometers Revenue Share (%), by Type 2024 & 2032
- Figure 18: Europe Digital Thermo Hygrometers Revenue (million), by Country 2024 & 2032
- Figure 19: Europe Digital Thermo Hygrometers Revenue Share (%), by Country 2024 & 2032
- Figure 20: Middle East & Africa Digital Thermo Hygrometers Revenue (million), by Application 2024 & 2032
- Figure 21: Middle East & Africa Digital Thermo Hygrometers Revenue Share (%), by Application 2024 & 2032
- Figure 22: Middle East & Africa Digital Thermo Hygrometers Revenue (million), by Type 2024 & 2032
- Figure 23: Middle East & Africa Digital Thermo Hygrometers Revenue Share (%), by Type 2024 & 2032
- Figure 24: Middle East & Africa Digital Thermo Hygrometers Revenue (million), by Country 2024 & 2032
- Figure 25: Middle East & Africa Digital Thermo Hygrometers Revenue Share (%), by Country 2024 & 2032
- Figure 26: Asia Pacific Digital Thermo Hygrometers Revenue (million), by Application 2024 & 2032
- Figure 27: Asia Pacific Digital Thermo Hygrometers Revenue Share (%), by Application 2024 & 2032
- Figure 28: Asia Pacific Digital Thermo Hygrometers Revenue (million), by Type 2024 & 2032
- Figure 29: Asia Pacific Digital Thermo Hygrometers Revenue Share (%), by Type 2024 & 2032
- Figure 30: Asia Pacific Digital Thermo Hygrometers Revenue (million), by Country 2024 & 2032
- Figure 31: Asia Pacific Digital Thermo Hygrometers Revenue Share (%), by Country 2024 & 2032
List of Tables
- Table 1: Global Digital Thermo Hygrometers Revenue million Forecast, by Region 2019 & 2032
- Table 2: Global Digital Thermo Hygrometers Revenue million Forecast, by Application 2019 & 2032
- Table 3: Global Digital Thermo Hygrometers Revenue million Forecast, by Type 2019 & 2032
- Table 4: Global Digital Thermo Hygrometers Revenue million Forecast, by Region 2019 & 2032
- Table 5: Global Digital Thermo Hygrometers Revenue million Forecast, by Application 2019 & 2032
- Table 6: Global Digital Thermo Hygrometers Revenue million Forecast, by Type 2019 & 2032
- Table 7: Global Digital Thermo Hygrometers Revenue million Forecast, by Country 2019 & 2032
- Table 8: United States Digital Thermo Hygrometers Revenue (million) Forecast, by Application 2019 & 2032
- Table 9: Canada Digital Thermo Hygrometers Revenue (million) Forecast, by Application 2019 & 2032
- Table 10: Mexico Digital Thermo Hygrometers Revenue (million) Forecast, by Application 2019 & 2032
- Table 11: Global Digital Thermo Hygrometers Revenue million Forecast, by Application 2019 & 2032
- Table 12: Global Digital Thermo Hygrometers Revenue million Forecast, by Type 2019 & 2032
- Table 13: Global Digital Thermo Hygrometers Revenue million Forecast, by Country 2019 & 2032
- Table 14: Brazil Digital Thermo Hygrometers Revenue (million) Forecast, by Application 2019 & 2032
- Table 15: Argentina Digital Thermo Hygrometers Revenue (million) Forecast, by Application 2019 & 2032
- Table 16: Rest of South America Digital Thermo Hygrometers Revenue (million) Forecast, by Application 2019 & 2032
- Table 17: Global Digital Thermo Hygrometers Revenue million Forecast, by Application 2019 & 2032
- Table 18: Global Digital Thermo Hygrometers Revenue million Forecast, by Type 2019 & 2032
- Table 19: Global Digital Thermo Hygrometers Revenue million Forecast, by Country 2019 & 2032
- Table 20: United Kingdom Digital Thermo Hygrometers Revenue (million) Forecast, by Application 2019 & 2032
- Table 21: Germany Digital Thermo Hygrometers Revenue (million) Forecast, by Application 2019 & 2032
- Table 22: France Digital Thermo Hygrometers Revenue (million) Forecast, by Application 2019 & 2032
- Table 23: Italy Digital Thermo Hygrometers Revenue (million) Forecast, by Application 2019 & 2032
- Table 24: Spain Digital Thermo Hygrometers Revenue (million) Forecast, by Application 2019 & 2032
- Table 25: Russia Digital Thermo Hygrometers Revenue (million) Forecast, by Application 2019 & 2032
- Table 26: Benelux Digital Thermo Hygrometers Revenue (million) Forecast, by Application 2019 & 2032
- Table 27: Nordics Digital Thermo Hygrometers Revenue (million) Forecast, by Application 2019 & 2032
- Table 28: Rest of Europe Digital Thermo Hygrometers Revenue (million) Forecast, by Application 2019 & 2032
- Table 29: Global Digital Thermo Hygrometers Revenue million Forecast, by Application 2019 & 2032
- Table 30: Global Digital Thermo Hygrometers Revenue million Forecast, by Type 2019 & 2032
- Table 31: Global Digital Thermo Hygrometers Revenue million Forecast, by Country 2019 & 2032
- Table 32: Turkey Digital Thermo Hygrometers Revenue (million) Forecast, by Application 2019 & 2032
- Table 33: Israel Digital Thermo Hygrometers Revenue (million) Forecast, by Application 2019 & 2032
- Table 34: GCC Digital Thermo Hygrometers Revenue (million) Forecast, by Application 2019 & 2032
- Table 35: North Africa Digital Thermo Hygrometers Revenue (million) Forecast, by Application 2019 & 2032
- Table 36: South Africa Digital Thermo Hygrometers Revenue (million) Forecast, by Application 2019 & 2032
- Table 37: Rest of Middle East & Africa Digital Thermo Hygrometers Revenue (million) Forecast, by Application 2019 & 2032
- Table 38: Global Digital Thermo Hygrometers Revenue million Forecast, by Application 2019 & 2032
- Table 39: Global Digital Thermo Hygrometers Revenue million Forecast, by Type 2019 & 2032
- Table 40: Global Digital Thermo Hygrometers Revenue million Forecast, by Country 2019 & 2032
- Table 41: China Digital Thermo Hygrometers Revenue (million) Forecast, by Application 2019 & 2032
- Table 42: India Digital Thermo Hygrometers Revenue (million) Forecast, by Application 2019 & 2032
- Table 43: Japan Digital Thermo Hygrometers Revenue (million) Forecast, by Application 2019 & 2032
- Table 44: South Korea Digital Thermo Hygrometers Revenue (million) Forecast, by Application 2019 & 2032
- Table 45: ASEAN Digital Thermo Hygrometers Revenue (million) Forecast, by Application 2019 & 2032
- Table 46: Oceania Digital Thermo Hygrometers Revenue (million) Forecast, by Application 2019 & 2032
- Table 47: Rest of Asia Pacific Digital Thermo Hygrometers Revenue (million) Forecast, by Application 2019 & 2032
Frequently Asked Questions
1. What is the projected Compound Annual Growth Rate (CAGR) of the Digital Thermo Hygrometers?
The projected CAGR is approximately XXX%.
2. Which companies are prominent players in the Digital Thermo Hygrometers?
Key companies in the market include Samsung Electronics, Texas Instruments, Ubtech, AcuRite, Honeywell, Lecon, Seagate Technology, Midea Group, Chinavasion, Luxshare Precision, OMEGA Engineering, E+E Elektronik, Testo, KIMO, B&K Precision, ROTRONIC, Delta OHM, Tecpel.
3. What are the main segments of the Digital Thermo Hygrometers?
The market segments include Application, Type.
4. Can you provide details about the market size?
The market size is estimated to be USD XXX million as of 2022.
5. What are some drivers contributing to market growth?
N/A
6. What are the notable trends driving market growth?
N/A
7. Are there any restraints impacting market growth?
N/A
8. Can you provide examples of recent developments in the market?
N/A
9. What pricing options are available for accessing the report?
Pricing options include single-user, multi-user, and enterprise licenses priced at USD 4250.00, USD 6375.00, and USD 8500.00 respectively.
10. Is the market size provided in terms of value or volume?
The market size is provided in terms of value, measured in million.
11. Are there any specific market keywords associated with the report?
Yes, the market keyword associated with the report is "Digital Thermo Hygrometers," which aids in identifying and referencing the specific market segment covered.
12. How do I determine which pricing option suits my needs best?
The pricing options vary based on user requirements and access needs. Individual users may opt for single-user licenses, while businesses requiring broader access may choose multi-user or enterprise licenses for cost-effective access to the report.
13. Are there any additional resources or data provided in the Digital Thermo Hygrometers report?
While the report offers comprehensive insights, it's advisable to review the specific contents or supplementary materials provided to ascertain if additional resources or data are available.
14. How can I stay updated on further developments or reports in the Digital Thermo Hygrometers?
To stay informed about further developments, trends, and reports in the Digital Thermo Hygrometers, consider subscribing to industry newsletters, following relevant companies and organizations, or regularly checking reputable industry news sources and publications.
Methodology
Step 1 - Identification of Relevant Samples Size from Population Database


Step 2 - Approaches for Defining Global Market Size (Value, Volume* & Price*)

Note*: In applicable scenarios
Step 3 - Data Sources
Primary Research
- Web Analytics
- Survey Reports
- Research Institute
- Latest Research Reports
- Opinion Leaders
Secondary Research
- Annual Reports
- White Paper
- Latest Press Release
- Industry Association
- Paid Database
- Investor Presentations

Step 4 - Data Triangulation
Involves using different sources of information in order to increase the validity of a study
These sources are likely to be stakeholders in a program - participants, other researchers, program staff, other community members, and so on.
Then we put all data in single framework & apply various statistical tools to find out the dynamic on the market.
During the analysis stage, feedback from the stakeholder groups would be compared to determine areas of agreement as well as areas of divergence


