
Key Insights
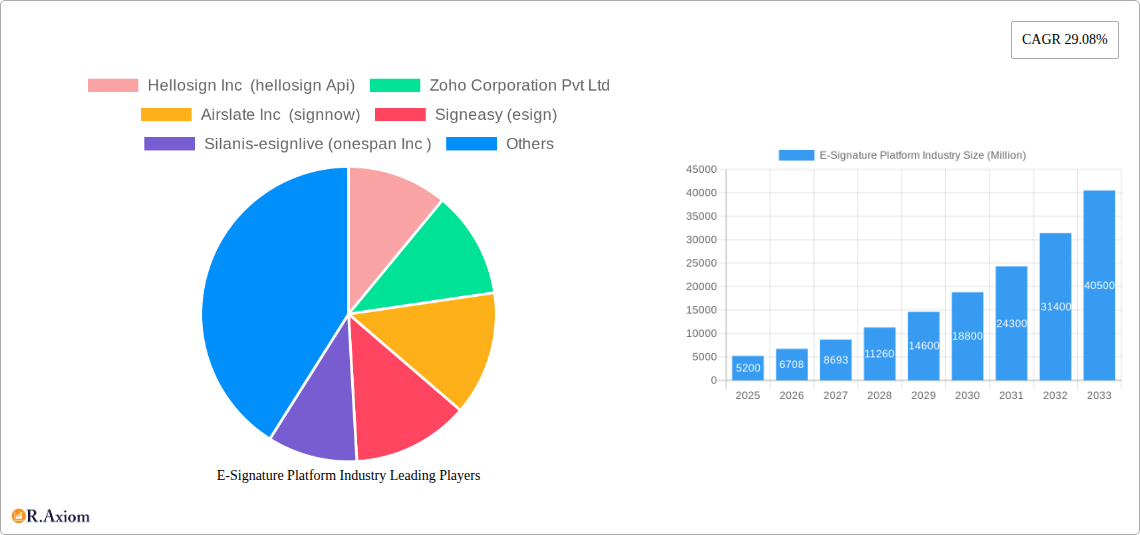
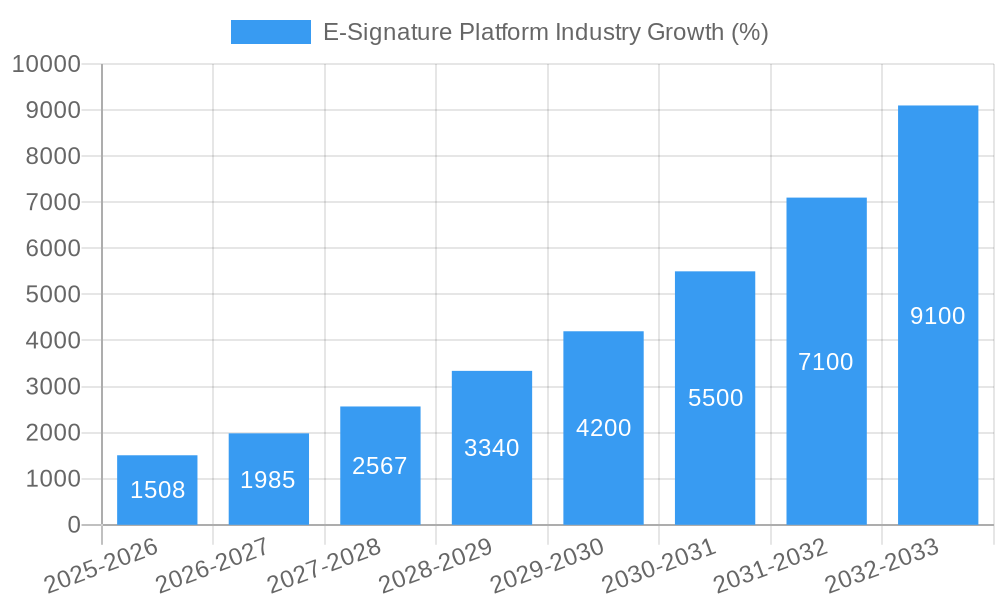
The e-signature platform market is experiencing robust growth, projected to reach $5.20 billion in 2025 and exhibiting a Compound Annual Growth Rate (CAGR) of 29.08%. This expansion is fueled by several key drivers. The increasing adoption of digital transformation initiatives across various sectors, including BFSI, healthcare, and government, is a primary catalyst. Businesses are increasingly recognizing the efficiency gains, cost reductions, and enhanced security offered by e-signature solutions compared to traditional paper-based processes. Furthermore, stringent regulatory compliance requirements and the rising need for secure document management are further bolstering market growth. The shift towards remote work models, accelerated by recent global events, has also significantly increased demand for secure and reliable digital signature solutions. The market is segmented by deployment (on-premise and cloud), organization size (small and medium enterprises and large enterprises), and end-user industry. The cloud deployment model dominates the market due to its scalability, accessibility, and cost-effectiveness. Large enterprises are the major consumers, driven by their need for comprehensive document management and workflow automation capabilities. North America currently holds a significant market share, but the Asia-Pacific region is poised for substantial growth due to increasing digitalization and economic expansion.
Competition in the e-signature platform market is intense, with established players like DocuSign and Adobe competing with emerging innovative solutions. The market's competitive landscape is characterized by ongoing innovation, strategic partnerships, and acquisitions. Vendors are focusing on enhancing their platform capabilities by integrating advanced features such as AI-powered document automation, advanced security protocols, and seamless integration with other business applications. Future growth will depend on factors such as the continuous improvement of e-signature technology, wider regulatory acceptance across different jurisdictions, and the sustained adoption of digital workflows across diverse industries. While challenges like security concerns and the need for user adoption remain, the overall market trajectory suggests a strong and sustained expansion in the coming years.
E-Signature Platform Industry: A Comprehensive Market Report (2019-2033)
This comprehensive report provides an in-depth analysis of the E-Signature Platform industry, covering market size, growth drivers, key players, and future trends. The study period spans from 2019 to 2033, with 2025 serving as the base and estimated year. The forecast period is 2025-2033, and the historical period encompasses 2019-2024. The report offers actionable insights for industry stakeholders, investors, and businesses seeking to navigate this rapidly evolving market. The total market size is estimated to reach xx Million by 2033.
E-Signature Platform Industry Market Concentration & Innovation
The e-signature platform market exhibits a moderately concentrated landscape, with a few dominant players holding significant market share. DocuSign Inc. and Adobe Inc. are currently leading the pack, capturing approximately xx Million and xx Million in revenue respectively in 2024, accounting for a combined market share of approximately xx%. Other key players, including Hellosign Inc. (Hellosign), Zoho Corporation Pvt Ltd (Zoho), Airslate Inc. (SignNow), Signeasy (Signeasy), Silanis-esignlive (OneSpan Inc.) (OneSpan), Yousign, Rightsignature (Citrix Systems), and PandaDoc Inc. (PandaDoc), contribute to the remaining market share. Innovation within the sector is driven by several factors:
- Technological advancements: Integration with other business applications, improved security features (like biometric authentication and blockchain technology), and AI-powered functionalities are key innovation drivers.
- Regulatory frameworks: Evolving regulations surrounding digital signatures and e-transactions influence product development and market adoption. Compliance with standards like ESIGN and UETA is crucial.
- Product substitutes: While e-signature platforms are increasingly preferred, traditional paper-based signatures remain a substitute, particularly in sectors with stringent regulatory compliance needs.
- End-user trends: The increasing demand for digital transformation and remote working fuels the adoption of e-signature solutions across various industries.
- M&A activities: Recent mergers and acquisitions, such as PandaDoc's acquisition of LiveNotary, indicate consolidation and expansion within the market, demonstrating an estimated M&A deal value of xx Million in 2024.
E-Signature Platform Industry Industry Trends & Insights
The e-signature platform market exhibits robust growth, driven by several key factors. The global market is projected to witness a Compound Annual Growth Rate (CAGR) of xx% during the forecast period (2025-2033), reaching an estimated value of xx Million by 2033. Market penetration continues to rise across all segments, fuelled by rising digital adoption, especially in sectors like BFSI and healthcare where secure and efficient document management is critical. Technological disruptions, such as the increasing use of blockchain for enhanced security and the integration of AI for automation, are significantly impacting market dynamics. Consumer preferences are shifting towards user-friendly, feature-rich, and highly secure solutions. The competitive landscape is marked by both intense competition among established players and the emergence of innovative start-ups offering niche solutions. The increasing focus on regulatory compliance and data security is also shaping market dynamics, as businesses prioritize solutions that meet the highest standards.
Dominant Markets & Segments in E-Signature Platform Industry
The cloud-based deployment model dominates the e-signature platform market, driven by its scalability, accessibility, and cost-effectiveness. Large enterprises represent a significant market segment, with higher adoption rates due to their greater need for streamlined document workflows and automation. The BFSI (Banking, Financial Services, and Insurance) sector is currently the leading end-user industry, owing to the high volume of legally binding documents handled.
Key Drivers for Dominance:
- Cloud Deployment: Scalability, cost-effectiveness, accessibility, and ease of integration with other cloud-based systems.
- Large Enterprises: Higher need for automation, improved document workflows, and enhanced security features.
- BFSI Sector: High volume of legally binding transactions and documents, stringent regulatory compliance requirements.
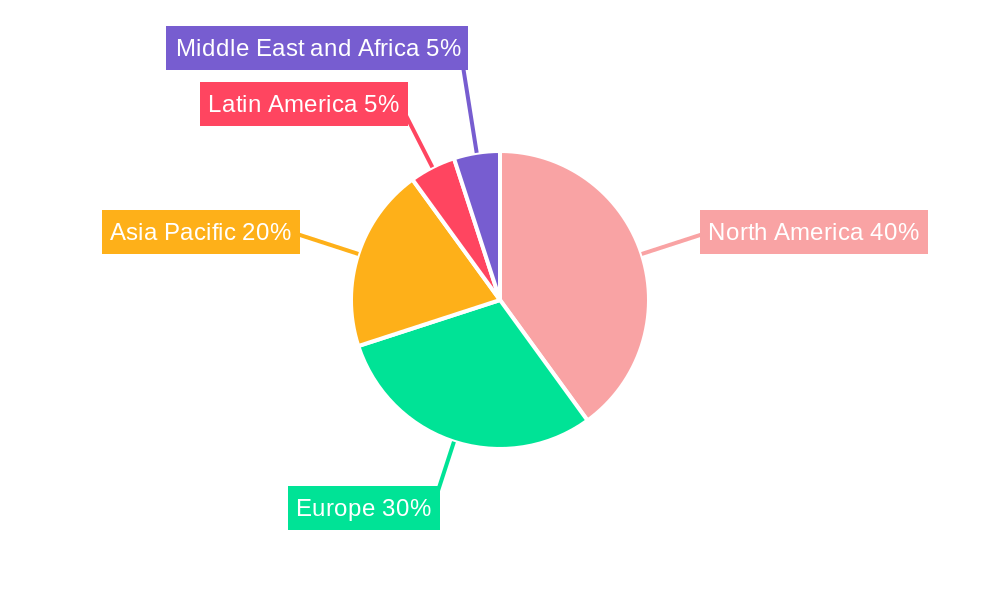
Geographic Dominance: North America currently holds the largest market share, followed by Europe and Asia-Pacific. This dominance is attributed to factors such as:
- North America: High levels of technological adoption, strong regulatory support, and a mature market for digital solutions.
- Europe: Growing regulatory compliance requirements and the increasing adoption of digital technologies across industries.
- Asia-Pacific: Rapid economic growth, increasing internet penetration, and a growing preference for digital solutions.
E-Signature Platform Industry Product Developments
Recent product developments in the e-signature platform industry focus on enhancing security, user experience, and integration capabilities. This includes the integration of advanced security protocols like biometric authentication and blockchain technology, AI-powered automation features for improved workflow efficiency, and seamless integration with various business applications (CRM, ERP, etc.). The key competitive advantage lies in offering a secure, user-friendly, and feature-rich platform that seamlessly integrates into existing workflows, accommodating diverse user needs and regulatory compliance standards.
Report Scope & Segmentation Analysis
This report segments the e-signature platform market based on deployment (on-premise, cloud), organization size (SME, large enterprise), and end-user industry (BFSI, government & defense, healthcare, oil & gas, IT & telecom, logistics & transportation, other). Each segment's growth trajectory, market size, and competitive landscape are analyzed in detail. For example, the cloud segment is projected to witness faster growth than on-premise deployment due to its inherent advantages in scalability and accessibility. Similarly, the BFSI sector is expected to dominate end-user segments due to the high volume of transactions and legal requirements. The large enterprise segment holds considerable market share given their technology adoption rates and need for sophisticated solutions.
Key Drivers of E-Signature Platform Industry Growth
Several factors drive the growth of the e-signature platform industry. These include increasing digitalization across industries, rising demand for remote working solutions, stringent regulatory compliance requirements, and the need for efficient document workflows. The increasing adoption of cloud-based solutions and the integration of advanced technologies like AI and blockchain further accelerate growth. Government initiatives promoting digital transformation also contribute positively to market expansion.
Challenges in the E-Signature Platform Industry Sector
The e-signature platform market faces challenges such as ensuring robust security and data privacy, maintaining regulatory compliance across diverse jurisdictions, and addressing concerns around the legal validity of e-signatures in certain industries. Competition amongst established players and the emergence of new entrants also put pressure on pricing and margins. Supply chain disruptions and skills shortages in specialized areas can also hinder growth. These factors cumulatively exert a xx Million impact on market growth in 2024.
Emerging Opportunities in E-Signature Platform Industry
Emerging opportunities lie in the expansion into new markets (particularly in developing economies), the integration of advanced technologies like biometric authentication and blockchain for enhanced security, and the development of specialized e-signature solutions for specific industries with unique regulatory requirements. The increasing adoption of IoT devices and the rise of the metaverse present potential avenues for future market expansion.
Leading Players in the E-Signature Platform Industry Market
- Hellosign Inc (Hellosign)
- Zoho Corporation Pvt Ltd (Zoho)
- Airslate Inc (SignNow)
- Signeasy (Signeasy)
- Silanis-esignlive (OneSpan Inc.) (OneSpan)
- Adobe Inc (Adobe)
- Yousign
- Docusign Inc (Docusign)
- Rightsignature (Citrix Systems)
- Pandadoc Inc (PandaDoc)
Key Developments in E-Signature Platform Industry Industry
- March 2022: PandaDoc announced the acquisition of LiveNotary, expanding its digital document management solutions for SMBs.
- March 2022: PandaDoc partnered with QuickBooks, integrating its platform with Intuit's financial management platform.
- August 2022: ZorroSign upgraded its user experience and interface, enhancing security and compliance for its UAE subscribers.
- September 2022: The National Institute of Standards and Technology (NIST) sought additional digital signature proposals for Post-Quantum Cryptography (PQC) standardization.
Strategic Outlook for E-Signature Platform Industry Market
The future of the e-signature platform market looks bright, driven by sustained growth in digitalization, increasing demand for remote work solutions, and the ongoing need for efficient and secure document management across various industries. The integration of emerging technologies like AI, blockchain, and IoT will further drive innovation and market expansion. The continued focus on regulatory compliance and data security will shape the competitive landscape and propel the adoption of advanced e-signature solutions. The market is poised for significant growth over the next decade, with opportunities for both established players and new entrants to capitalize on the increasing demand for secure and efficient digital document management.
E-Signature Platform Industry Segmentation
-
1. Deployment
- 1.1. On-premise
- 1.2. Cloud
-
2. Organization Size
- 2.1. Small and Medium Enterprise
- 2.2. Large Enterprise
-
3. End-User Industry
- 3.1. BFSI
- 3.2. Government and Defense
- 3.3. Healthcare
- 3.4. Oil and Gas
- 3.5. IT and Telecom
- 3.6. Logistics and Transportation
- 3.7. Other End-user Industries
E-Signature Platform Industry Segmentation By Geography
-
1. North America
- 1.1. United States
- 1.2. Canada
-
2. Europe
- 2.1. United Kingdom
- 2.2. Germany
- 2.3. France
- 2.4. Italy
-
3. Asia
- 3.1. China
- 3.2. Japan
- 3.3. South Korea
- 4. Australia and New Zealand
- 5. Latin America
- 6. Middle East and Africa
E-Signature Platform Industry REPORT HIGHLIGHTS
| Aspects | Details |
|---|---|
| Study Period | 2019-2033 |
| Base Year | 2024 |
| Estimated Year | 2025 |
| Forecast Period | 2025-2033 |
| Historical Period | 2019-2024 |
| Growth Rate | CAGR of 29.08% from 2019-2033 |
| Segmentation |
|
Table of Contents
- 1. Introduction
- 1.1. Research Scope
- 1.2. Market Segmentation
- 1.3. Research Methodology
- 1.4. Definitions and Assumptions
- 2. Executive Summary
- 2.1. Introduction
- 3. Market Dynamics
- 3.1. Introduction
- 3.2. Market Drivers
- 3.2.1. Rise In E-signatures And Adoption Of Cloud-based Services; Increase In Remote Work Culture And Overseas Contracts
- 3.3. Market Restrains
- 3.3.1. Increasing Vulnerability Related To Cyber-attacks and Frauds
- 3.4. Market Trends
- 3.4.1. Government and Defense to hold significant share
- 4. Market Factor Analysis
- 4.1. Porters Five Forces
- 4.2. Supply/Value Chain
- 4.3. PESTEL analysis
- 4.4. Market Entropy
- 4.5. Patent/Trademark Analysis
- 5. Global E-Signature Platform Industry Analysis, Insights and Forecast, 2019-2031
- 5.1. Market Analysis, Insights and Forecast - by Deployment
- 5.1.1. On-premise
- 5.1.2. Cloud
- 5.2. Market Analysis, Insights and Forecast - by Organization Size
- 5.2.1. Small and Medium Enterprise
- 5.2.2. Large Enterprise
- 5.3. Market Analysis, Insights and Forecast - by End-User Industry
- 5.3.1. BFSI
- 5.3.2. Government and Defense
- 5.3.3. Healthcare
- 5.3.4. Oil and Gas
- 5.3.5. IT and Telecom
- 5.3.6. Logistics and Transportation
- 5.3.7. Other End-user Industries
- 5.4. Market Analysis, Insights and Forecast - by Region
- 5.4.1. North America
- 5.4.2. Europe
- 5.4.3. Asia
- 5.4.4. Australia and New Zealand
- 5.4.5. Latin America
- 5.4.6. Middle East and Africa
- 5.1. Market Analysis, Insights and Forecast - by Deployment
- 6. North America E-Signature Platform Industry Analysis, Insights and Forecast, 2019-2031
- 6.1. Market Analysis, Insights and Forecast - by Deployment
- 6.1.1. On-premise
- 6.1.2. Cloud
- 6.2. Market Analysis, Insights and Forecast - by Organization Size
- 6.2.1. Small and Medium Enterprise
- 6.2.2. Large Enterprise
- 6.3. Market Analysis, Insights and Forecast - by End-User Industry
- 6.3.1. BFSI
- 6.3.2. Government and Defense
- 6.3.3. Healthcare
- 6.3.4. Oil and Gas
- 6.3.5. IT and Telecom
- 6.3.6. Logistics and Transportation
- 6.3.7. Other End-user Industries
- 6.1. Market Analysis, Insights and Forecast - by Deployment
- 7. Europe E-Signature Platform Industry Analysis, Insights and Forecast, 2019-2031
- 7.1. Market Analysis, Insights and Forecast - by Deployment
- 7.1.1. On-premise
- 7.1.2. Cloud
- 7.2. Market Analysis, Insights and Forecast - by Organization Size
- 7.2.1. Small and Medium Enterprise
- 7.2.2. Large Enterprise
- 7.3. Market Analysis, Insights and Forecast - by End-User Industry
- 7.3.1. BFSI
- 7.3.2. Government and Defense
- 7.3.3. Healthcare
- 7.3.4. Oil and Gas
- 7.3.5. IT and Telecom
- 7.3.6. Logistics and Transportation
- 7.3.7. Other End-user Industries
- 7.1. Market Analysis, Insights and Forecast - by Deployment
- 8. Asia E-Signature Platform Industry Analysis, Insights and Forecast, 2019-2031
- 8.1. Market Analysis, Insights and Forecast - by Deployment
- 8.1.1. On-premise
- 8.1.2. Cloud
- 8.2. Market Analysis, Insights and Forecast - by Organization Size
- 8.2.1. Small and Medium Enterprise
- 8.2.2. Large Enterprise
- 8.3. Market Analysis, Insights and Forecast - by End-User Industry
- 8.3.1. BFSI
- 8.3.2. Government and Defense
- 8.3.3. Healthcare
- 8.3.4. Oil and Gas
- 8.3.5. IT and Telecom
- 8.3.6. Logistics and Transportation
- 8.3.7. Other End-user Industries
- 8.1. Market Analysis, Insights and Forecast - by Deployment
- 9. Australia and New Zealand E-Signature Platform Industry Analysis, Insights and Forecast, 2019-2031
- 9.1. Market Analysis, Insights and Forecast - by Deployment
- 9.1.1. On-premise
- 9.1.2. Cloud
- 9.2. Market Analysis, Insights and Forecast - by Organization Size
- 9.2.1. Small and Medium Enterprise
- 9.2.2. Large Enterprise
- 9.3. Market Analysis, Insights and Forecast - by End-User Industry
- 9.3.1. BFSI
- 9.3.2. Government and Defense
- 9.3.3. Healthcare
- 9.3.4. Oil and Gas
- 9.3.5. IT and Telecom
- 9.3.6. Logistics and Transportation
- 9.3.7. Other End-user Industries
- 9.1. Market Analysis, Insights and Forecast - by Deployment
- 10. Latin America E-Signature Platform Industry Analysis, Insights and Forecast, 2019-2031
- 10.1. Market Analysis, Insights and Forecast - by Deployment
- 10.1.1. On-premise
- 10.1.2. Cloud
- 10.2. Market Analysis, Insights and Forecast - by Organization Size
- 10.2.1. Small and Medium Enterprise
- 10.2.2. Large Enterprise
- 10.3. Market Analysis, Insights and Forecast - by End-User Industry
- 10.3.1. BFSI
- 10.3.2. Government and Defense
- 10.3.3. Healthcare
- 10.3.4. Oil and Gas
- 10.3.5. IT and Telecom
- 10.3.6. Logistics and Transportation
- 10.3.7. Other End-user Industries
- 10.1. Market Analysis, Insights and Forecast - by Deployment
- 11. Middle East and Africa E-Signature Platform Industry Analysis, Insights and Forecast, 2019-2031
- 11.1. Market Analysis, Insights and Forecast - by Deployment
- 11.1.1. On-premise
- 11.1.2. Cloud
- 11.2. Market Analysis, Insights and Forecast - by Organization Size
- 11.2.1. Small and Medium Enterprise
- 11.2.2. Large Enterprise
- 11.3. Market Analysis, Insights and Forecast - by End-User Industry
- 11.3.1. BFSI
- 11.3.2. Government and Defense
- 11.3.3. Healthcare
- 11.3.4. Oil and Gas
- 11.3.5. IT and Telecom
- 11.3.6. Logistics and Transportation
- 11.3.7. Other End-user Industries
- 11.1. Market Analysis, Insights and Forecast - by Deployment
- 12. North America E-Signature Platform Industry Analysis, Insights and Forecast, 2019-2031
- 12.1. Market Analysis, Insights and Forecast - By Country/Sub-region
- 12.1.1 United States
- 12.1.2 Canada
- 13. Europe E-Signature Platform Industry Analysis, Insights and Forecast, 2019-2031
- 13.1. Market Analysis, Insights and Forecast - By Country/Sub-region
- 13.1.1 United Kingdom
- 13.1.2 Germany
- 13.1.3 France
- 13.1.4 Italy
- 13.1.5 Rest of Europe
- 14. Asia Pacific E-Signature Platform Industry Analysis, Insights and Forecast, 2019-2031
- 14.1. Market Analysis, Insights and Forecast - By Country/Sub-region
- 14.1.1 China
- 14.1.2 Japan
- 14.1.3 South Korea
- 14.1.4 Rest of Asia Pacific
- 15. Latin America E-Signature Platform Industry Analysis, Insights and Forecast, 2019-2031
- 15.1. Market Analysis, Insights and Forecast - By Country/Sub-region
- 15.1.1.
- 16. Middle East and Africa E-Signature Platform Industry Analysis, Insights and Forecast, 2019-2031
- 16.1. Market Analysis, Insights and Forecast - By Country/Sub-region
- 16.1.1.
- 17. Competitive Analysis
- 17.1. Global Market Share Analysis 2024
- 17.2. Company Profiles
- 17.2.1 Hellosign Inc (hellosign Api)
- 17.2.1.1. Overview
- 17.2.1.2. Products
- 17.2.1.3. SWOT Analysis
- 17.2.1.4. Recent Developments
- 17.2.1.5. Financials (Based on Availability)
- 17.2.2 Zoho Corporation Pvt Ltd
- 17.2.2.1. Overview
- 17.2.2.2. Products
- 17.2.2.3. SWOT Analysis
- 17.2.2.4. Recent Developments
- 17.2.2.5. Financials (Based on Availability)
- 17.2.3 Airslate Inc (signnow)
- 17.2.3.1. Overview
- 17.2.3.2. Products
- 17.2.3.3. SWOT Analysis
- 17.2.3.4. Recent Developments
- 17.2.3.5. Financials (Based on Availability)
- 17.2.4 Signeasy (esign)
- 17.2.4.1. Overview
- 17.2.4.2. Products
- 17.2.4.3. SWOT Analysis
- 17.2.4.4. Recent Developments
- 17.2.4.5. Financials (Based on Availability)
- 17.2.5 Silanis-esignlive (onespan Inc )
- 17.2.5.1. Overview
- 17.2.5.2. Products
- 17.2.5.3. SWOT Analysis
- 17.2.5.4. Recent Developments
- 17.2.5.5. Financials (Based on Availability)
- 17.2.6 Adobe Inc
- 17.2.6.1. Overview
- 17.2.6.2. Products
- 17.2.6.3. SWOT Analysis
- 17.2.6.4. Recent Developments
- 17.2.6.5. Financials (Based on Availability)
- 17.2.7 Yousign
- 17.2.7.1. Overview
- 17.2.7.2. Products
- 17.2.7.3. SWOT Analysis
- 17.2.7.4. Recent Developments
- 17.2.7.5. Financials (Based on Availability)
- 17.2.8 Docusign Inc
- 17.2.8.1. Overview
- 17.2.8.2. Products
- 17.2.8.3. SWOT Analysis
- 17.2.8.4. Recent Developments
- 17.2.8.5. Financials (Based on Availability)
- 17.2.9 Rightsignature (citrix Systems)
- 17.2.9.1. Overview
- 17.2.9.2. Products
- 17.2.9.3. SWOT Analysis
- 17.2.9.4. Recent Developments
- 17.2.9.5. Financials (Based on Availability)
- 17.2.10 Pandadoc Inc
- 17.2.10.1. Overview
- 17.2.10.2. Products
- 17.2.10.3. SWOT Analysis
- 17.2.10.4. Recent Developments
- 17.2.10.5. Financials (Based on Availability)
- 17.2.1 Hellosign Inc (hellosign Api)
List of Figures
- Figure 1: Global E-Signature Platform Industry Revenue Breakdown (Million, %) by Region 2024 & 2032
- Figure 2: North America E-Signature Platform Industry Revenue (Million), by Country 2024 & 2032
- Figure 3: North America E-Signature Platform Industry Revenue Share (%), by Country 2024 & 2032
- Figure 4: Europe E-Signature Platform Industry Revenue (Million), by Country 2024 & 2032
- Figure 5: Europe E-Signature Platform Industry Revenue Share (%), by Country 2024 & 2032
- Figure 6: Asia Pacific E-Signature Platform Industry Revenue (Million), by Country 2024 & 2032
- Figure 7: Asia Pacific E-Signature Platform Industry Revenue Share (%), by Country 2024 & 2032
- Figure 8: Latin America E-Signature Platform Industry Revenue (Million), by Country 2024 & 2032
- Figure 9: Latin America E-Signature Platform Industry Revenue Share (%), by Country 2024 & 2032
- Figure 10: Middle East and Africa E-Signature Platform Industry Revenue (Million), by Country 2024 & 2032
- Figure 11: Middle East and Africa E-Signature Platform Industry Revenue Share (%), by Country 2024 & 2032
- Figure 12: North America E-Signature Platform Industry Revenue (Million), by Deployment 2024 & 2032
- Figure 13: North America E-Signature Platform Industry Revenue Share (%), by Deployment 2024 & 2032
- Figure 14: North America E-Signature Platform Industry Revenue (Million), by Organization Size 2024 & 2032
- Figure 15: North America E-Signature Platform Industry Revenue Share (%), by Organization Size 2024 & 2032
- Figure 16: North America E-Signature Platform Industry Revenue (Million), by End-User Industry 2024 & 2032
- Figure 17: North America E-Signature Platform Industry Revenue Share (%), by End-User Industry 2024 & 2032
- Figure 18: North America E-Signature Platform Industry Revenue (Million), by Country 2024 & 2032
- Figure 19: North America E-Signature Platform Industry Revenue Share (%), by Country 2024 & 2032
- Figure 20: Europe E-Signature Platform Industry Revenue (Million), by Deployment 2024 & 2032
- Figure 21: Europe E-Signature Platform Industry Revenue Share (%), by Deployment 2024 & 2032
- Figure 22: Europe E-Signature Platform Industry Revenue (Million), by Organization Size 2024 & 2032
- Figure 23: Europe E-Signature Platform Industry Revenue Share (%), by Organization Size 2024 & 2032
- Figure 24: Europe E-Signature Platform Industry Revenue (Million), by End-User Industry 2024 & 2032
- Figure 25: Europe E-Signature Platform Industry Revenue Share (%), by End-User Industry 2024 & 2032
- Figure 26: Europe E-Signature Platform Industry Revenue (Million), by Country 2024 & 2032
- Figure 27: Europe E-Signature Platform Industry Revenue Share (%), by Country 2024 & 2032
- Figure 28: Asia E-Signature Platform Industry Revenue (Million), by Deployment 2024 & 2032
- Figure 29: Asia E-Signature Platform Industry Revenue Share (%), by Deployment 2024 & 2032
- Figure 30: Asia E-Signature Platform Industry Revenue (Million), by Organization Size 2024 & 2032
- Figure 31: Asia E-Signature Platform Industry Revenue Share (%), by Organization Size 2024 & 2032
- Figure 32: Asia E-Signature Platform Industry Revenue (Million), by End-User Industry 2024 & 2032
- Figure 33: Asia E-Signature Platform Industry Revenue Share (%), by End-User Industry 2024 & 2032
- Figure 34: Asia E-Signature Platform Industry Revenue (Million), by Country 2024 & 2032
- Figure 35: Asia E-Signature Platform Industry Revenue Share (%), by Country 2024 & 2032
- Figure 36: Australia and New Zealand E-Signature Platform Industry Revenue (Million), by Deployment 2024 & 2032
- Figure 37: Australia and New Zealand E-Signature Platform Industry Revenue Share (%), by Deployment 2024 & 2032
- Figure 38: Australia and New Zealand E-Signature Platform Industry Revenue (Million), by Organization Size 2024 & 2032
- Figure 39: Australia and New Zealand E-Signature Platform Industry Revenue Share (%), by Organization Size 2024 & 2032
- Figure 40: Australia and New Zealand E-Signature Platform Industry Revenue (Million), by End-User Industry 2024 & 2032
- Figure 41: Australia and New Zealand E-Signature Platform Industry Revenue Share (%), by End-User Industry 2024 & 2032
- Figure 42: Australia and New Zealand E-Signature Platform Industry Revenue (Million), by Country 2024 & 2032
- Figure 43: Australia and New Zealand E-Signature Platform Industry Revenue Share (%), by Country 2024 & 2032
- Figure 44: Latin America E-Signature Platform Industry Revenue (Million), by Deployment 2024 & 2032
- Figure 45: Latin America E-Signature Platform Industry Revenue Share (%), by Deployment 2024 & 2032
- Figure 46: Latin America E-Signature Platform Industry Revenue (Million), by Organization Size 2024 & 2032
- Figure 47: Latin America E-Signature Platform Industry Revenue Share (%), by Organization Size 2024 & 2032
- Figure 48: Latin America E-Signature Platform Industry Revenue (Million), by End-User Industry 2024 & 2032
- Figure 49: Latin America E-Signature Platform Industry Revenue Share (%), by End-User Industry 2024 & 2032
- Figure 50: Latin America E-Signature Platform Industry Revenue (Million), by Country 2024 & 2032
- Figure 51: Latin America E-Signature Platform Industry Revenue Share (%), by Country 2024 & 2032
- Figure 52: Middle East and Africa E-Signature Platform Industry Revenue (Million), by Deployment 2024 & 2032
- Figure 53: Middle East and Africa E-Signature Platform Industry Revenue Share (%), by Deployment 2024 & 2032
- Figure 54: Middle East and Africa E-Signature Platform Industry Revenue (Million), by Organization Size 2024 & 2032
- Figure 55: Middle East and Africa E-Signature Platform Industry Revenue Share (%), by Organization Size 2024 & 2032
- Figure 56: Middle East and Africa E-Signature Platform Industry Revenue (Million), by End-User Industry 2024 & 2032
- Figure 57: Middle East and Africa E-Signature Platform Industry Revenue Share (%), by End-User Industry 2024 & 2032
- Figure 58: Middle East and Africa E-Signature Platform Industry Revenue (Million), by Country 2024 & 2032
- Figure 59: Middle East and Africa E-Signature Platform Industry Revenue Share (%), by Country 2024 & 2032
List of Tables
- Table 1: Global E-Signature Platform Industry Revenue Million Forecast, by Region 2019 & 2032
- Table 2: Global E-Signature Platform Industry Revenue Million Forecast, by Deployment 2019 & 2032
- Table 3: Global E-Signature Platform Industry Revenue Million Forecast, by Organization Size 2019 & 2032
- Table 4: Global E-Signature Platform Industry Revenue Million Forecast, by End-User Industry 2019 & 2032
- Table 5: Global E-Signature Platform Industry Revenue Million Forecast, by Region 2019 & 2032
- Table 6: Global E-Signature Platform Industry Revenue Million Forecast, by Country 2019 & 2032
- Table 7: United States E-Signature Platform Industry Revenue (Million) Forecast, by Application 2019 & 2032
- Table 8: Canada E-Signature Platform Industry Revenue (Million) Forecast, by Application 2019 & 2032
- Table 9: Global E-Signature Platform Industry Revenue Million Forecast, by Country 2019 & 2032
- Table 10: United Kingdom E-Signature Platform Industry Revenue (Million) Forecast, by Application 2019 & 2032
- Table 11: Germany E-Signature Platform Industry Revenue (Million) Forecast, by Application 2019 & 2032
- Table 12: France E-Signature Platform Industry Revenue (Million) Forecast, by Application 2019 & 2032
- Table 13: Italy E-Signature Platform Industry Revenue (Million) Forecast, by Application 2019 & 2032
- Table 14: Rest of Europe E-Signature Platform Industry Revenue (Million) Forecast, by Application 2019 & 2032
- Table 15: Global E-Signature Platform Industry Revenue Million Forecast, by Country 2019 & 2032
- Table 16: China E-Signature Platform Industry Revenue (Million) Forecast, by Application 2019 & 2032
- Table 17: Japan E-Signature Platform Industry Revenue (Million) Forecast, by Application 2019 & 2032
- Table 18: South Korea E-Signature Platform Industry Revenue (Million) Forecast, by Application 2019 & 2032
- Table 19: Rest of Asia Pacific E-Signature Platform Industry Revenue (Million) Forecast, by Application 2019 & 2032
- Table 20: Global E-Signature Platform Industry Revenue Million Forecast, by Country 2019 & 2032
- Table 21: E-Signature Platform Industry Revenue (Million) Forecast, by Application 2019 & 2032
- Table 22: Global E-Signature Platform Industry Revenue Million Forecast, by Country 2019 & 2032
- Table 23: E-Signature Platform Industry Revenue (Million) Forecast, by Application 2019 & 2032
- Table 24: Global E-Signature Platform Industry Revenue Million Forecast, by Deployment 2019 & 2032
- Table 25: Global E-Signature Platform Industry Revenue Million Forecast, by Organization Size 2019 & 2032
- Table 26: Global E-Signature Platform Industry Revenue Million Forecast, by End-User Industry 2019 & 2032
- Table 27: Global E-Signature Platform Industry Revenue Million Forecast, by Country 2019 & 2032
- Table 28: United States E-Signature Platform Industry Revenue (Million) Forecast, by Application 2019 & 2032
- Table 29: Canada E-Signature Platform Industry Revenue (Million) Forecast, by Application 2019 & 2032
- Table 30: Global E-Signature Platform Industry Revenue Million Forecast, by Deployment 2019 & 2032
- Table 31: Global E-Signature Platform Industry Revenue Million Forecast, by Organization Size 2019 & 2032
- Table 32: Global E-Signature Platform Industry Revenue Million Forecast, by End-User Industry 2019 & 2032
- Table 33: Global E-Signature Platform Industry Revenue Million Forecast, by Country 2019 & 2032
- Table 34: United Kingdom E-Signature Platform Industry Revenue (Million) Forecast, by Application 2019 & 2032
- Table 35: Germany E-Signature Platform Industry Revenue (Million) Forecast, by Application 2019 & 2032
- Table 36: France E-Signature Platform Industry Revenue (Million) Forecast, by Application 2019 & 2032
- Table 37: Italy E-Signature Platform Industry Revenue (Million) Forecast, by Application 2019 & 2032
- Table 38: Global E-Signature Platform Industry Revenue Million Forecast, by Deployment 2019 & 2032
- Table 39: Global E-Signature Platform Industry Revenue Million Forecast, by Organization Size 2019 & 2032
- Table 40: Global E-Signature Platform Industry Revenue Million Forecast, by End-User Industry 2019 & 2032
- Table 41: Global E-Signature Platform Industry Revenue Million Forecast, by Country 2019 & 2032
- Table 42: China E-Signature Platform Industry Revenue (Million) Forecast, by Application 2019 & 2032
- Table 43: Japan E-Signature Platform Industry Revenue (Million) Forecast, by Application 2019 & 2032
- Table 44: South Korea E-Signature Platform Industry Revenue (Million) Forecast, by Application 2019 & 2032
- Table 45: Global E-Signature Platform Industry Revenue Million Forecast, by Deployment 2019 & 2032
- Table 46: Global E-Signature Platform Industry Revenue Million Forecast, by Organization Size 2019 & 2032
- Table 47: Global E-Signature Platform Industry Revenue Million Forecast, by End-User Industry 2019 & 2032
- Table 48: Global E-Signature Platform Industry Revenue Million Forecast, by Country 2019 & 2032
- Table 49: Global E-Signature Platform Industry Revenue Million Forecast, by Deployment 2019 & 2032
- Table 50: Global E-Signature Platform Industry Revenue Million Forecast, by Organization Size 2019 & 2032
- Table 51: Global E-Signature Platform Industry Revenue Million Forecast, by End-User Industry 2019 & 2032
- Table 52: Global E-Signature Platform Industry Revenue Million Forecast, by Country 2019 & 2032
- Table 53: Global E-Signature Platform Industry Revenue Million Forecast, by Deployment 2019 & 2032
- Table 54: Global E-Signature Platform Industry Revenue Million Forecast, by Organization Size 2019 & 2032
- Table 55: Global E-Signature Platform Industry Revenue Million Forecast, by End-User Industry 2019 & 2032
- Table 56: Global E-Signature Platform Industry Revenue Million Forecast, by Country 2019 & 2032
Frequently Asked Questions
1. What is the projected Compound Annual Growth Rate (CAGR) of the E-Signature Platform Industry?
The projected CAGR is approximately 29.08%.
2. Which companies are prominent players in the E-Signature Platform Industry?
Key companies in the market include Hellosign Inc (hellosign Api), Zoho Corporation Pvt Ltd, Airslate Inc (signnow), Signeasy (esign), Silanis-esignlive (onespan Inc ), Adobe Inc, Yousign, Docusign Inc, Rightsignature (citrix Systems), Pandadoc Inc.
3. What are the main segments of the E-Signature Platform Industry?
The market segments include Deployment, Organization Size, End-User Industry.
4. Can you provide details about the market size?
The market size is estimated to be USD 5.20 Million as of 2022.
5. What are some drivers contributing to market growth?
Rise In E-signatures And Adoption Of Cloud-based Services; Increase In Remote Work Culture And Overseas Contracts.
6. What are the notable trends driving market growth?
Government and Defense to hold significant share.
7. Are there any restraints impacting market growth?
Increasing Vulnerability Related To Cyber-attacks and Frauds.
8. Can you provide examples of recent developments in the market?
September 2022 - The National Institute of Standards and Technology requested additional digital signature proposals to be considered in the Post-Quantum Cryptography (PQC) standardization process. NIST is primarily interested in additional general-purpose signature schemes that are not based on structured lattices. For some applications, including certificate transparency, it may also be interested in signature schemes comprising short signatures and fast verification.
9. What pricing options are available for accessing the report?
Pricing options include single-user, multi-user, and enterprise licenses priced at USD 4750, USD 5250, and USD 8750 respectively.
10. Is the market size provided in terms of value or volume?
The market size is provided in terms of value, measured in Million.
11. Are there any specific market keywords associated with the report?
Yes, the market keyword associated with the report is "E-Signature Platform Industry," which aids in identifying and referencing the specific market segment covered.
12. How do I determine which pricing option suits my needs best?
The pricing options vary based on user requirements and access needs. Individual users may opt for single-user licenses, while businesses requiring broader access may choose multi-user or enterprise licenses for cost-effective access to the report.
13. Are there any additional resources or data provided in the E-Signature Platform Industry report?
While the report offers comprehensive insights, it's advisable to review the specific contents or supplementary materials provided to ascertain if additional resources or data are available.
14. How can I stay updated on further developments or reports in the E-Signature Platform Industry?
To stay informed about further developments, trends, and reports in the E-Signature Platform Industry, consider subscribing to industry newsletters, following relevant companies and organizations, or regularly checking reputable industry news sources and publications.
Methodology
Step 1 - Identification of Relevant Samples Size from Population Database


Step 2 - Approaches for Defining Global Market Size (Value, Volume* & Price*)

Note*: In applicable scenarios
Step 3 - Data Sources
Primary Research
- Web Analytics
- Survey Reports
- Research Institute
- Latest Research Reports
- Opinion Leaders
Secondary Research
- Annual Reports
- White Paper
- Latest Press Release
- Industry Association
- Paid Database
- Investor Presentations

Step 4 - Data Triangulation
Involves using different sources of information in order to increase the validity of a study
These sources are likely to be stakeholders in a program - participants, other researchers, program staff, other community members, and so on.
Then we put all data in single framework & apply various statistical tools to find out the dynamic on the market.
During the analysis stage, feedback from the stakeholder groups would be compared to determine areas of agreement as well as areas of divergence


