
Key Insights
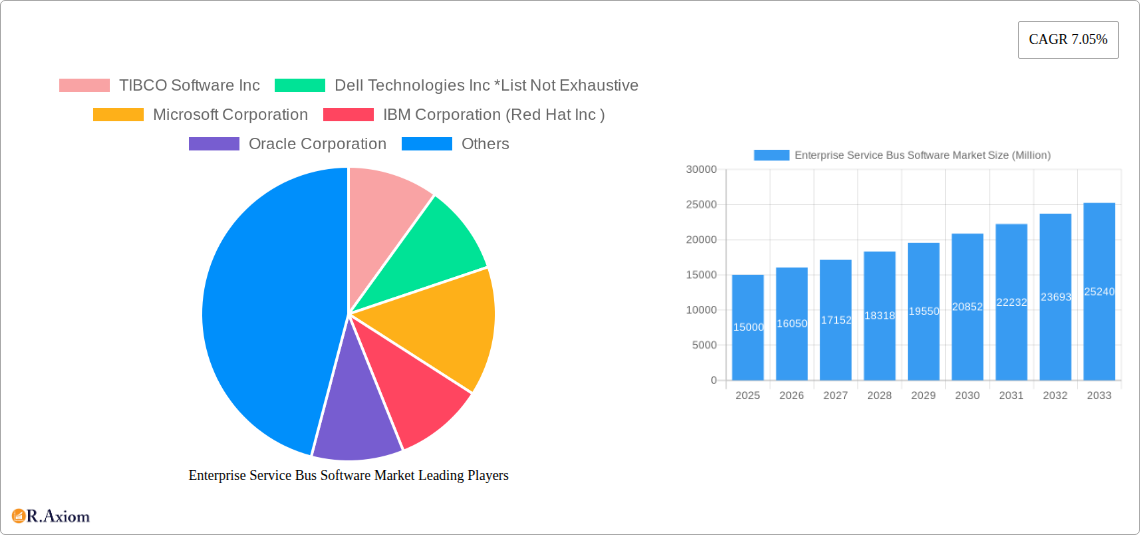
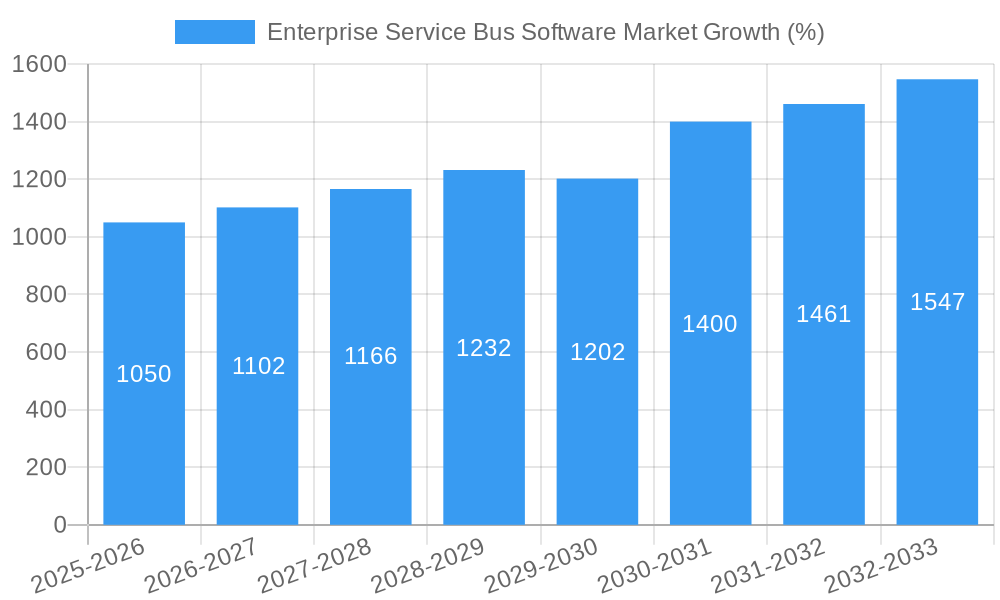
The Enterprise Service Bus (ESB) software market is experiencing robust growth, driven by the increasing need for seamless integration of applications and data across diverse platforms within enterprises. The market's Compound Annual Growth Rate (CAGR) of 7.05% from 2019 to 2024 suggests a consistent upward trajectory, projected to continue through 2033. Several factors fuel this expansion. The shift towards cloud-based deployments offers scalability, flexibility, and cost-effectiveness, attracting businesses of all sizes. Furthermore, the burgeoning demand for real-time data integration across various industries, including IT & Telecom, Retail, Healthcare, and BFSI, is a significant catalyst. The adoption of microservices architecture, requiring robust integration solutions, further strengthens market demand. While the on-premise deployment model continues to hold a share, cloud adoption is rapidly gaining momentum, shaping the future of ESB software deployment. Key players such as TIBCO Software, Dell Technologies, Microsoft, IBM, Oracle, Salesforce (MuleSoft), and SAP are actively competing in this space, contributing to innovation and fostering a competitive landscape.
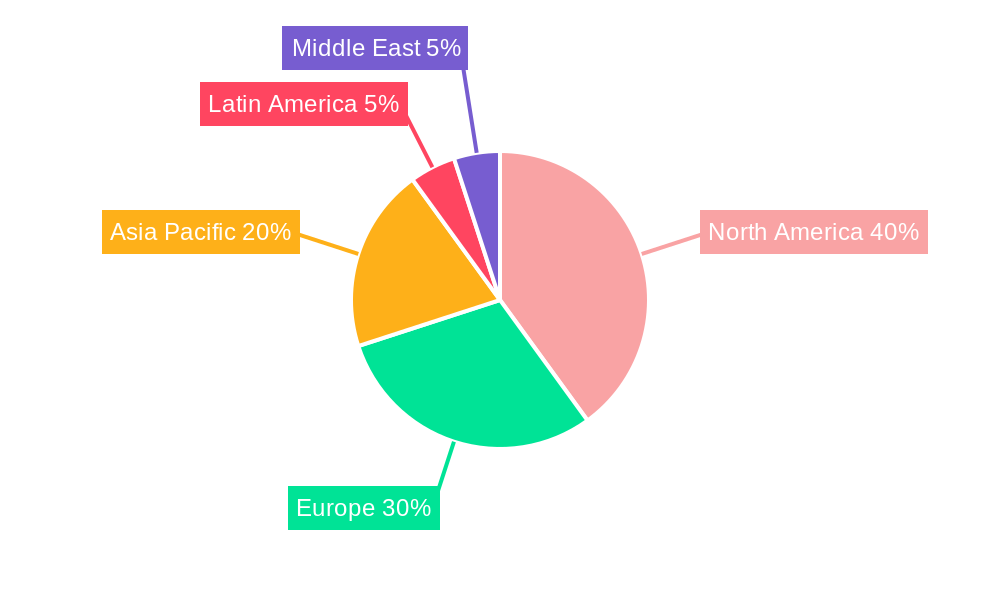
The market segmentation reveals a strong preference for cloud-based solutions, reflecting the broader trend of cloud computing adoption. Industry-wise, the IT & Telecom sector leads in ESB software adoption due to its complex infrastructure and integration requirements. However, growing digitalization across sectors like Retail, Healthcare, and BFSI is driving significant demand from these industries. While data for specific regional market shares is unavailable, North America and Europe are likely to dominate initially due to their advanced IT infrastructure and early adoption of cloud technologies. However, the Asia-Pacific region is projected to witness significant growth in the coming years fueled by increasing digitalization initiatives. Potential restraints include the complexity of implementing ESB solutions and the need for specialized skills. Nevertheless, the overall market outlook remains positive, indicating sustained growth and potential for significant expansion in the forecast period (2025-2033).
This comprehensive report provides a detailed analysis of the Enterprise Service Bus (ESB) Software market, offering actionable insights for stakeholders across the industry. The study covers the period 2019-2033, with 2025 as the base year and a forecast period extending to 2033. The report segments the market by deployment (on-cloud, on-premise), end-user industry (IT and Telecom, Retail, Healthcare, BFSI, Other End-user Industries), and leading players like TIBCO Software Inc, Dell Technologies Inc, Microsoft Corporation, IBM Corporation (Red Hat Inc), Oracle Corporation, Salesforce.com Inc (MuleSoft Inc), and SAP SE. The report's value lies in its detailed examination of market trends, competitive dynamics, and future growth potential.
Enterprise Service Bus Software Market Concentration & Innovation
The Enterprise Service Bus (ESB) Software market exhibits a moderately concentrated landscape, with a few dominant players holding significant market share. However, the market is also characterized by considerable innovation, driven by the increasing need for seamless integration of diverse applications and systems within enterprises. The market share of the top five players is estimated to be around xx%, reflecting a competitive but not entirely fragmented landscape. Several factors influence market concentration, including technological advancements, regulatory frameworks impacting data security and interoperability, the availability of substitute technologies (e.g., API gateways), and evolving end-user preferences towards cloud-based solutions. Mergers and acquisitions (M&A) play a crucial role in shaping the market, with deal values in recent years totaling an estimated xx Million. Notable M&A activities include strategic acquisitions focused on expanding product portfolios and geographical reach. The regulatory landscape, particularly concerning data privacy and security, significantly impacts market dynamics, creating both opportunities and challenges for vendors. End-user trends show a growing preference for cloud-based ESB solutions, driving vendors to invest heavily in cloud-native platforms and services.
Enterprise Service Bus Software Market Industry Trends & Insights
The Enterprise Service Bus (ESB) Software market is experiencing robust growth, driven by the increasing need for digital transformation initiatives across various industries. The market is expected to register a Compound Annual Growth Rate (CAGR) of xx% during the forecast period (2025-2033), reaching a market size of xx Million by 2033. This growth is fueled by several factors, including the rising adoption of cloud-based solutions, the expanding adoption of microservices architecture, and the growing demand for real-time data integration and analytics. Technological disruptions, such as the emergence of serverless computing and AI-powered integration platforms, are reshaping the competitive landscape, forcing vendors to continuously innovate and adapt. Consumer preferences are shifting towards flexible, scalable, and cost-effective ESB solutions, further accelerating the adoption of cloud-based offerings. The market penetration of cloud-based ESB solutions is projected to reach xx% by 2033, highlighting the significant shift towards cloud adoption. Competitive dynamics are characterized by intense competition among established players and emerging startups, leading to price pressures and a continuous innovation race.
Dominant Markets & Segments in Enterprise Service Bus Software Market
The North American region currently holds the dominant position in the global Enterprise Service Bus (ESB) Software market, driven by factors such as high technological adoption rates, a robust IT infrastructure, and the presence of major technology vendors. Within the deployment segment, the cloud-based ESB market is experiencing the fastest growth, fueled by its scalability, flexibility, and cost-effectiveness. In terms of end-user industries, the IT and Telecom sector exhibits the highest demand for ESB solutions, followed by the BFSI and Retail sectors.
Key Drivers for North American Dominance:
- Advanced technological infrastructure
- High levels of digital adoption
- Presence of major technology vendors
- Strong government support for technological advancements
Key Drivers for Cloud-Based ESB Growth:
- Scalability and flexibility
- Cost-effectiveness
- Improved agility and faster deployments
- Enhanced accessibility and remote collaboration
Key Drivers for IT & Telecom Sector Dominance:
- High volume of data and applications
- Need for real-time integration and analytics
- Complex system architectures
The dominance of these segments is expected to continue during the forecast period, though other regions and industries are expected to witness substantial growth.
Enterprise Service Bus Software Market Product Developments
Recent product innovations in the ESB software market are focused on enhancing integration capabilities, improving security, and simplifying deployment. Key technological trends include the integration of artificial intelligence (AI) for intelligent automation and advanced analytics capabilities, enabling more sophisticated data integration and processing. Many vendors are also focusing on the development of low-code/no-code platforms to streamline the ESB deployment and management process. These innovations cater to the growing demand for easier-to-use, more efficient, and secure solutions that seamlessly integrate with various cloud and on-premise systems. This market fit addresses the challenge of complex integration processes faced by enterprises.
Report Scope & Segmentation Analysis
This report segments the Enterprise Service Bus Software market based on deployment (on-cloud and on-premise) and end-user industry (IT and Telecom, Retail, Healthcare, BFSI, and Other End-user Industries). Each segment's growth projections, market size, and competitive dynamics are analyzed, revealing the significant growth potential of the cloud-based segment and the substantial demand from the IT and Telecom industry. The "Other End-user Industries" segment, encompassing government, manufacturing, and utilities, is also experiencing steady growth, demonstrating a wider adoption of ESB solutions across diverse sectors. Competitive dynamics within each segment differ, depending on the specific needs and priorities of each industry.
Key Drivers of Enterprise Service Bus Software Market Growth
The Enterprise Service Bus (ESB) Software market is propelled by several key factors. Firstly, the ongoing digital transformation initiatives across industries require robust integration solutions to connect disparate systems and applications. Secondly, the increasing adoption of cloud computing necessitates flexible and scalable ESB solutions that can seamlessly integrate on-premise and cloud-based systems. Finally, regulatory changes mandating data interoperability are driving the adoption of ESB solutions to ensure compliance and data security. These trends, combined with the expanding adoption of microservices architecture, create a robust market for ESB software.
Challenges in the Enterprise Service Bus Software Market Sector
The Enterprise Service Bus (ESB) Software market faces challenges such as the complexity of integration processes, high implementation costs, and the need for specialized skills. Furthermore, security concerns related to data breaches and compliance with data privacy regulations pose significant hurdles. The competitive landscape, characterized by both established players and agile startups, leads to pricing pressures and a need for continuous innovation. The overall impact of these challenges can lead to slower-than-expected adoption in certain sectors and increased time-to-market for new solutions. These factors contribute to a complex market environment.
Emerging Opportunities in Enterprise Service Bus Software Market
Emerging opportunities for growth lie in the adoption of AI-powered integration platforms that enhance automation and analytics capabilities. The integration of serverless computing into ESB architectures offers improved scalability and cost optimization. Furthermore, the rising demand for real-time data integration across various platforms presents a significant growth opportunity for ESB software vendors. Expanding into new, emerging markets and focusing on niche industry-specific solutions will be crucial for success.
Leading Players in the Enterprise Service Bus Software Market Market
- TIBCO Software Inc
- Dell Technologies Inc
- Microsoft Corporation
- IBM Corporation (Red Hat Inc)
- Oracle Corporation
- Salesforce.com Inc (MuleSoft Inc)
- SAP SE
Key Developments in Enterprise Service Bus Software Market Industry
October 2022: Red Hat's Openshift Dedicated Solution, operating on the AWS cloud, was adopted by Westech, a UK digital marketing agency. This showcases the increasing adoption of cloud-based ESB solutions and highlights the value proposition of such solutions in meeting high-traffic demands efficiently and cost-effectively.
February 2023: Pimly, a Chicago-based startup, invested $5 Million in leveraging Salesforce as the primary source for product information, breaking down data silos and empowering stakeholders with improved data access and expertise. This exemplifies the increasing role of ESB solutions in enabling data centralization and enhancing operational efficiency.
Strategic Outlook for Enterprise Service Bus Software Market Market
The future of the Enterprise Service Bus (ESB) Software market is bright, driven by the ongoing digital transformation trends across various sectors. The increasing demand for real-time data integration, coupled with the adoption of cloud-native architectures and AI-powered integration platforms, will continue to fuel market growth. The market will witness further consolidation among players, with strategic partnerships and M&A activities shaping the competitive landscape. Opportunities for innovative solutions addressing specific industry needs will further drive market expansion.
Enterprise Service Bus Software Market Segmentation
-
1. Deployment
- 1.1. On Cloud
- 1.2. On-premise
-
2. End-user Industry
- 2.1. IT and Telecom
- 2.2. Retail
- 2.3. Healthcare
- 2.4. BFSI
- 2.5. Other En
Enterprise Service Bus Software Market Segmentation By Geography
- 1. North America
- 2. Europe
- 3. Asia Pacific
- 4. Latin America
- 5. Middle East
Enterprise Service Bus Software Market REPORT HIGHLIGHTS
| Aspects | Details |
|---|---|
| Study Period | 2019-2033 |
| Base Year | 2024 |
| Estimated Year | 2025 |
| Forecast Period | 2025-2033 |
| Historical Period | 2019-2024 |
| Growth Rate | CAGR of 7.05% from 2019-2033 |
| Segmentation |
|
Table of Contents
- 1. Introduction
- 1.1. Research Scope
- 1.2. Market Segmentation
- 1.3. Research Methodology
- 1.4. Definitions and Assumptions
- 2. Executive Summary
- 2.1. Introduction
- 3. Market Dynamics
- 3.1. Introduction
- 3.2. Market Drivers
- 3.2.1. Growing Adoption of Cloud-based Solutions; Rising Development of IoT Projects
- 3.3. Market Restrains
- 3.3.1. High Installation Cost to Challenge the Market Growth
- 3.4. Market Trends
- 3.4.1. Rising Development of IoT Projects Boosting the Market Growth
- 4. Market Factor Analysis
- 4.1. Porters Five Forces
- 4.2. Supply/Value Chain
- 4.3. PESTEL analysis
- 4.4. Market Entropy
- 4.5. Patent/Trademark Analysis
- 5. Global Enterprise Service Bus Software Market Analysis, Insights and Forecast, 2019-2031
- 5.1. Market Analysis, Insights and Forecast - by Deployment
- 5.1.1. On Cloud
- 5.1.2. On-premise
- 5.2. Market Analysis, Insights and Forecast - by End-user Industry
- 5.2.1. IT and Telecom
- 5.2.2. Retail
- 5.2.3. Healthcare
- 5.2.4. BFSI
- 5.2.5. Other En
- 5.3. Market Analysis, Insights and Forecast - by Region
- 5.3.1. North America
- 5.3.2. Europe
- 5.3.3. Asia Pacific
- 5.3.4. Latin America
- 5.3.5. Middle East
- 5.1. Market Analysis, Insights and Forecast - by Deployment
- 6. North America Enterprise Service Bus Software Market Analysis, Insights and Forecast, 2019-2031
- 6.1. Market Analysis, Insights and Forecast - by Deployment
- 6.1.1. On Cloud
- 6.1.2. On-premise
- 6.2. Market Analysis, Insights and Forecast - by End-user Industry
- 6.2.1. IT and Telecom
- 6.2.2. Retail
- 6.2.3. Healthcare
- 6.2.4. BFSI
- 6.2.5. Other En
- 6.1. Market Analysis, Insights and Forecast - by Deployment
- 7. Europe Enterprise Service Bus Software Market Analysis, Insights and Forecast, 2019-2031
- 7.1. Market Analysis, Insights and Forecast - by Deployment
- 7.1.1. On Cloud
- 7.1.2. On-premise
- 7.2. Market Analysis, Insights and Forecast - by End-user Industry
- 7.2.1. IT and Telecom
- 7.2.2. Retail
- 7.2.3. Healthcare
- 7.2.4. BFSI
- 7.2.5. Other En
- 7.1. Market Analysis, Insights and Forecast - by Deployment
- 8. Asia Pacific Enterprise Service Bus Software Market Analysis, Insights and Forecast, 2019-2031
- 8.1. Market Analysis, Insights and Forecast - by Deployment
- 8.1.1. On Cloud
- 8.1.2. On-premise
- 8.2. Market Analysis, Insights and Forecast - by End-user Industry
- 8.2.1. IT and Telecom
- 8.2.2. Retail
- 8.2.3. Healthcare
- 8.2.4. BFSI
- 8.2.5. Other En
- 8.1. Market Analysis, Insights and Forecast - by Deployment
- 9. Latin America Enterprise Service Bus Software Market Analysis, Insights and Forecast, 2019-2031
- 9.1. Market Analysis, Insights and Forecast - by Deployment
- 9.1.1. On Cloud
- 9.1.2. On-premise
- 9.2. Market Analysis, Insights and Forecast - by End-user Industry
- 9.2.1. IT and Telecom
- 9.2.2. Retail
- 9.2.3. Healthcare
- 9.2.4. BFSI
- 9.2.5. Other En
- 9.1. Market Analysis, Insights and Forecast - by Deployment
- 10. Middle East Enterprise Service Bus Software Market Analysis, Insights and Forecast, 2019-2031
- 10.1. Market Analysis, Insights and Forecast - by Deployment
- 10.1.1. On Cloud
- 10.1.2. On-premise
- 10.2. Market Analysis, Insights and Forecast - by End-user Industry
- 10.2.1. IT and Telecom
- 10.2.2. Retail
- 10.2.3. Healthcare
- 10.2.4. BFSI
- 10.2.5. Other En
- 10.1. Market Analysis, Insights and Forecast - by Deployment
- 11. North America Enterprise Service Bus Software Market Analysis, Insights and Forecast, 2019-2031
- 11.1. Market Analysis, Insights and Forecast - By Country/Sub-region
- 11.1.1.
- 12. Europe Enterprise Service Bus Software Market Analysis, Insights and Forecast, 2019-2031
- 12.1. Market Analysis, Insights and Forecast - By Country/Sub-region
- 12.1.1.
- 13. Asia Pacific Enterprise Service Bus Software Market Analysis, Insights and Forecast, 2019-2031
- 13.1. Market Analysis, Insights and Forecast - By Country/Sub-region
- 13.1.1.
- 14. Latin America Enterprise Service Bus Software Market Analysis, Insights and Forecast, 2019-2031
- 14.1. Market Analysis, Insights and Forecast - By Country/Sub-region
- 14.1.1.
- 15. Middle East Enterprise Service Bus Software Market Analysis, Insights and Forecast, 2019-2031
- 15.1. Market Analysis, Insights and Forecast - By Country/Sub-region
- 15.1.1.
- 16. Competitive Analysis
- 16.1. Global Market Share Analysis 2024
- 16.2. Company Profiles
- 16.2.1 TIBCO Software Inc
- 16.2.1.1. Overview
- 16.2.1.2. Products
- 16.2.1.3. SWOT Analysis
- 16.2.1.4. Recent Developments
- 16.2.1.5. Financials (Based on Availability)
- 16.2.2 Dell Technologies Inc *List Not Exhaustive
- 16.2.2.1. Overview
- 16.2.2.2. Products
- 16.2.2.3. SWOT Analysis
- 16.2.2.4. Recent Developments
- 16.2.2.5. Financials (Based on Availability)
- 16.2.3 Microsoft Corporation
- 16.2.3.1. Overview
- 16.2.3.2. Products
- 16.2.3.3. SWOT Analysis
- 16.2.3.4. Recent Developments
- 16.2.3.5. Financials (Based on Availability)
- 16.2.4 IBM Corporation (Red Hat Inc )
- 16.2.4.1. Overview
- 16.2.4.2. Products
- 16.2.4.3. SWOT Analysis
- 16.2.4.4. Recent Developments
- 16.2.4.5. Financials (Based on Availability)
- 16.2.5 Oracle Corporation
- 16.2.5.1. Overview
- 16.2.5.2. Products
- 16.2.5.3. SWOT Analysis
- 16.2.5.4. Recent Developments
- 16.2.5.5. Financials (Based on Availability)
- 16.2.6 Salesforce com Inc (MuleSoft Inc )
- 16.2.6.1. Overview
- 16.2.6.2. Products
- 16.2.6.3. SWOT Analysis
- 16.2.6.4. Recent Developments
- 16.2.6.5. Financials (Based on Availability)
- 16.2.7 SAP SE
- 16.2.7.1. Overview
- 16.2.7.2. Products
- 16.2.7.3. SWOT Analysis
- 16.2.7.4. Recent Developments
- 16.2.7.5. Financials (Based on Availability)
- 16.2.1 TIBCO Software Inc
List of Figures
- Figure 1: Global Enterprise Service Bus Software Market Revenue Breakdown (Million, %) by Region 2024 & 2032
- Figure 2: North America Enterprise Service Bus Software Market Revenue (Million), by Country 2024 & 2032
- Figure 3: North America Enterprise Service Bus Software Market Revenue Share (%), by Country 2024 & 2032
- Figure 4: Europe Enterprise Service Bus Software Market Revenue (Million), by Country 2024 & 2032
- Figure 5: Europe Enterprise Service Bus Software Market Revenue Share (%), by Country 2024 & 2032
- Figure 6: Asia Pacific Enterprise Service Bus Software Market Revenue (Million), by Country 2024 & 2032
- Figure 7: Asia Pacific Enterprise Service Bus Software Market Revenue Share (%), by Country 2024 & 2032
- Figure 8: Latin America Enterprise Service Bus Software Market Revenue (Million), by Country 2024 & 2032
- Figure 9: Latin America Enterprise Service Bus Software Market Revenue Share (%), by Country 2024 & 2032
- Figure 10: Middle East Enterprise Service Bus Software Market Revenue (Million), by Country 2024 & 2032
- Figure 11: Middle East Enterprise Service Bus Software Market Revenue Share (%), by Country 2024 & 2032
- Figure 12: North America Enterprise Service Bus Software Market Revenue (Million), by Deployment 2024 & 2032
- Figure 13: North America Enterprise Service Bus Software Market Revenue Share (%), by Deployment 2024 & 2032
- Figure 14: North America Enterprise Service Bus Software Market Revenue (Million), by End-user Industry 2024 & 2032
- Figure 15: North America Enterprise Service Bus Software Market Revenue Share (%), by End-user Industry 2024 & 2032
- Figure 16: North America Enterprise Service Bus Software Market Revenue (Million), by Country 2024 & 2032
- Figure 17: North America Enterprise Service Bus Software Market Revenue Share (%), by Country 2024 & 2032
- Figure 18: Europe Enterprise Service Bus Software Market Revenue (Million), by Deployment 2024 & 2032
- Figure 19: Europe Enterprise Service Bus Software Market Revenue Share (%), by Deployment 2024 & 2032
- Figure 20: Europe Enterprise Service Bus Software Market Revenue (Million), by End-user Industry 2024 & 2032
- Figure 21: Europe Enterprise Service Bus Software Market Revenue Share (%), by End-user Industry 2024 & 2032
- Figure 22: Europe Enterprise Service Bus Software Market Revenue (Million), by Country 2024 & 2032
- Figure 23: Europe Enterprise Service Bus Software Market Revenue Share (%), by Country 2024 & 2032
- Figure 24: Asia Pacific Enterprise Service Bus Software Market Revenue (Million), by Deployment 2024 & 2032
- Figure 25: Asia Pacific Enterprise Service Bus Software Market Revenue Share (%), by Deployment 2024 & 2032
- Figure 26: Asia Pacific Enterprise Service Bus Software Market Revenue (Million), by End-user Industry 2024 & 2032
- Figure 27: Asia Pacific Enterprise Service Bus Software Market Revenue Share (%), by End-user Industry 2024 & 2032
- Figure 28: Asia Pacific Enterprise Service Bus Software Market Revenue (Million), by Country 2024 & 2032
- Figure 29: Asia Pacific Enterprise Service Bus Software Market Revenue Share (%), by Country 2024 & 2032
- Figure 30: Latin America Enterprise Service Bus Software Market Revenue (Million), by Deployment 2024 & 2032
- Figure 31: Latin America Enterprise Service Bus Software Market Revenue Share (%), by Deployment 2024 & 2032
- Figure 32: Latin America Enterprise Service Bus Software Market Revenue (Million), by End-user Industry 2024 & 2032
- Figure 33: Latin America Enterprise Service Bus Software Market Revenue Share (%), by End-user Industry 2024 & 2032
- Figure 34: Latin America Enterprise Service Bus Software Market Revenue (Million), by Country 2024 & 2032
- Figure 35: Latin America Enterprise Service Bus Software Market Revenue Share (%), by Country 2024 & 2032
- Figure 36: Middle East Enterprise Service Bus Software Market Revenue (Million), by Deployment 2024 & 2032
- Figure 37: Middle East Enterprise Service Bus Software Market Revenue Share (%), by Deployment 2024 & 2032
- Figure 38: Middle East Enterprise Service Bus Software Market Revenue (Million), by End-user Industry 2024 & 2032
- Figure 39: Middle East Enterprise Service Bus Software Market Revenue Share (%), by End-user Industry 2024 & 2032
- Figure 40: Middle East Enterprise Service Bus Software Market Revenue (Million), by Country 2024 & 2032
- Figure 41: Middle East Enterprise Service Bus Software Market Revenue Share (%), by Country 2024 & 2032
List of Tables
- Table 1: Global Enterprise Service Bus Software Market Revenue Million Forecast, by Region 2019 & 2032
- Table 2: Global Enterprise Service Bus Software Market Revenue Million Forecast, by Deployment 2019 & 2032
- Table 3: Global Enterprise Service Bus Software Market Revenue Million Forecast, by End-user Industry 2019 & 2032
- Table 4: Global Enterprise Service Bus Software Market Revenue Million Forecast, by Region 2019 & 2032
- Table 5: Global Enterprise Service Bus Software Market Revenue Million Forecast, by Country 2019 & 2032
- Table 6: Enterprise Service Bus Software Market Revenue (Million) Forecast, by Application 2019 & 2032
- Table 7: Global Enterprise Service Bus Software Market Revenue Million Forecast, by Country 2019 & 2032
- Table 8: Enterprise Service Bus Software Market Revenue (Million) Forecast, by Application 2019 & 2032
- Table 9: Global Enterprise Service Bus Software Market Revenue Million Forecast, by Country 2019 & 2032
- Table 10: Enterprise Service Bus Software Market Revenue (Million) Forecast, by Application 2019 & 2032
- Table 11: Global Enterprise Service Bus Software Market Revenue Million Forecast, by Country 2019 & 2032
- Table 12: Enterprise Service Bus Software Market Revenue (Million) Forecast, by Application 2019 & 2032
- Table 13: Global Enterprise Service Bus Software Market Revenue Million Forecast, by Country 2019 & 2032
- Table 14: Enterprise Service Bus Software Market Revenue (Million) Forecast, by Application 2019 & 2032
- Table 15: Global Enterprise Service Bus Software Market Revenue Million Forecast, by Deployment 2019 & 2032
- Table 16: Global Enterprise Service Bus Software Market Revenue Million Forecast, by End-user Industry 2019 & 2032
- Table 17: Global Enterprise Service Bus Software Market Revenue Million Forecast, by Country 2019 & 2032
- Table 18: Global Enterprise Service Bus Software Market Revenue Million Forecast, by Deployment 2019 & 2032
- Table 19: Global Enterprise Service Bus Software Market Revenue Million Forecast, by End-user Industry 2019 & 2032
- Table 20: Global Enterprise Service Bus Software Market Revenue Million Forecast, by Country 2019 & 2032
- Table 21: Global Enterprise Service Bus Software Market Revenue Million Forecast, by Deployment 2019 & 2032
- Table 22: Global Enterprise Service Bus Software Market Revenue Million Forecast, by End-user Industry 2019 & 2032
- Table 23: Global Enterprise Service Bus Software Market Revenue Million Forecast, by Country 2019 & 2032
- Table 24: Global Enterprise Service Bus Software Market Revenue Million Forecast, by Deployment 2019 & 2032
- Table 25: Global Enterprise Service Bus Software Market Revenue Million Forecast, by End-user Industry 2019 & 2032
- Table 26: Global Enterprise Service Bus Software Market Revenue Million Forecast, by Country 2019 & 2032
- Table 27: Global Enterprise Service Bus Software Market Revenue Million Forecast, by Deployment 2019 & 2032
- Table 28: Global Enterprise Service Bus Software Market Revenue Million Forecast, by End-user Industry 2019 & 2032
- Table 29: Global Enterprise Service Bus Software Market Revenue Million Forecast, by Country 2019 & 2032
Frequently Asked Questions
1. What is the projected Compound Annual Growth Rate (CAGR) of the Enterprise Service Bus Software Market?
The projected CAGR is approximately 7.05%.
2. Which companies are prominent players in the Enterprise Service Bus Software Market?
Key companies in the market include TIBCO Software Inc, Dell Technologies Inc *List Not Exhaustive, Microsoft Corporation, IBM Corporation (Red Hat Inc ), Oracle Corporation, Salesforce com Inc (MuleSoft Inc ), SAP SE.
3. What are the main segments of the Enterprise Service Bus Software Market?
The market segments include Deployment, End-user Industry.
4. Can you provide details about the market size?
The market size is estimated to be USD XX Million as of 2022.
5. What are some drivers contributing to market growth?
Growing Adoption of Cloud-based Solutions; Rising Development of IoT Projects.
6. What are the notable trends driving market growth?
Rising Development of IoT Projects Boosting the Market Growth.
7. Are there any restraints impacting market growth?
High Installation Cost to Challenge the Market Growth.
8. Can you provide examples of recent developments in the market?
October 2022: Red Hat's Openshift Dedicated Solution, which operates on the AWS cloud, was adopted by Westech, a digital marketing agency in the UK. 50 Westech employees and two Red Hat programmers finished a three-day Open Shift hackathon in a trail race. Westech will be able to meet new market demands with the aid of this solution and its innovative and astute concepts. High traffic demands may be met quickly and affordably.
9. What pricing options are available for accessing the report?
Pricing options include single-user, multi-user, and enterprise licenses priced at USD 4750, USD 5250, and USD 8750 respectively.
10. Is the market size provided in terms of value or volume?
The market size is provided in terms of value, measured in Million.
11. Are there any specific market keywords associated with the report?
Yes, the market keyword associated with the report is "Enterprise Service Bus Software Market," which aids in identifying and referencing the specific market segment covered.
12. How do I determine which pricing option suits my needs best?
The pricing options vary based on user requirements and access needs. Individual users may opt for single-user licenses, while businesses requiring broader access may choose multi-user or enterprise licenses for cost-effective access to the report.
13. Are there any additional resources or data provided in the Enterprise Service Bus Software Market report?
While the report offers comprehensive insights, it's advisable to review the specific contents or supplementary materials provided to ascertain if additional resources or data are available.
14. How can I stay updated on further developments or reports in the Enterprise Service Bus Software Market?
To stay informed about further developments, trends, and reports in the Enterprise Service Bus Software Market, consider subscribing to industry newsletters, following relevant companies and organizations, or regularly checking reputable industry news sources and publications.
Methodology
Step 1 - Identification of Relevant Samples Size from Population Database


Step 2 - Approaches for Defining Global Market Size (Value, Volume* & Price*)

Note*: In applicable scenarios
Step 3 - Data Sources
Primary Research
- Web Analytics
- Survey Reports
- Research Institute
- Latest Research Reports
- Opinion Leaders
Secondary Research
- Annual Reports
- White Paper
- Latest Press Release
- Industry Association
- Paid Database
- Investor Presentations

Step 4 - Data Triangulation
Involves using different sources of information in order to increase the validity of a study
These sources are likely to be stakeholders in a program - participants, other researchers, program staff, other community members, and so on.
Then we put all data in single framework & apply various statistical tools to find out the dynamic on the market.
During the analysis stage, feedback from the stakeholder groups would be compared to determine areas of agreement as well as areas of divergence


