
Key Insights
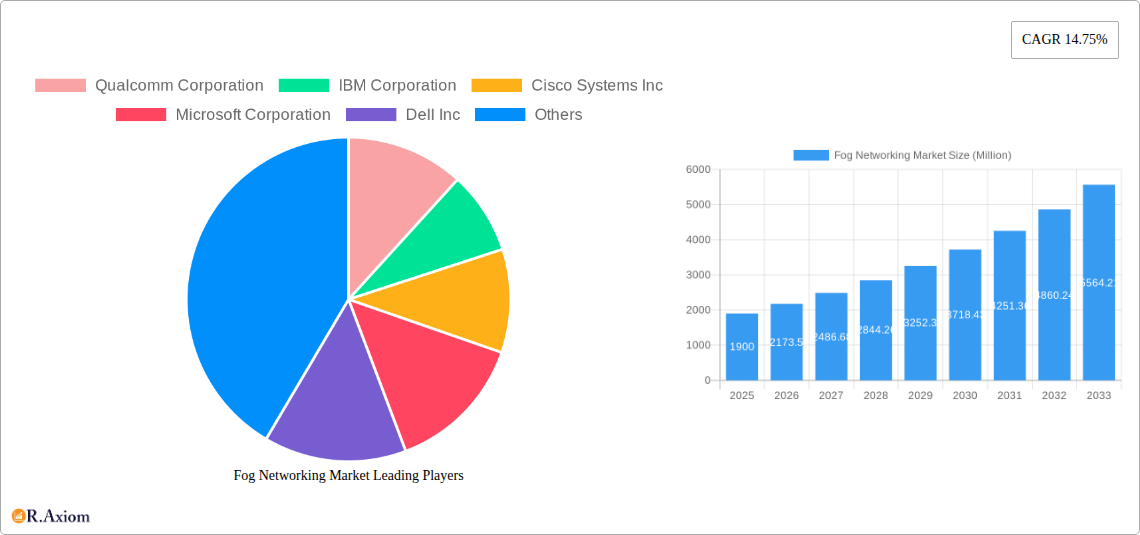
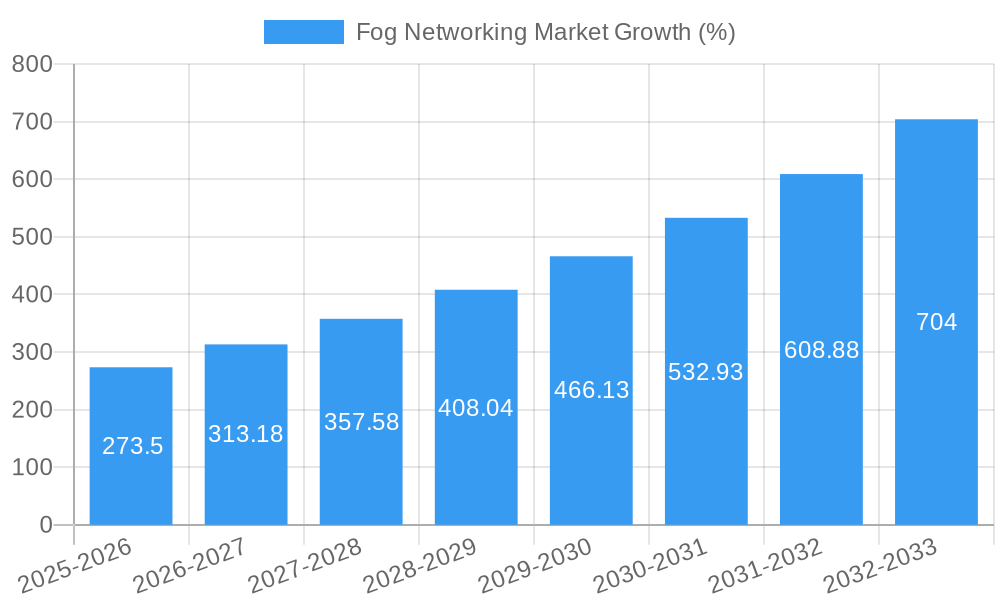
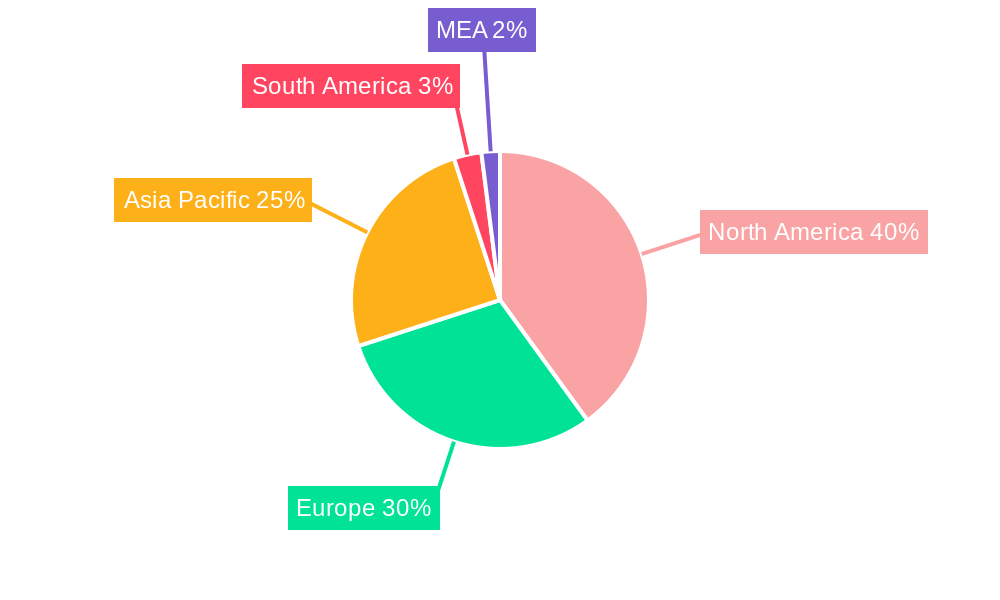
The Fog Networking market is experiencing robust growth, projected to reach $1.90 billion in 2025 and exhibiting a Compound Annual Growth Rate (CAGR) of 14.75% from 2025 to 2033. This expansion is driven by several key factors. The increasing adoption of IoT devices across diverse sectors like smart manufacturing, connected healthcare, and smart homes fuels the demand for efficient data processing closer to the edge. The need for low latency, high bandwidth, and improved security in data transmission is further propelling market growth. Furthermore, advancements in 5G technology and edge computing capabilities are creating new opportunities for Fog Networking solutions. The market is segmented by component (hardware, software, and services) and end-user application (smart meters, building & home automation, smart manufacturing, connected healthcare, connected vehicles, and others). North America currently holds a significant market share due to early adoption of advanced technologies and a strong technological infrastructure. However, the Asia-Pacific region is expected to witness substantial growth in the coming years, fueled by rapid industrialization and urbanization, particularly in countries like China and India. The competitive landscape includes major technology players such as Qualcomm, IBM, Cisco, Microsoft, and Dell, among others, actively investing in research and development to enhance their offerings and capture a larger market share. Competitive pressures are expected to drive innovation and affordability within the Fog Networking market.
The growth trajectory of the Fog Networking market is anticipated to remain strong throughout the forecast period (2025-2033). However, challenges like high initial investment costs for infrastructure deployment and the complexity of integrating Fog Networking solutions into existing systems could act as potential restraints. Addressing interoperability issues and ensuring data security and privacy will be crucial for sustained market growth. The ongoing development of standardized protocols and robust security frameworks will be essential in fostering wider adoption across various industries. Companies are focusing on strategic partnerships and acquisitions to expand their market reach and offer comprehensive solutions. The market's future depends on continuous innovation in hardware, software, and service offerings, coupled with effective addressing of the challenges and opportunities presented by the evolving technological landscape.
Fog Networking Market: A Comprehensive Report (2019-2033)
This comprehensive report provides an in-depth analysis of the Fog Networking market, offering valuable insights into market dynamics, growth drivers, challenges, and future opportunities. The study covers the period from 2019 to 2033, with 2025 serving as the base and estimated year. The report is essential for industry stakeholders, investors, and businesses seeking to understand and capitalize on the evolving landscape of fog computing. The market is projected to reach xx Million by 2033, exhibiting a CAGR of xx% during the forecast period (2025-2033).
Fog Networking Market Concentration & Innovation
The Fog Networking market exhibits a moderately concentrated landscape, with key players like Qualcomm Corporation, IBM Corporation, Cisco Systems Inc, Microsoft Corporation, Dell Inc, Amazon Web Services Inc, Tata Consultancy Services Limited, Nokia Corporation, Nebbiolo Technologies, and Intel Corporation holding significant market share. However, the market also witnesses the emergence of several niche players and startups driving innovation.
Market concentration is further influenced by factors such as:
- Mergers and Acquisitions (M&A): The Fog Networking market has seen several M&A activities in recent years, with deal values totaling approximately xx Million in 2024. These activities have consolidated market share and accelerated technological advancements. For instance, the acquisition of X company by Y company in [Year] resulted in a combined market share of xx%.
- Innovation Drivers: Continuous advancements in areas such as edge computing, 5G networks, and AI are fueling market growth and driving innovation. New functionalities like improved security protocols and optimized data processing are key drivers.
- Regulatory Frameworks: Government regulations and initiatives supporting IoT adoption and digital transformation indirectly impact the Fog Networking market's growth.
- Product Substitutes: Cloud computing serves as a partial substitute, but the unique advantages of fog computing in latency-sensitive applications maintain market demand.
- End-User Trends: Increasing adoption of IoT devices across various sectors fuels the demand for fog networking solutions. The growing need for real-time data processing and analytics in applications like smart cities and connected vehicles is a primary driver.
Fog Networking Market Industry Trends & Insights
The Fog Networking market is witnessing significant growth, driven by several key factors. The increasing adoption of Internet of Things (IoT) devices and the rising demand for real-time data processing and analysis are key drivers. The market is also experiencing technological disruptions, with the advent of 5G and edge computing technologies further enhancing the capabilities and applications of fog networking. Consumer preferences are shifting towards more efficient and secure data management solutions, which are essential for leveraging the full potential of IoT deployments. The competitive dynamics are shaping the market landscape, with established players and new entrants vying for market share.
- Market Growth Drivers: The growing need for low latency applications and increasing demand for edge computing solutions are primary market drivers.
- Technological Disruptions: 5G technology and advancements in edge computing are disrupting the market by enhancing processing capabilities and expanding application possibilities.
- Consumer Preferences: Demand for secure and reliable data management solutions that meet the specific requirements of different applications is driving market growth.
- Competitive Dynamics: The market shows intense competition among established players and emerging companies, leading to product innovation and strategic partnerships.
Dominant Markets & Segments in Fog Networking Market
The North American region currently holds the dominant position in the Fog Networking market, primarily due to early adoption of IoT technologies, robust IT infrastructure, and the presence of major technology companies. However, the Asia-Pacific region is projected to experience significant growth over the forecast period driven by increasing investments in infrastructure and burgeoning IoT adoption in countries like China and India.
By Component:
- Hardware: This segment dominates the market due to the requirement for specialized hardware infrastructure to support edge computing functionalities. Growth is fueled by the increasing demand for high-performance processors, network switches, and storage devices.
- Software: This segment is witnessing considerable growth, with continuous development of platforms, middleware, and applications optimized for fog networking environments. The rising need for efficient data management and analytics is a key driver.
- Services: The services segment is driven by the growing demand for deployment, integration, and management services related to fog networking solutions. The complexity of implementing and maintaining fog networking infrastructure necessitates robust service support.
By End-user Application:
- Smart Manufacturing: This segment is experiencing substantial growth driven by the need for real-time data analysis and automation in manufacturing processes. The ability to optimize production efficiency and reduce downtime through fog computing is a key factor.
- Connected Healthcare: This segment is growing rapidly due to the need for remote patient monitoring, telemedicine, and improved healthcare service delivery.
- Smart Metering: The increasing adoption of smart meters for efficient energy management across residential and commercial settings is propelling this segment's growth.
- Building and Home Automation: This segment is gaining traction with the rising popularity of smart homes and buildings. Fog computing enables efficient management of home appliances and building systems, enhancing energy efficiency and convenience.
- Connected Vehicles: The increasing connectivity in vehicles and the need for real-time data processing for autonomous driving and safety features are driving this segment's growth.
Fog Networking Market Product Developments
Recent product innovations include the development of more efficient and secure fog computing platforms, advanced analytics tools for real-time data processing, and improved security protocols to protect data transmission and storage. These advancements are enhancing the capabilities and applications of fog networking, making it more suitable for a wide range of industries. The focus is on optimizing performance, reducing latency, and enhancing security, aligning with market demands for secure and efficient data management.
Report Scope & Segmentation Analysis
This report comprehensively analyzes the Fog Networking market based on the following segmentations:
By Component: Hardware, Software, and Services. Each segment’s growth is projected, and market size estimates are provided. Competitive dynamics within each segment are also analyzed.
By End-user Application: Smart Meter, Building and Home Automation, Smart Manufacturing, Connected Healthcare, Connected Vehicle, and Other End-user Applications. Each segment's growth potential and market size are assessed, considering factors like adoption rates and technological advancements.
Key Drivers of Fog Networking Market Growth
The Fog Networking market is fueled by several key drivers, including:
- Technological advancements: The development of 5G and edge computing technologies is a major catalyst for market expansion.
- IoT growth: The exponential rise in IoT devices necessitates efficient data processing capabilities, creating significant demand for fog networking solutions.
- Growing need for real-time analytics: Many industries require real-time data processing and analysis, making fog computing crucial for time-sensitive operations.
- Government initiatives: Regulatory frameworks and government investments in smart city initiatives and digital infrastructure projects further accelerate market adoption.
Challenges in the Fog Networking Market Sector
Several challenges impede the Fog Networking market's growth:
- High initial investment costs: Deploying fog networking infrastructure requires significant capital expenditure, potentially deterring smaller businesses.
- Security concerns: Protecting data transmitted and processed at the edge requires robust security measures, adding complexity and cost.
- Interoperability issues: Ensuring seamless interoperability between diverse devices and systems in a fog network can be complex.
- Skill gap: A shortage of skilled professionals to manage and maintain fog networking infrastructure poses a challenge. This results in approximately xx% of projects facing delays due to personnel constraints.
Emerging Opportunities in Fog Networking Market
The Fog Networking market presents several promising opportunities:
- Expanding into new markets: The technology finds applications in diverse sectors, offering significant growth potential beyond current applications.
- Development of new services: Innovative services like AI-powered analytics and customized security solutions are emerging.
- Integration with other technologies: Combining fog computing with blockchain and other emerging technologies enhances security and efficiency.
- Increased investment in R&D: Continued investment in research and development will drive innovation and improve the functionality of fog networking technologies.
Leading Players in the Fog Networking Market
- Qualcomm Corporation
- IBM Corporation
- Cisco Systems Inc
- Microsoft Corporation
- Dell Inc
- Amazon Web Services Inc
- Tata Consultancy Services Limited
- Nokia Corporation
- Nebbiolo Technologies
- Intel Corporation
Key Developments in Fog Networking Market Industry
- January 2024: Qualcomm announced a new chip designed specifically for edge computing applications.
- March 2024: Cisco launched a new software platform for managing fog networking infrastructure.
- June 2024: IBM partnered with a major telecommunications company to deploy a large-scale fog network.
- October 2024: A significant merger occurred in the market, combining two smaller companies to increase market share.
Strategic Outlook for Fog Networking Market
The Fog Networking market is poised for substantial growth, driven by continued technological advancements, increasing IoT adoption, and growing demand for real-time data processing. The market is expected to witness increased consolidation through mergers and acquisitions, as well as the emergence of innovative service offerings. Businesses that strategically position themselves to capitalize on these trends will likely experience significant growth in the coming years.
Fog Networking Market Segmentation
-
1. Component
- 1.1. Hardware
- 1.2. Software
- 1.3. Service
-
2. End-user Application
- 2.1. Smart Meter
- 2.2. Building and Home Automation
- 2.3. Smart Manufacturing
- 2.4. Connected Healthcare
- 2.5. Connected Vehicle
- 2.6. Other End-user Applications
Fog Networking Market Segmentation By Geography
- 1. North America
- 2. Europe
- 3. Asia Pacific
- 4. Rest of the World
Fog Networking Market REPORT HIGHLIGHTS
| Aspects | Details |
|---|---|
| Study Period | 2019-2033 |
| Base Year | 2024 |
| Estimated Year | 2025 |
| Forecast Period | 2025-2033 |
| Historical Period | 2019-2024 |
| Growth Rate | CAGR of 14.75% from 2019-2033 |
| Segmentation |
|
Table of Contents
- 1. Introduction
- 1.1. Research Scope
- 1.2. Market Segmentation
- 1.3. Research Methodology
- 1.4. Definitions and Assumptions
- 2. Executive Summary
- 2.1. Introduction
- 3. Market Dynamics
- 3.1. Introduction
- 3.2. Market Drivers
- 3.2.1 ; Growing Demand for Real-time Computing; Proliferation of IoT Devices
- 3.2.2 Leading to an Exponential Increase in Data
- 3.3. Market Restrains
- 3.3.1. ; Structural and Security Issues
- 3.4. Market Trends
- 3.4.1. Smart Meter to Witness Higher Growth
- 4. Market Factor Analysis
- 4.1. Porters Five Forces
- 4.2. Supply/Value Chain
- 4.3. PESTEL analysis
- 4.4. Market Entropy
- 4.5. Patent/Trademark Analysis
- 5. Global Fog Networking Market Analysis, Insights and Forecast, 2019-2031
- 5.1. Market Analysis, Insights and Forecast - by Component
- 5.1.1. Hardware
- 5.1.2. Software
- 5.1.3. Service
- 5.2. Market Analysis, Insights and Forecast - by End-user Application
- 5.2.1. Smart Meter
- 5.2.2. Building and Home Automation
- 5.2.3. Smart Manufacturing
- 5.2.4. Connected Healthcare
- 5.2.5. Connected Vehicle
- 5.2.6. Other End-user Applications
- 5.3. Market Analysis, Insights and Forecast - by Region
- 5.3.1. North America
- 5.3.2. Europe
- 5.3.3. Asia Pacific
- 5.3.4. Rest of the World
- 5.1. Market Analysis, Insights and Forecast - by Component
- 6. North America Fog Networking Market Analysis, Insights and Forecast, 2019-2031
- 6.1. Market Analysis, Insights and Forecast - by Component
- 6.1.1. Hardware
- 6.1.2. Software
- 6.1.3. Service
- 6.2. Market Analysis, Insights and Forecast - by End-user Application
- 6.2.1. Smart Meter
- 6.2.2. Building and Home Automation
- 6.2.3. Smart Manufacturing
- 6.2.4. Connected Healthcare
- 6.2.5. Connected Vehicle
- 6.2.6. Other End-user Applications
- 6.1. Market Analysis, Insights and Forecast - by Component
- 7. Europe Fog Networking Market Analysis, Insights and Forecast, 2019-2031
- 7.1. Market Analysis, Insights and Forecast - by Component
- 7.1.1. Hardware
- 7.1.2. Software
- 7.1.3. Service
- 7.2. Market Analysis, Insights and Forecast - by End-user Application
- 7.2.1. Smart Meter
- 7.2.2. Building and Home Automation
- 7.2.3. Smart Manufacturing
- 7.2.4. Connected Healthcare
- 7.2.5. Connected Vehicle
- 7.2.6. Other End-user Applications
- 7.1. Market Analysis, Insights and Forecast - by Component
- 8. Asia Pacific Fog Networking Market Analysis, Insights and Forecast, 2019-2031
- 8.1. Market Analysis, Insights and Forecast - by Component
- 8.1.1. Hardware
- 8.1.2. Software
- 8.1.3. Service
- 8.2. Market Analysis, Insights and Forecast - by End-user Application
- 8.2.1. Smart Meter
- 8.2.2. Building and Home Automation
- 8.2.3. Smart Manufacturing
- 8.2.4. Connected Healthcare
- 8.2.5. Connected Vehicle
- 8.2.6. Other End-user Applications
- 8.1. Market Analysis, Insights and Forecast - by Component
- 9. Rest of the World Fog Networking Market Analysis, Insights and Forecast, 2019-2031
- 9.1. Market Analysis, Insights and Forecast - by Component
- 9.1.1. Hardware
- 9.1.2. Software
- 9.1.3. Service
- 9.2. Market Analysis, Insights and Forecast - by End-user Application
- 9.2.1. Smart Meter
- 9.2.2. Building and Home Automation
- 9.2.3. Smart Manufacturing
- 9.2.4. Connected Healthcare
- 9.2.5. Connected Vehicle
- 9.2.6. Other End-user Applications
- 9.1. Market Analysis, Insights and Forecast - by Component
- 10. North America Fog Networking Market Analysis, Insights and Forecast, 2019-2031
- 10.1. Market Analysis, Insights and Forecast - By Country/Sub-region
- 10.1.1 United States
- 10.1.2 Canada
- 10.1.3 Mexico
- 11. Europe Fog Networking Market Analysis, Insights and Forecast, 2019-2031
- 11.1. Market Analysis, Insights and Forecast - By Country/Sub-region
- 11.1.1 Germany
- 11.1.2 United Kingdom
- 11.1.3 France
- 11.1.4 Spain
- 11.1.5 Italy
- 11.1.6 Spain
- 11.1.7 Belgium
- 11.1.8 Netherland
- 11.1.9 Nordics
- 11.1.10 Rest of Europe
- 12. Asia Pacific Fog Networking Market Analysis, Insights and Forecast, 2019-2031
- 12.1. Market Analysis, Insights and Forecast - By Country/Sub-region
- 12.1.1 China
- 12.1.2 Japan
- 12.1.3 India
- 12.1.4 South Korea
- 12.1.5 Southeast Asia
- 12.1.6 Australia
- 12.1.7 Indonesia
- 12.1.8 Phillipes
- 12.1.9 Singapore
- 12.1.10 Thailandc
- 12.1.11 Rest of Asia Pacific
- 13. South America Fog Networking Market Analysis, Insights and Forecast, 2019-2031
- 13.1. Market Analysis, Insights and Forecast - By Country/Sub-region
- 13.1.1 Brazil
- 13.1.2 Argentina
- 13.1.3 Peru
- 13.1.4 Chile
- 13.1.5 Colombia
- 13.1.6 Ecuador
- 13.1.7 Venezuela
- 13.1.8 Rest of South America
- 14. North America Fog Networking Market Analysis, Insights and Forecast, 2019-2031
- 14.1. Market Analysis, Insights and Forecast - By Country/Sub-region
- 14.1.1 United States
- 14.1.2 Canada
- 14.1.3 Mexico
- 15. MEA Fog Networking Market Analysis, Insights and Forecast, 2019-2031
- 15.1. Market Analysis, Insights and Forecast - By Country/Sub-region
- 15.1.1 United Arab Emirates
- 15.1.2 Saudi Arabia
- 15.1.3 South Africa
- 15.1.4 Rest of Middle East and Africa
- 16. Competitive Analysis
- 16.1. Global Market Share Analysis 2024
- 16.2. Company Profiles
- 16.2.1 Qualcomm Corporation
- 16.2.1.1. Overview
- 16.2.1.2. Products
- 16.2.1.3. SWOT Analysis
- 16.2.1.4. Recent Developments
- 16.2.1.5. Financials (Based on Availability)
- 16.2.2 IBM Corporation
- 16.2.2.1. Overview
- 16.2.2.2. Products
- 16.2.2.3. SWOT Analysis
- 16.2.2.4. Recent Developments
- 16.2.2.5. Financials (Based on Availability)
- 16.2.3 Cisco Systems Inc
- 16.2.3.1. Overview
- 16.2.3.2. Products
- 16.2.3.3. SWOT Analysis
- 16.2.3.4. Recent Developments
- 16.2.3.5. Financials (Based on Availability)
- 16.2.4 Microsoft Corporation
- 16.2.4.1. Overview
- 16.2.4.2. Products
- 16.2.4.3. SWOT Analysis
- 16.2.4.4. Recent Developments
- 16.2.4.5. Financials (Based on Availability)
- 16.2.5 Dell Inc
- 16.2.5.1. Overview
- 16.2.5.2. Products
- 16.2.5.3. SWOT Analysis
- 16.2.5.4. Recent Developments
- 16.2.5.5. Financials (Based on Availability)
- 16.2.6 Amazon Web Services Inc
- 16.2.6.1. Overview
- 16.2.6.2. Products
- 16.2.6.3. SWOT Analysis
- 16.2.6.4. Recent Developments
- 16.2.6.5. Financials (Based on Availability)
- 16.2.7 Tata Consultancy Services Limited
- 16.2.7.1. Overview
- 16.2.7.2. Products
- 16.2.7.3. SWOT Analysis
- 16.2.7.4. Recent Developments
- 16.2.7.5. Financials (Based on Availability)
- 16.2.8 Nokia Corporation
- 16.2.8.1. Overview
- 16.2.8.2. Products
- 16.2.8.3. SWOT Analysis
- 16.2.8.4. Recent Developments
- 16.2.8.5. Financials (Based on Availability)
- 16.2.9 Nebbiolo Technologies
- 16.2.9.1. Overview
- 16.2.9.2. Products
- 16.2.9.3. SWOT Analysis
- 16.2.9.4. Recent Developments
- 16.2.9.5. Financials (Based on Availability)
- 16.2.10 Intel Corporation
- 16.2.10.1. Overview
- 16.2.10.2. Products
- 16.2.10.3. SWOT Analysis
- 16.2.10.4. Recent Developments
- 16.2.10.5. Financials (Based on Availability)
- 16.2.1 Qualcomm Corporation
List of Figures
- Figure 1: Global Fog Networking Market Revenue Breakdown (Million, %) by Region 2024 & 2032
- Figure 2: Global Fog Networking Market Volume Breakdown (K Unit, %) by Region 2024 & 2032
- Figure 3: North America Fog Networking Market Revenue (Million), by Country 2024 & 2032
- Figure 4: North America Fog Networking Market Volume (K Unit), by Country 2024 & 2032
- Figure 5: North America Fog Networking Market Revenue Share (%), by Country 2024 & 2032
- Figure 6: North America Fog Networking Market Volume Share (%), by Country 2024 & 2032
- Figure 7: Europe Fog Networking Market Revenue (Million), by Country 2024 & 2032
- Figure 8: Europe Fog Networking Market Volume (K Unit), by Country 2024 & 2032
- Figure 9: Europe Fog Networking Market Revenue Share (%), by Country 2024 & 2032
- Figure 10: Europe Fog Networking Market Volume Share (%), by Country 2024 & 2032
- Figure 11: Asia Pacific Fog Networking Market Revenue (Million), by Country 2024 & 2032
- Figure 12: Asia Pacific Fog Networking Market Volume (K Unit), by Country 2024 & 2032
- Figure 13: Asia Pacific Fog Networking Market Revenue Share (%), by Country 2024 & 2032
- Figure 14: Asia Pacific Fog Networking Market Volume Share (%), by Country 2024 & 2032
- Figure 15: South America Fog Networking Market Revenue (Million), by Country 2024 & 2032
- Figure 16: South America Fog Networking Market Volume (K Unit), by Country 2024 & 2032
- Figure 17: South America Fog Networking Market Revenue Share (%), by Country 2024 & 2032
- Figure 18: South America Fog Networking Market Volume Share (%), by Country 2024 & 2032
- Figure 19: North America Fog Networking Market Revenue (Million), by Country 2024 & 2032
- Figure 20: North America Fog Networking Market Volume (K Unit), by Country 2024 & 2032
- Figure 21: North America Fog Networking Market Revenue Share (%), by Country 2024 & 2032
- Figure 22: North America Fog Networking Market Volume Share (%), by Country 2024 & 2032
- Figure 23: MEA Fog Networking Market Revenue (Million), by Country 2024 & 2032
- Figure 24: MEA Fog Networking Market Volume (K Unit), by Country 2024 & 2032
- Figure 25: MEA Fog Networking Market Revenue Share (%), by Country 2024 & 2032
- Figure 26: MEA Fog Networking Market Volume Share (%), by Country 2024 & 2032
- Figure 27: North America Fog Networking Market Revenue (Million), by Component 2024 & 2032
- Figure 28: North America Fog Networking Market Volume (K Unit), by Component 2024 & 2032
- Figure 29: North America Fog Networking Market Revenue Share (%), by Component 2024 & 2032
- Figure 30: North America Fog Networking Market Volume Share (%), by Component 2024 & 2032
- Figure 31: North America Fog Networking Market Revenue (Million), by End-user Application 2024 & 2032
- Figure 32: North America Fog Networking Market Volume (K Unit), by End-user Application 2024 & 2032
- Figure 33: North America Fog Networking Market Revenue Share (%), by End-user Application 2024 & 2032
- Figure 34: North America Fog Networking Market Volume Share (%), by End-user Application 2024 & 2032
- Figure 35: North America Fog Networking Market Revenue (Million), by Country 2024 & 2032
- Figure 36: North America Fog Networking Market Volume (K Unit), by Country 2024 & 2032
- Figure 37: North America Fog Networking Market Revenue Share (%), by Country 2024 & 2032
- Figure 38: North America Fog Networking Market Volume Share (%), by Country 2024 & 2032
- Figure 39: Europe Fog Networking Market Revenue (Million), by Component 2024 & 2032
- Figure 40: Europe Fog Networking Market Volume (K Unit), by Component 2024 & 2032
- Figure 41: Europe Fog Networking Market Revenue Share (%), by Component 2024 & 2032
- Figure 42: Europe Fog Networking Market Volume Share (%), by Component 2024 & 2032
- Figure 43: Europe Fog Networking Market Revenue (Million), by End-user Application 2024 & 2032
- Figure 44: Europe Fog Networking Market Volume (K Unit), by End-user Application 2024 & 2032
- Figure 45: Europe Fog Networking Market Revenue Share (%), by End-user Application 2024 & 2032
- Figure 46: Europe Fog Networking Market Volume Share (%), by End-user Application 2024 & 2032
- Figure 47: Europe Fog Networking Market Revenue (Million), by Country 2024 & 2032
- Figure 48: Europe Fog Networking Market Volume (K Unit), by Country 2024 & 2032
- Figure 49: Europe Fog Networking Market Revenue Share (%), by Country 2024 & 2032
- Figure 50: Europe Fog Networking Market Volume Share (%), by Country 2024 & 2032
- Figure 51: Asia Pacific Fog Networking Market Revenue (Million), by Component 2024 & 2032
- Figure 52: Asia Pacific Fog Networking Market Volume (K Unit), by Component 2024 & 2032
- Figure 53: Asia Pacific Fog Networking Market Revenue Share (%), by Component 2024 & 2032
- Figure 54: Asia Pacific Fog Networking Market Volume Share (%), by Component 2024 & 2032
- Figure 55: Asia Pacific Fog Networking Market Revenue (Million), by End-user Application 2024 & 2032
- Figure 56: Asia Pacific Fog Networking Market Volume (K Unit), by End-user Application 2024 & 2032
- Figure 57: Asia Pacific Fog Networking Market Revenue Share (%), by End-user Application 2024 & 2032
- Figure 58: Asia Pacific Fog Networking Market Volume Share (%), by End-user Application 2024 & 2032
- Figure 59: Asia Pacific Fog Networking Market Revenue (Million), by Country 2024 & 2032
- Figure 60: Asia Pacific Fog Networking Market Volume (K Unit), by Country 2024 & 2032
- Figure 61: Asia Pacific Fog Networking Market Revenue Share (%), by Country 2024 & 2032
- Figure 62: Asia Pacific Fog Networking Market Volume Share (%), by Country 2024 & 2032
- Figure 63: Rest of the World Fog Networking Market Revenue (Million), by Component 2024 & 2032
- Figure 64: Rest of the World Fog Networking Market Volume (K Unit), by Component 2024 & 2032
- Figure 65: Rest of the World Fog Networking Market Revenue Share (%), by Component 2024 & 2032
- Figure 66: Rest of the World Fog Networking Market Volume Share (%), by Component 2024 & 2032
- Figure 67: Rest of the World Fog Networking Market Revenue (Million), by End-user Application 2024 & 2032
- Figure 68: Rest of the World Fog Networking Market Volume (K Unit), by End-user Application 2024 & 2032
- Figure 69: Rest of the World Fog Networking Market Revenue Share (%), by End-user Application 2024 & 2032
- Figure 70: Rest of the World Fog Networking Market Volume Share (%), by End-user Application 2024 & 2032
- Figure 71: Rest of the World Fog Networking Market Revenue (Million), by Country 2024 & 2032
- Figure 72: Rest of the World Fog Networking Market Volume (K Unit), by Country 2024 & 2032
- Figure 73: Rest of the World Fog Networking Market Revenue Share (%), by Country 2024 & 2032
- Figure 74: Rest of the World Fog Networking Market Volume Share (%), by Country 2024 & 2032
List of Tables
- Table 1: Global Fog Networking Market Revenue Million Forecast, by Region 2019 & 2032
- Table 2: Global Fog Networking Market Volume K Unit Forecast, by Region 2019 & 2032
- Table 3: Global Fog Networking Market Revenue Million Forecast, by Component 2019 & 2032
- Table 4: Global Fog Networking Market Volume K Unit Forecast, by Component 2019 & 2032
- Table 5: Global Fog Networking Market Revenue Million Forecast, by End-user Application 2019 & 2032
- Table 6: Global Fog Networking Market Volume K Unit Forecast, by End-user Application 2019 & 2032
- Table 7: Global Fog Networking Market Revenue Million Forecast, by Region 2019 & 2032
- Table 8: Global Fog Networking Market Volume K Unit Forecast, by Region 2019 & 2032
- Table 9: Global Fog Networking Market Revenue Million Forecast, by Country 2019 & 2032
- Table 10: Global Fog Networking Market Volume K Unit Forecast, by Country 2019 & 2032
- Table 11: United States Fog Networking Market Revenue (Million) Forecast, by Application 2019 & 2032
- Table 12: United States Fog Networking Market Volume (K Unit) Forecast, by Application 2019 & 2032
- Table 13: Canada Fog Networking Market Revenue (Million) Forecast, by Application 2019 & 2032
- Table 14: Canada Fog Networking Market Volume (K Unit) Forecast, by Application 2019 & 2032
- Table 15: Mexico Fog Networking Market Revenue (Million) Forecast, by Application 2019 & 2032
- Table 16: Mexico Fog Networking Market Volume (K Unit) Forecast, by Application 2019 & 2032
- Table 17: Global Fog Networking Market Revenue Million Forecast, by Country 2019 & 2032
- Table 18: Global Fog Networking Market Volume K Unit Forecast, by Country 2019 & 2032
- Table 19: Germany Fog Networking Market Revenue (Million) Forecast, by Application 2019 & 2032
- Table 20: Germany Fog Networking Market Volume (K Unit) Forecast, by Application 2019 & 2032
- Table 21: United Kingdom Fog Networking Market Revenue (Million) Forecast, by Application 2019 & 2032
- Table 22: United Kingdom Fog Networking Market Volume (K Unit) Forecast, by Application 2019 & 2032
- Table 23: France Fog Networking Market Revenue (Million) Forecast, by Application 2019 & 2032
- Table 24: France Fog Networking Market Volume (K Unit) Forecast, by Application 2019 & 2032
- Table 25: Spain Fog Networking Market Revenue (Million) Forecast, by Application 2019 & 2032
- Table 26: Spain Fog Networking Market Volume (K Unit) Forecast, by Application 2019 & 2032
- Table 27: Italy Fog Networking Market Revenue (Million) Forecast, by Application 2019 & 2032
- Table 28: Italy Fog Networking Market Volume (K Unit) Forecast, by Application 2019 & 2032
- Table 29: Spain Fog Networking Market Revenue (Million) Forecast, by Application 2019 & 2032
- Table 30: Spain Fog Networking Market Volume (K Unit) Forecast, by Application 2019 & 2032
- Table 31: Belgium Fog Networking Market Revenue (Million) Forecast, by Application 2019 & 2032
- Table 32: Belgium Fog Networking Market Volume (K Unit) Forecast, by Application 2019 & 2032
- Table 33: Netherland Fog Networking Market Revenue (Million) Forecast, by Application 2019 & 2032
- Table 34: Netherland Fog Networking Market Volume (K Unit) Forecast, by Application 2019 & 2032
- Table 35: Nordics Fog Networking Market Revenue (Million) Forecast, by Application 2019 & 2032
- Table 36: Nordics Fog Networking Market Volume (K Unit) Forecast, by Application 2019 & 2032
- Table 37: Rest of Europe Fog Networking Market Revenue (Million) Forecast, by Application 2019 & 2032
- Table 38: Rest of Europe Fog Networking Market Volume (K Unit) Forecast, by Application 2019 & 2032
- Table 39: Global Fog Networking Market Revenue Million Forecast, by Country 2019 & 2032
- Table 40: Global Fog Networking Market Volume K Unit Forecast, by Country 2019 & 2032
- Table 41: China Fog Networking Market Revenue (Million) Forecast, by Application 2019 & 2032
- Table 42: China Fog Networking Market Volume (K Unit) Forecast, by Application 2019 & 2032
- Table 43: Japan Fog Networking Market Revenue (Million) Forecast, by Application 2019 & 2032
- Table 44: Japan Fog Networking Market Volume (K Unit) Forecast, by Application 2019 & 2032
- Table 45: India Fog Networking Market Revenue (Million) Forecast, by Application 2019 & 2032
- Table 46: India Fog Networking Market Volume (K Unit) Forecast, by Application 2019 & 2032
- Table 47: South Korea Fog Networking Market Revenue (Million) Forecast, by Application 2019 & 2032
- Table 48: South Korea Fog Networking Market Volume (K Unit) Forecast, by Application 2019 & 2032
- Table 49: Southeast Asia Fog Networking Market Revenue (Million) Forecast, by Application 2019 & 2032
- Table 50: Southeast Asia Fog Networking Market Volume (K Unit) Forecast, by Application 2019 & 2032
- Table 51: Australia Fog Networking Market Revenue (Million) Forecast, by Application 2019 & 2032
- Table 52: Australia Fog Networking Market Volume (K Unit) Forecast, by Application 2019 & 2032
- Table 53: Indonesia Fog Networking Market Revenue (Million) Forecast, by Application 2019 & 2032
- Table 54: Indonesia Fog Networking Market Volume (K Unit) Forecast, by Application 2019 & 2032
- Table 55: Phillipes Fog Networking Market Revenue (Million) Forecast, by Application 2019 & 2032
- Table 56: Phillipes Fog Networking Market Volume (K Unit) Forecast, by Application 2019 & 2032
- Table 57: Singapore Fog Networking Market Revenue (Million) Forecast, by Application 2019 & 2032
- Table 58: Singapore Fog Networking Market Volume (K Unit) Forecast, by Application 2019 & 2032
- Table 59: Thailandc Fog Networking Market Revenue (Million) Forecast, by Application 2019 & 2032
- Table 60: Thailandc Fog Networking Market Volume (K Unit) Forecast, by Application 2019 & 2032
- Table 61: Rest of Asia Pacific Fog Networking Market Revenue (Million) Forecast, by Application 2019 & 2032
- Table 62: Rest of Asia Pacific Fog Networking Market Volume (K Unit) Forecast, by Application 2019 & 2032
- Table 63: Global Fog Networking Market Revenue Million Forecast, by Country 2019 & 2032
- Table 64: Global Fog Networking Market Volume K Unit Forecast, by Country 2019 & 2032
- Table 65: Brazil Fog Networking Market Revenue (Million) Forecast, by Application 2019 & 2032
- Table 66: Brazil Fog Networking Market Volume (K Unit) Forecast, by Application 2019 & 2032
- Table 67: Argentina Fog Networking Market Revenue (Million) Forecast, by Application 2019 & 2032
- Table 68: Argentina Fog Networking Market Volume (K Unit) Forecast, by Application 2019 & 2032
- Table 69: Peru Fog Networking Market Revenue (Million) Forecast, by Application 2019 & 2032
- Table 70: Peru Fog Networking Market Volume (K Unit) Forecast, by Application 2019 & 2032
- Table 71: Chile Fog Networking Market Revenue (Million) Forecast, by Application 2019 & 2032
- Table 72: Chile Fog Networking Market Volume (K Unit) Forecast, by Application 2019 & 2032
- Table 73: Colombia Fog Networking Market Revenue (Million) Forecast, by Application 2019 & 2032
- Table 74: Colombia Fog Networking Market Volume (K Unit) Forecast, by Application 2019 & 2032
- Table 75: Ecuador Fog Networking Market Revenue (Million) Forecast, by Application 2019 & 2032
- Table 76: Ecuador Fog Networking Market Volume (K Unit) Forecast, by Application 2019 & 2032
- Table 77: Venezuela Fog Networking Market Revenue (Million) Forecast, by Application 2019 & 2032
- Table 78: Venezuela Fog Networking Market Volume (K Unit) Forecast, by Application 2019 & 2032
- Table 79: Rest of South America Fog Networking Market Revenue (Million) Forecast, by Application 2019 & 2032
- Table 80: Rest of South America Fog Networking Market Volume (K Unit) Forecast, by Application 2019 & 2032
- Table 81: Global Fog Networking Market Revenue Million Forecast, by Country 2019 & 2032
- Table 82: Global Fog Networking Market Volume K Unit Forecast, by Country 2019 & 2032
- Table 83: United States Fog Networking Market Revenue (Million) Forecast, by Application 2019 & 2032
- Table 84: United States Fog Networking Market Volume (K Unit) Forecast, by Application 2019 & 2032
- Table 85: Canada Fog Networking Market Revenue (Million) Forecast, by Application 2019 & 2032
- Table 86: Canada Fog Networking Market Volume (K Unit) Forecast, by Application 2019 & 2032
- Table 87: Mexico Fog Networking Market Revenue (Million) Forecast, by Application 2019 & 2032
- Table 88: Mexico Fog Networking Market Volume (K Unit) Forecast, by Application 2019 & 2032
- Table 89: Global Fog Networking Market Revenue Million Forecast, by Country 2019 & 2032
- Table 90: Global Fog Networking Market Volume K Unit Forecast, by Country 2019 & 2032
- Table 91: United Arab Emirates Fog Networking Market Revenue (Million) Forecast, by Application 2019 & 2032
- Table 92: United Arab Emirates Fog Networking Market Volume (K Unit) Forecast, by Application 2019 & 2032
- Table 93: Saudi Arabia Fog Networking Market Revenue (Million) Forecast, by Application 2019 & 2032
- Table 94: Saudi Arabia Fog Networking Market Volume (K Unit) Forecast, by Application 2019 & 2032
- Table 95: South Africa Fog Networking Market Revenue (Million) Forecast, by Application 2019 & 2032
- Table 96: South Africa Fog Networking Market Volume (K Unit) Forecast, by Application 2019 & 2032
- Table 97: Rest of Middle East and Africa Fog Networking Market Revenue (Million) Forecast, by Application 2019 & 2032
- Table 98: Rest of Middle East and Africa Fog Networking Market Volume (K Unit) Forecast, by Application 2019 & 2032
- Table 99: Global Fog Networking Market Revenue Million Forecast, by Component 2019 & 2032
- Table 100: Global Fog Networking Market Volume K Unit Forecast, by Component 2019 & 2032
- Table 101: Global Fog Networking Market Revenue Million Forecast, by End-user Application 2019 & 2032
- Table 102: Global Fog Networking Market Volume K Unit Forecast, by End-user Application 2019 & 2032
- Table 103: Global Fog Networking Market Revenue Million Forecast, by Country 2019 & 2032
- Table 104: Global Fog Networking Market Volume K Unit Forecast, by Country 2019 & 2032
- Table 105: Global Fog Networking Market Revenue Million Forecast, by Component 2019 & 2032
- Table 106: Global Fog Networking Market Volume K Unit Forecast, by Component 2019 & 2032
- Table 107: Global Fog Networking Market Revenue Million Forecast, by End-user Application 2019 & 2032
- Table 108: Global Fog Networking Market Volume K Unit Forecast, by End-user Application 2019 & 2032
- Table 109: Global Fog Networking Market Revenue Million Forecast, by Country 2019 & 2032
- Table 110: Global Fog Networking Market Volume K Unit Forecast, by Country 2019 & 2032
- Table 111: Global Fog Networking Market Revenue Million Forecast, by Component 2019 & 2032
- Table 112: Global Fog Networking Market Volume K Unit Forecast, by Component 2019 & 2032
- Table 113: Global Fog Networking Market Revenue Million Forecast, by End-user Application 2019 & 2032
- Table 114: Global Fog Networking Market Volume K Unit Forecast, by End-user Application 2019 & 2032
- Table 115: Global Fog Networking Market Revenue Million Forecast, by Country 2019 & 2032
- Table 116: Global Fog Networking Market Volume K Unit Forecast, by Country 2019 & 2032
- Table 117: Global Fog Networking Market Revenue Million Forecast, by Component 2019 & 2032
- Table 118: Global Fog Networking Market Volume K Unit Forecast, by Component 2019 & 2032
- Table 119: Global Fog Networking Market Revenue Million Forecast, by End-user Application 2019 & 2032
- Table 120: Global Fog Networking Market Volume K Unit Forecast, by End-user Application 2019 & 2032
- Table 121: Global Fog Networking Market Revenue Million Forecast, by Country 2019 & 2032
- Table 122: Global Fog Networking Market Volume K Unit Forecast, by Country 2019 & 2032
Frequently Asked Questions
1. What is the projected Compound Annual Growth Rate (CAGR) of the Fog Networking Market?
The projected CAGR is approximately 14.75%.
2. Which companies are prominent players in the Fog Networking Market?
Key companies in the market include Qualcomm Corporation, IBM Corporation, Cisco Systems Inc, Microsoft Corporation, Dell Inc, Amazon Web Services Inc, Tata Consultancy Services Limited, Nokia Corporation, Nebbiolo Technologies, Intel Corporation.
3. What are the main segments of the Fog Networking Market?
The market segments include Component, End-user Application.
4. Can you provide details about the market size?
The market size is estimated to be USD 1.90 Million as of 2022.
5. What are some drivers contributing to market growth?
; Growing Demand for Real-time Computing; Proliferation of IoT Devices. Leading to an Exponential Increase in Data.
6. What are the notable trends driving market growth?
Smart Meter to Witness Higher Growth.
7. Are there any restraints impacting market growth?
; Structural and Security Issues.
8. Can you provide examples of recent developments in the market?
N/A
9. What pricing options are available for accessing the report?
Pricing options include single-user, multi-user, and enterprise licenses priced at USD 4750, USD 5250, and USD 8750 respectively.
10. Is the market size provided in terms of value or volume?
The market size is provided in terms of value, measured in Million and volume, measured in K Unit.
11. Are there any specific market keywords associated with the report?
Yes, the market keyword associated with the report is "Fog Networking Market," which aids in identifying and referencing the specific market segment covered.
12. How do I determine which pricing option suits my needs best?
The pricing options vary based on user requirements and access needs. Individual users may opt for single-user licenses, while businesses requiring broader access may choose multi-user or enterprise licenses for cost-effective access to the report.
13. Are there any additional resources or data provided in the Fog Networking Market report?
While the report offers comprehensive insights, it's advisable to review the specific contents or supplementary materials provided to ascertain if additional resources or data are available.
14. How can I stay updated on further developments or reports in the Fog Networking Market?
To stay informed about further developments, trends, and reports in the Fog Networking Market, consider subscribing to industry newsletters, following relevant companies and organizations, or regularly checking reputable industry news sources and publications.
Methodology
Step 1 - Identification of Relevant Samples Size from Population Database


Step 2 - Approaches for Defining Global Market Size (Value, Volume* & Price*)

Note*: In applicable scenarios
Step 3 - Data Sources
Primary Research
- Web Analytics
- Survey Reports
- Research Institute
- Latest Research Reports
- Opinion Leaders
Secondary Research
- Annual Reports
- White Paper
- Latest Press Release
- Industry Association
- Paid Database
- Investor Presentations

Step 4 - Data Triangulation
Involves using different sources of information in order to increase the validity of a study
These sources are likely to be stakeholders in a program - participants, other researchers, program staff, other community members, and so on.
Then we put all data in single framework & apply various statistical tools to find out the dynamic on the market.
During the analysis stage, feedback from the stakeholder groups would be compared to determine areas of agreement as well as areas of divergence


