
Key Insights
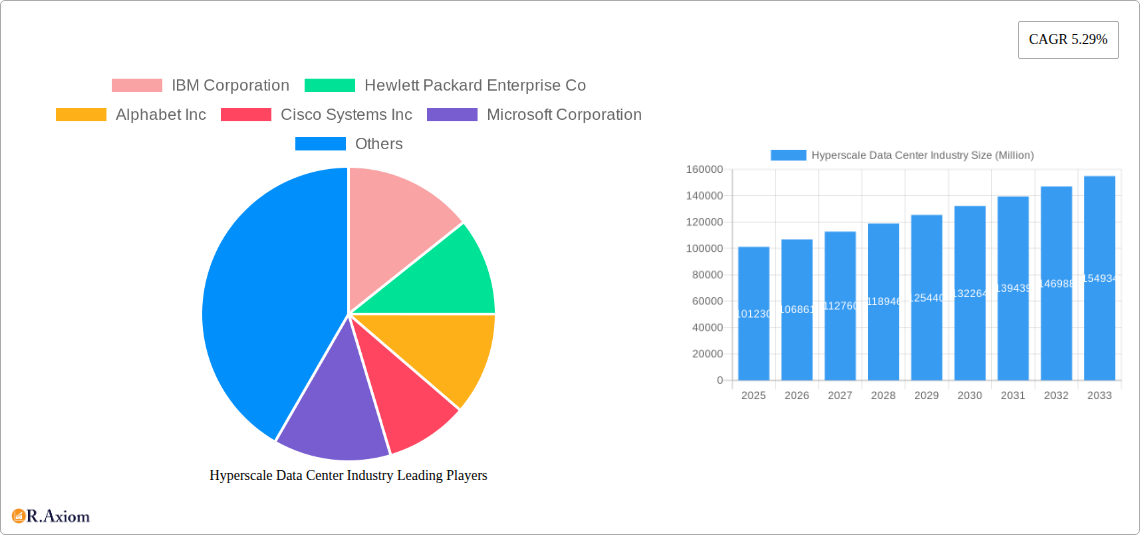
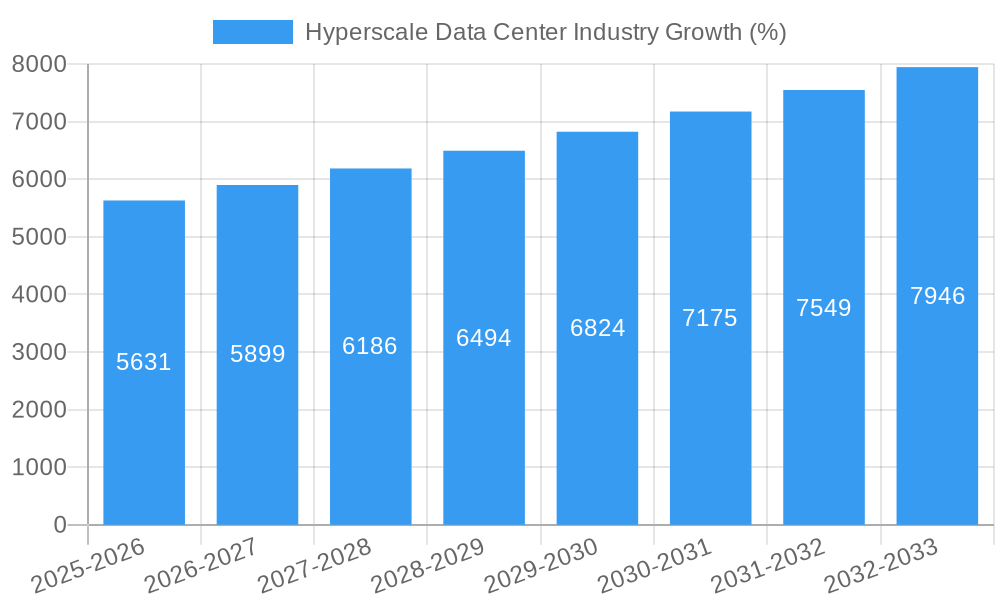
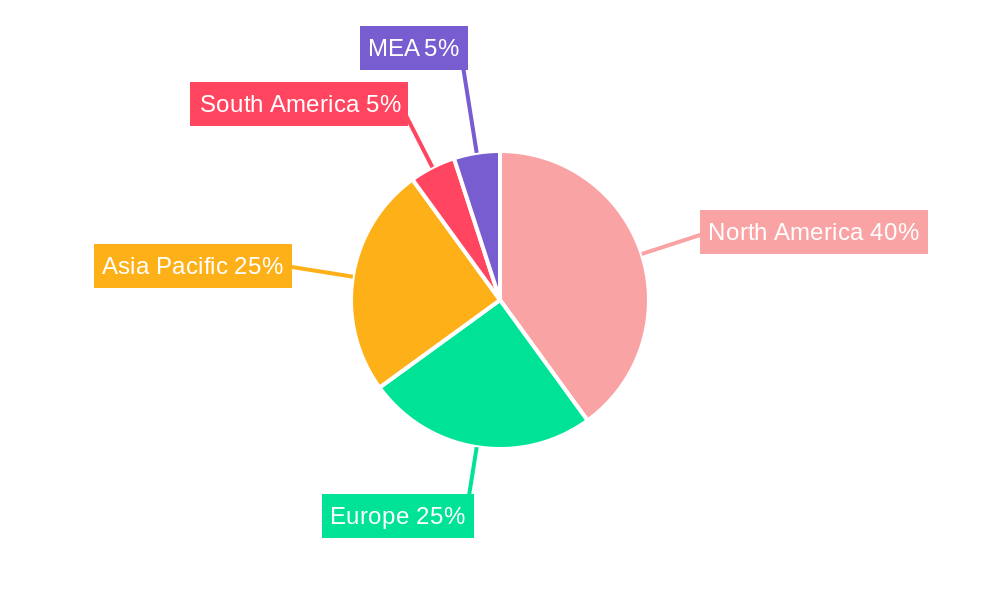
The hyperscale data center market, valued at $101.23 billion in 2025, is experiencing robust growth, projected to expand at a compound annual growth rate (CAGR) of 5.29% from 2025 to 2033. This expansion is driven by several key factors. The increasing adoption of cloud computing and digital transformation initiatives across enterprises and colocation providers fuels the demand for massive data storage and processing capabilities offered by hyperscale data centers. Furthermore, the proliferation of big data analytics, artificial intelligence (AI), and the Internet of Things (IoT) necessitates substantial infrastructure upgrades, directly contributing to market growth. Geographic expansion, particularly in rapidly developing economies in Asia-Pacific and South America, further fuels the demand. While the high capital expenditure required for building and maintaining these facilities presents a restraint, the long-term returns and strategic importance of robust digital infrastructure are outweighing these initial costs for major players. Competition among leading technology companies like IBM, Hewlett Packard Enterprise, Amazon Web Services, and Microsoft is intensifying, driving innovation and efficiency improvements within the sector. North America currently holds a significant market share due to the presence of major technology companies and advanced infrastructure, but Asia-Pacific is projected to witness the fastest growth rate in the coming years due to its expanding digital economy.
The competitive landscape is marked by both established technology giants and emerging players striving for market dominance. The market segmentation, by both geography and end-user, reveals significant opportunities. North America and Asia-Pacific represent the largest regional markets, while enterprises and colocation providers are the primary end-users. However, the growing adoption of edge computing is expected to create new segments and opportunities for specialized data center solutions in the future. Continued investment in renewable energy sources to power these facilities and address sustainability concerns will be crucial for long-term market success. The ongoing development of advanced cooling technologies and improved energy efficiency standards will also play a significant role in shaping the industry's trajectory.
Hyperscale Data Center Industry Market Report: 2019-2033
This comprehensive report provides an in-depth analysis of the hyperscale data center industry, covering market size, growth drivers, competitive landscape, and future outlook from 2019 to 2033. The report leverages extensive market research and data analysis to offer actionable insights for industry stakeholders, including investors, vendors, and technology providers. With a focus on key segments and geographical markets, this report is an indispensable resource for navigating the complexities of this rapidly evolving sector.
Hyperscale Data Center Industry Market Concentration & Innovation
The hyperscale data center market exhibits a high degree of concentration, with a handful of dominant players commanding significant market share. While precise market share figures fluctuate, companies like Amazon Web Services (AWS), Microsoft Azure, and Google Cloud Platform (GCP) hold leading positions, collectively accounting for a substantial portion (estimated xx%) of the global market. This concentration reflects the significant capital investment and technological expertise required to build and operate hyperscale facilities. However, competition remains intense, driven by continuous innovation in areas such as energy efficiency, server technology, and network infrastructure.
Innovation is a critical driver in this market, fostering the adoption of cutting-edge technologies. These include advancements in artificial intelligence (AI), machine learning (ML), and edge computing, which are significantly increasing demand for hyperscale data center capacity. Regulatory frameworks, particularly concerning data privacy and security, play a considerable role, influencing investment decisions and operational practices. Product substitutes, while limited in direct comparison, include on-premise data centers and cloud services from smaller providers. However, the scalability, cost-effectiveness, and advanced features of hyperscale facilities generally provide a competitive advantage. Mergers and acquisitions (M&A) activity is also prevalent, with deal values reaching into the billions of USD. Recent notable M&A activities have involved consolidations within the colocation sector and strategic acquisitions to expand geographic reach and service offerings.
- Market Share: AWS, Microsoft Azure, and Google Cloud Platform collectively hold an estimated xx% market share in 2025.
- M&A Deal Values: Significant M&A deals have exceeded USD 1 Billion in recent years, reflecting the high valuation of key players and assets.
Hyperscale Data Center Industry Industry Trends & Insights
The hyperscale data center market is experiencing robust growth, driven by several key factors. The exponential rise of data generated from various sources, including the Internet of Things (IoT), big data analytics, and cloud computing, fuels the demand for massive data storage and processing capabilities. Technological disruptions, such as the increasing adoption of 5G networks and advancements in AI/ML, further intensify this demand. Consumer preferences are shifting towards cloud-based services and digital experiences, requiring robust and scalable data center infrastructure.
Competitive dynamics are shaped by continuous innovation, strategic alliances, and geographical expansion. The market exhibits a high barrier to entry due to the significant capital investments needed. This results in an oligopolistic structure, where a few major players dominate, although the emergence of niche players focusing on specific regions or verticals is creating some diversity.
The Compound Annual Growth Rate (CAGR) for the hyperscale data center market is projected to be xx% during the forecast period (2025-2033). Market penetration is expected to increase significantly, driven by the growing adoption of cloud services and digital transformation initiatives across various industries.
Dominant Markets & Segments in Hyperscale Data Center Industry
The United States remains the dominant market for hyperscale data centers, driven by a strong technological ecosystem, substantial investment capital, and a high concentration of major technology companies. However, other regions are also experiencing rapid growth. China is emerging as a significant player, fueled by its large and expanding digital economy. Other key markets include Canada, Japan, Australia, the United Kingdom, and Germany.
- Key Drivers for the United States: Abundant capital, strong technological expertise, established infrastructure, and regulatory environment conducive to innovation.
- Key Drivers for China: Rapid growth of the digital economy, increasing government investment in infrastructure, and the presence of large domestic technology companies.
- Key Drivers for Other Markets: Growing digital adoption, government initiatives to improve infrastructure, and increasing demand from global technology firms.
The Enterprises segment is a major end-user, driving demand for private cloud deployments and customized solutions. Colocation Providers are also a significant segment, offering data center space and services to various clients, including enterprises and cloud providers. Both segments are expected to show strong growth throughout the forecast period.
Hyperscale Data Center Industry Product Developments
Recent product innovations include advancements in liquid cooling, AI-powered management systems, and edge data center solutions. These innovations aim to improve energy efficiency, enhance operational efficiency, and reduce latency. The competitive advantage lies in offering superior scalability, reliability, security, and cost-effectiveness. The market is constantly evolving, with new technologies and features continuously being introduced to meet the ever-increasing demands of data-intensive applications.
Report Scope & Segmentation Analysis
This report segments the hyperscale data center market by country (United States, Canada, China, Japan, Australia, United Kingdom, Germany, Other Countries) and by end-user (Enterprises, Colocation Providers). Growth projections for each segment are provided based on historical data and future market trends. Market sizes are estimated for each segment, considering various factors such as market dynamics and technological advancements. Competitive dynamics within each segment are also analyzed, focusing on the key players and their market strategies.
Each geographic segment presents unique opportunities and challenges, influenced by factors like regulatory environments, infrastructure development, and economic growth. Similarly, the end-user segments differ in their specific needs and preferences, driving the development of tailored solutions and services.
Key Drivers of Hyperscale Data Center Industry Growth
Several key factors drive the growth of the hyperscale data center industry:
- Technological Advancements: Continuous innovation in areas such as AI, ML, and 5G networks fuels demand for advanced data center infrastructure.
- Economic Growth: Expansion of the global digital economy and increasing adoption of cloud services drive the need for greater data storage and processing capacity.
- Regulatory Factors: Government initiatives promoting digital transformation and investments in infrastructure create favorable market conditions.
Challenges in the Hyperscale Data Center Industry Sector
The hyperscale data center industry faces significant challenges, including:
- Regulatory Hurdles: Data privacy regulations and compliance requirements pose challenges to operations and expansion.
- Supply Chain Issues: Global supply chain disruptions can impact the availability of critical components and resources.
- Competitive Pressures: Intense competition from established players and new entrants puts pressure on pricing and profitability. This competition is also amplified by the high capital expenditure required to operate in this space.
Emerging Opportunities in Hyperscale Data Center Industry
Emerging opportunities in the hyperscale data center industry include:
- Edge Computing: Growing demand for low-latency applications drives the development of edge data centers.
- Sustainable Data Centers: Increased focus on energy efficiency and environmental sustainability creates opportunities for innovative solutions.
- New Geographic Markets: Expansion into developing economies with growing digital adoption offers significant potential.
Leading Players in the Hyperscale Data Center Industry Market
- IBM Corporation
- Hewlett Packard Enterprise Co
- Alphabet Inc
- Cisco Systems Inc
- Microsoft Corporation
- Amazon Web Services Inc
- Huawei Technologies Co
- Quanta Computer Inc
- Alibaba Group
- Facebook Inc
- Nvidia Corporation
Key Developments in Hyperscale Data Center Industry Industry
- November 2022: Big Data Exchange (BDx), PT Indosat Tbk, and PT Aplikanusa Lintasarta announced plans for a 100MW data center complex in Indonesia (CGK5), representing a USD 1 Billion+ investment and BDx's 11th Asia-Pacific data center.
- June 2022: Equinix Inc. and PGIM Real Estate opened the SY9x xScale data center in Sydney, Australia, a USD 575 Million joint venture.
- May 2022: NTT Ltd. launched a new hyperscale data center (NAV1A) in Navi Mumbai, India, expanding its Indian presence to 12 facilities with over 2.5 Million sq ft and 220 MW capacity.
- March 2022: Yondr Group announced a planned 200MW hyperscale campus in Malaysia, a significant expansion into the Southeast Asian market.
Strategic Outlook for Hyperscale Data Center Industry Market
The hyperscale data center market is poised for sustained growth, driven by the continued expansion of the digital economy and the increasing reliance on cloud-based services. Future opportunities lie in the development of sustainable and efficient data centers, the expansion into new geographic markets, and the adoption of cutting-edge technologies like AI and edge computing. The market's future will be shaped by continuous technological innovation, strategic partnerships, and the ongoing need for scalable and reliable data center infrastructure. The increasing focus on sustainability and the potential for further consolidation through M&A activity will continue to drive significant change and growth in the coming decade.
Hyperscale Data Center Industry Segmentation
-
1. Data Center Type
- 1.1. Hyperscale Self-Build
- 1.2. Hyperscale Colocation
Hyperscale Data Center Industry Segmentation By Geography
-
1. North America
- 1.1. US
- 1.2. Canada
- 1.3. Rest of North America
-
2. Europe
- 2.1. Germany
- 2.2. UK
- 2.3. France
- 2.4. Netherlands
- 2.5. Ireland
- 2.6. Spain
- 2.7. Italy
- 2.8. Rest of Europe
-
3. Asia Pacific
- 3.1. India
- 3.2. China
- 3.3. Japan
- 3.4. Singapore
- 3.5. Australia
- 3.6. Indonesia
- 3.7. Malaysia
- 3.8. Thailand
- 3.9. Rest of Asia Pacific
-
4. South America
- 4.1. Brazil
- 4.2. Chile
- 4.3. Rest of South America
-
5. Middle East
- 5.1. United Arab Emirates
- 5.2. Saudi Arabia
- 5.3. Rest of Middle East
Hyperscale Data Center Industry REPORT HIGHLIGHTS
| Aspects | Details |
|---|---|
| Study Period | 2019-2033 |
| Base Year | 2024 |
| Estimated Year | 2025 |
| Forecast Period | 2025-2033 |
| Historical Period | 2019-2024 |
| Growth Rate | CAGR of 5.29% from 2019-2033 |
| Segmentation |
|
Table of Contents
- 1. Introduction
- 1.1. Research Scope
- 1.2. Market Segmentation
- 1.3. Research Methodology
- 1.4. Definitions and Assumptions
- 2. Executive Summary
- 2.1. Introduction
- 3. Market Dynamics
- 3.1. Introduction
- 3.2. Market Drivers
- 3.2.1. Growing Demand for Cloud Computing and Other High Performance Technologies
- 3.3. Market Restrains
- 3.3.1. High Costs and Operational Concerns; Concerns related to Geoprivacy and Confidential Data
- 3.4. Market Trends
- 3.4.1. Growing Demand for Cloud Computing and Other Hight Performance Technologies Driving the Market
- 4. Market Factor Analysis
- 4.1. Porters Five Forces
- 4.2. Supply/Value Chain
- 4.3. PESTEL analysis
- 4.4. Market Entropy
- 4.5. Patent/Trademark Analysis
- 5. Global Hyperscale Data Center Industry Analysis, Insights and Forecast, 2019-2031
- 5.1. Market Analysis, Insights and Forecast - by Data Center Type
- 5.1.1. Hyperscale Self-Build
- 5.1.2. Hyperscale Colocation
- 5.2. Market Analysis, Insights and Forecast - by Region
- 5.2.1. North America
- 5.2.2. Europe
- 5.2.3. Asia Pacific
- 5.2.4. South America
- 5.2.5. Middle East
- 5.1. Market Analysis, Insights and Forecast - by Data Center Type
- 6. North America Hyperscale Data Center Industry Analysis, Insights and Forecast, 2019-2031
- 6.1. Market Analysis, Insights and Forecast - by Data Center Type
- 6.1.1. Hyperscale Self-Build
- 6.1.2. Hyperscale Colocation
- 6.1. Market Analysis, Insights and Forecast - by Data Center Type
- 7. Europe Hyperscale Data Center Industry Analysis, Insights and Forecast, 2019-2031
- 7.1. Market Analysis, Insights and Forecast - by Data Center Type
- 7.1.1. Hyperscale Self-Build
- 7.1.2. Hyperscale Colocation
- 7.1. Market Analysis, Insights and Forecast - by Data Center Type
- 8. Asia Pacific Hyperscale Data Center Industry Analysis, Insights and Forecast, 2019-2031
- 8.1. Market Analysis, Insights and Forecast - by Data Center Type
- 8.1.1. Hyperscale Self-Build
- 8.1.2. Hyperscale Colocation
- 8.1. Market Analysis, Insights and Forecast - by Data Center Type
- 9. South America Hyperscale Data Center Industry Analysis, Insights and Forecast, 2019-2031
- 9.1. Market Analysis, Insights and Forecast - by Data Center Type
- 9.1.1. Hyperscale Self-Build
- 9.1.2. Hyperscale Colocation
- 9.1. Market Analysis, Insights and Forecast - by Data Center Type
- 10. Middle East Hyperscale Data Center Industry Analysis, Insights and Forecast, 2019-2031
- 10.1. Market Analysis, Insights and Forecast - by Data Center Type
- 10.1.1. Hyperscale Self-Build
- 10.1.2. Hyperscale Colocation
- 10.1. Market Analysis, Insights and Forecast - by Data Center Type
- 11. North America Hyperscale Data Center Industry Analysis, Insights and Forecast, 2019-2031
- 11.1. Market Analysis, Insights and Forecast - By Country/Sub-region
- 11.1.1 United States
- 11.1.2 Canada
- 11.1.3 Mexico
- 12. Europe Hyperscale Data Center Industry Analysis, Insights and Forecast, 2019-2031
- 12.1. Market Analysis, Insights and Forecast - By Country/Sub-region
- 12.1.1 Germany
- 12.1.2 United Kingdom
- 12.1.3 France
- 12.1.4 Spain
- 12.1.5 Italy
- 12.1.6 Spain
- 12.1.7 Belgium
- 12.1.8 Netherland
- 12.1.9 Nordics
- 12.1.10 Rest of Europe
- 13. Asia Pacific Hyperscale Data Center Industry Analysis, Insights and Forecast, 2019-2031
- 13.1. Market Analysis, Insights and Forecast - By Country/Sub-region
- 13.1.1 China
- 13.1.2 Japan
- 13.1.3 India
- 13.1.4 South Korea
- 13.1.5 Southeast Asia
- 13.1.6 Australia
- 13.1.7 Indonesia
- 13.1.8 Phillipes
- 13.1.9 Singapore
- 13.1.10 Thailandc
- 13.1.11 Rest of Asia Pacific
- 14. South America Hyperscale Data Center Industry Analysis, Insights and Forecast, 2019-2031
- 14.1. Market Analysis, Insights and Forecast - By Country/Sub-region
- 14.1.1 Brazil
- 14.1.2 Argentina
- 14.1.3 Peru
- 14.1.4 Chile
- 14.1.5 Colombia
- 14.1.6 Ecuador
- 14.1.7 Venezuela
- 14.1.8 Rest of South America
- 15. North America Hyperscale Data Center Industry Analysis, Insights and Forecast, 2019-2031
- 15.1. Market Analysis, Insights and Forecast - By Country/Sub-region
- 15.1.1 United States
- 15.1.2 Canada
- 15.1.3 Mexico
- 16. MEA Hyperscale Data Center Industry Analysis, Insights and Forecast, 2019-2031
- 16.1. Market Analysis, Insights and Forecast - By Country/Sub-region
- 16.1.1 United Arab Emirates
- 16.1.2 Saudi Arabia
- 16.1.3 South Africa
- 16.1.4 Rest of Middle East and Africa
- 17. Competitive Analysis
- 17.1. Global Market Share Analysis 2024
- 17.2. Company Profiles
- 17.2.1 IBM Corporation
- 17.2.1.1. Overview
- 17.2.1.2. Products
- 17.2.1.3. SWOT Analysis
- 17.2.1.4. Recent Developments
- 17.2.1.5. Financials (Based on Availability)
- 17.2.2 Hewlett Packard Enterprise Co
- 17.2.2.1. Overview
- 17.2.2.2. Products
- 17.2.2.3. SWOT Analysis
- 17.2.2.4. Recent Developments
- 17.2.2.5. Financials (Based on Availability)
- 17.2.3 Alphabet Inc
- 17.2.3.1. Overview
- 17.2.3.2. Products
- 17.2.3.3. SWOT Analysis
- 17.2.3.4. Recent Developments
- 17.2.3.5. Financials (Based on Availability)
- 17.2.4 Cisco Systems Inc
- 17.2.4.1. Overview
- 17.2.4.2. Products
- 17.2.4.3. SWOT Analysis
- 17.2.4.4. Recent Developments
- 17.2.4.5. Financials (Based on Availability)
- 17.2.5 Microsoft Corporation
- 17.2.5.1. Overview
- 17.2.5.2. Products
- 17.2.5.3. SWOT Analysis
- 17.2.5.4. Recent Developments
- 17.2.5.5. Financials (Based on Availability)
- 17.2.6 Amazon Web Services Inc
- 17.2.6.1. Overview
- 17.2.6.2. Products
- 17.2.6.3. SWOT Analysis
- 17.2.6.4. Recent Developments
- 17.2.6.5. Financials (Based on Availability)
- 17.2.7 Huawei Technologies Co
- 17.2.7.1. Overview
- 17.2.7.2. Products
- 17.2.7.3. SWOT Analysis
- 17.2.7.4. Recent Developments
- 17.2.7.5. Financials (Based on Availability)
- 17.2.8 Quanta Computer Inc
- 17.2.8.1. Overview
- 17.2.8.2. Products
- 17.2.8.3. SWOT Analysis
- 17.2.8.4. Recent Developments
- 17.2.8.5. Financials (Based on Availability)
- 17.2.9 Alibaba Group
- 17.2.9.1. Overview
- 17.2.9.2. Products
- 17.2.9.3. SWOT Analysis
- 17.2.9.4. Recent Developments
- 17.2.9.5. Financials (Based on Availability)
- 17.2.10 Facebook Inc
- 17.2.10.1. Overview
- 17.2.10.2. Products
- 17.2.10.3. SWOT Analysis
- 17.2.10.4. Recent Developments
- 17.2.10.5. Financials (Based on Availability)
- 17.2.11 Nvidia Corporation
- 17.2.11.1. Overview
- 17.2.11.2. Products
- 17.2.11.3. SWOT Analysis
- 17.2.11.4. Recent Developments
- 17.2.11.5. Financials (Based on Availability)
- 17.2.1 IBM Corporation
List of Figures
- Figure 1: Global Hyperscale Data Center Industry Revenue Breakdown (Million, %) by Region 2024 & 2032
- Figure 2: North America Hyperscale Data Center Industry Revenue (Million), by Country 2024 & 2032
- Figure 3: North America Hyperscale Data Center Industry Revenue Share (%), by Country 2024 & 2032
- Figure 4: Europe Hyperscale Data Center Industry Revenue (Million), by Country 2024 & 2032
- Figure 5: Europe Hyperscale Data Center Industry Revenue Share (%), by Country 2024 & 2032
- Figure 6: Asia Pacific Hyperscale Data Center Industry Revenue (Million), by Country 2024 & 2032
- Figure 7: Asia Pacific Hyperscale Data Center Industry Revenue Share (%), by Country 2024 & 2032
- Figure 8: South America Hyperscale Data Center Industry Revenue (Million), by Country 2024 & 2032
- Figure 9: South America Hyperscale Data Center Industry Revenue Share (%), by Country 2024 & 2032
- Figure 10: North America Hyperscale Data Center Industry Revenue (Million), by Country 2024 & 2032
- Figure 11: North America Hyperscale Data Center Industry Revenue Share (%), by Country 2024 & 2032
- Figure 12: MEA Hyperscale Data Center Industry Revenue (Million), by Country 2024 & 2032
- Figure 13: MEA Hyperscale Data Center Industry Revenue Share (%), by Country 2024 & 2032
- Figure 14: North America Hyperscale Data Center Industry Revenue (Million), by Data Center Type 2024 & 2032
- Figure 15: North America Hyperscale Data Center Industry Revenue Share (%), by Data Center Type 2024 & 2032
- Figure 16: North America Hyperscale Data Center Industry Revenue (Million), by Country 2024 & 2032
- Figure 17: North America Hyperscale Data Center Industry Revenue Share (%), by Country 2024 & 2032
- Figure 18: Europe Hyperscale Data Center Industry Revenue (Million), by Data Center Type 2024 & 2032
- Figure 19: Europe Hyperscale Data Center Industry Revenue Share (%), by Data Center Type 2024 & 2032
- Figure 20: Europe Hyperscale Data Center Industry Revenue (Million), by Country 2024 & 2032
- Figure 21: Europe Hyperscale Data Center Industry Revenue Share (%), by Country 2024 & 2032
- Figure 22: Asia Pacific Hyperscale Data Center Industry Revenue (Million), by Data Center Type 2024 & 2032
- Figure 23: Asia Pacific Hyperscale Data Center Industry Revenue Share (%), by Data Center Type 2024 & 2032
- Figure 24: Asia Pacific Hyperscale Data Center Industry Revenue (Million), by Country 2024 & 2032
- Figure 25: Asia Pacific Hyperscale Data Center Industry Revenue Share (%), by Country 2024 & 2032
- Figure 26: South America Hyperscale Data Center Industry Revenue (Million), by Data Center Type 2024 & 2032
- Figure 27: South America Hyperscale Data Center Industry Revenue Share (%), by Data Center Type 2024 & 2032
- Figure 28: South America Hyperscale Data Center Industry Revenue (Million), by Country 2024 & 2032
- Figure 29: South America Hyperscale Data Center Industry Revenue Share (%), by Country 2024 & 2032
- Figure 30: Middle East Hyperscale Data Center Industry Revenue (Million), by Data Center Type 2024 & 2032
- Figure 31: Middle East Hyperscale Data Center Industry Revenue Share (%), by Data Center Type 2024 & 2032
- Figure 32: Middle East Hyperscale Data Center Industry Revenue (Million), by Country 2024 & 2032
- Figure 33: Middle East Hyperscale Data Center Industry Revenue Share (%), by Country 2024 & 2032
List of Tables
- Table 1: Global Hyperscale Data Center Industry Revenue Million Forecast, by Region 2019 & 2032
- Table 2: Global Hyperscale Data Center Industry Revenue Million Forecast, by Data Center Type 2019 & 2032
- Table 3: Global Hyperscale Data Center Industry Revenue Million Forecast, by Region 2019 & 2032
- Table 4: Global Hyperscale Data Center Industry Revenue Million Forecast, by Country 2019 & 2032
- Table 5: United States Hyperscale Data Center Industry Revenue (Million) Forecast, by Application 2019 & 2032
- Table 6: Canada Hyperscale Data Center Industry Revenue (Million) Forecast, by Application 2019 & 2032
- Table 7: Mexico Hyperscale Data Center Industry Revenue (Million) Forecast, by Application 2019 & 2032
- Table 8: Global Hyperscale Data Center Industry Revenue Million Forecast, by Country 2019 & 2032
- Table 9: Germany Hyperscale Data Center Industry Revenue (Million) Forecast, by Application 2019 & 2032
- Table 10: United Kingdom Hyperscale Data Center Industry Revenue (Million) Forecast, by Application 2019 & 2032
- Table 11: France Hyperscale Data Center Industry Revenue (Million) Forecast, by Application 2019 & 2032
- Table 12: Spain Hyperscale Data Center Industry Revenue (Million) Forecast, by Application 2019 & 2032
- Table 13: Italy Hyperscale Data Center Industry Revenue (Million) Forecast, by Application 2019 & 2032
- Table 14: Spain Hyperscale Data Center Industry Revenue (Million) Forecast, by Application 2019 & 2032
- Table 15: Belgium Hyperscale Data Center Industry Revenue (Million) Forecast, by Application 2019 & 2032
- Table 16: Netherland Hyperscale Data Center Industry Revenue (Million) Forecast, by Application 2019 & 2032
- Table 17: Nordics Hyperscale Data Center Industry Revenue (Million) Forecast, by Application 2019 & 2032
- Table 18: Rest of Europe Hyperscale Data Center Industry Revenue (Million) Forecast, by Application 2019 & 2032
- Table 19: Global Hyperscale Data Center Industry Revenue Million Forecast, by Country 2019 & 2032
- Table 20: China Hyperscale Data Center Industry Revenue (Million) Forecast, by Application 2019 & 2032
- Table 21: Japan Hyperscale Data Center Industry Revenue (Million) Forecast, by Application 2019 & 2032
- Table 22: India Hyperscale Data Center Industry Revenue (Million) Forecast, by Application 2019 & 2032
- Table 23: South Korea Hyperscale Data Center Industry Revenue (Million) Forecast, by Application 2019 & 2032
- Table 24: Southeast Asia Hyperscale Data Center Industry Revenue (Million) Forecast, by Application 2019 & 2032
- Table 25: Australia Hyperscale Data Center Industry Revenue (Million) Forecast, by Application 2019 & 2032
- Table 26: Indonesia Hyperscale Data Center Industry Revenue (Million) Forecast, by Application 2019 & 2032
- Table 27: Phillipes Hyperscale Data Center Industry Revenue (Million) Forecast, by Application 2019 & 2032
- Table 28: Singapore Hyperscale Data Center Industry Revenue (Million) Forecast, by Application 2019 & 2032
- Table 29: Thailandc Hyperscale Data Center Industry Revenue (Million) Forecast, by Application 2019 & 2032
- Table 30: Rest of Asia Pacific Hyperscale Data Center Industry Revenue (Million) Forecast, by Application 2019 & 2032
- Table 31: Global Hyperscale Data Center Industry Revenue Million Forecast, by Country 2019 & 2032
- Table 32: Brazil Hyperscale Data Center Industry Revenue (Million) Forecast, by Application 2019 & 2032
- Table 33: Argentina Hyperscale Data Center Industry Revenue (Million) Forecast, by Application 2019 & 2032
- Table 34: Peru Hyperscale Data Center Industry Revenue (Million) Forecast, by Application 2019 & 2032
- Table 35: Chile Hyperscale Data Center Industry Revenue (Million) Forecast, by Application 2019 & 2032
- Table 36: Colombia Hyperscale Data Center Industry Revenue (Million) Forecast, by Application 2019 & 2032
- Table 37: Ecuador Hyperscale Data Center Industry Revenue (Million) Forecast, by Application 2019 & 2032
- Table 38: Venezuela Hyperscale Data Center Industry Revenue (Million) Forecast, by Application 2019 & 2032
- Table 39: Rest of South America Hyperscale Data Center Industry Revenue (Million) Forecast, by Application 2019 & 2032
- Table 40: Global Hyperscale Data Center Industry Revenue Million Forecast, by Country 2019 & 2032
- Table 41: United States Hyperscale Data Center Industry Revenue (Million) Forecast, by Application 2019 & 2032
- Table 42: Canada Hyperscale Data Center Industry Revenue (Million) Forecast, by Application 2019 & 2032
- Table 43: Mexico Hyperscale Data Center Industry Revenue (Million) Forecast, by Application 2019 & 2032
- Table 44: Global Hyperscale Data Center Industry Revenue Million Forecast, by Country 2019 & 2032
- Table 45: United Arab Emirates Hyperscale Data Center Industry Revenue (Million) Forecast, by Application 2019 & 2032
- Table 46: Saudi Arabia Hyperscale Data Center Industry Revenue (Million) Forecast, by Application 2019 & 2032
- Table 47: South Africa Hyperscale Data Center Industry Revenue (Million) Forecast, by Application 2019 & 2032
- Table 48: Rest of Middle East and Africa Hyperscale Data Center Industry Revenue (Million) Forecast, by Application 2019 & 2032
- Table 49: Global Hyperscale Data Center Industry Revenue Million Forecast, by Data Center Type 2019 & 2032
- Table 50: Global Hyperscale Data Center Industry Revenue Million Forecast, by Country 2019 & 2032
- Table 51: US Hyperscale Data Center Industry Revenue (Million) Forecast, by Application 2019 & 2032
- Table 52: Canada Hyperscale Data Center Industry Revenue (Million) Forecast, by Application 2019 & 2032
- Table 53: Rest of North America Hyperscale Data Center Industry Revenue (Million) Forecast, by Application 2019 & 2032
- Table 54: Global Hyperscale Data Center Industry Revenue Million Forecast, by Data Center Type 2019 & 2032
- Table 55: Global Hyperscale Data Center Industry Revenue Million Forecast, by Country 2019 & 2032
- Table 56: Germany Hyperscale Data Center Industry Revenue (Million) Forecast, by Application 2019 & 2032
- Table 57: UK Hyperscale Data Center Industry Revenue (Million) Forecast, by Application 2019 & 2032
- Table 58: France Hyperscale Data Center Industry Revenue (Million) Forecast, by Application 2019 & 2032
- Table 59: Netherlands Hyperscale Data Center Industry Revenue (Million) Forecast, by Application 2019 & 2032
- Table 60: Ireland Hyperscale Data Center Industry Revenue (Million) Forecast, by Application 2019 & 2032
- Table 61: Spain Hyperscale Data Center Industry Revenue (Million) Forecast, by Application 2019 & 2032
- Table 62: Italy Hyperscale Data Center Industry Revenue (Million) Forecast, by Application 2019 & 2032
- Table 63: Rest of Europe Hyperscale Data Center Industry Revenue (Million) Forecast, by Application 2019 & 2032
- Table 64: Global Hyperscale Data Center Industry Revenue Million Forecast, by Data Center Type 2019 & 2032
- Table 65: Global Hyperscale Data Center Industry Revenue Million Forecast, by Country 2019 & 2032
- Table 66: India Hyperscale Data Center Industry Revenue (Million) Forecast, by Application 2019 & 2032
- Table 67: China Hyperscale Data Center Industry Revenue (Million) Forecast, by Application 2019 & 2032
- Table 68: Japan Hyperscale Data Center Industry Revenue (Million) Forecast, by Application 2019 & 2032
- Table 69: Singapore Hyperscale Data Center Industry Revenue (Million) Forecast, by Application 2019 & 2032
- Table 70: Australia Hyperscale Data Center Industry Revenue (Million) Forecast, by Application 2019 & 2032
- Table 71: Indonesia Hyperscale Data Center Industry Revenue (Million) Forecast, by Application 2019 & 2032
- Table 72: Malaysia Hyperscale Data Center Industry Revenue (Million) Forecast, by Application 2019 & 2032
- Table 73: Thailand Hyperscale Data Center Industry Revenue (Million) Forecast, by Application 2019 & 2032
- Table 74: Rest of Asia Pacific Hyperscale Data Center Industry Revenue (Million) Forecast, by Application 2019 & 2032
- Table 75: Global Hyperscale Data Center Industry Revenue Million Forecast, by Data Center Type 2019 & 2032
- Table 76: Global Hyperscale Data Center Industry Revenue Million Forecast, by Country 2019 & 2032
- Table 77: Brazil Hyperscale Data Center Industry Revenue (Million) Forecast, by Application 2019 & 2032
- Table 78: Chile Hyperscale Data Center Industry Revenue (Million) Forecast, by Application 2019 & 2032
- Table 79: Rest of South America Hyperscale Data Center Industry Revenue (Million) Forecast, by Application 2019 & 2032
- Table 80: Global Hyperscale Data Center Industry Revenue Million Forecast, by Data Center Type 2019 & 2032
- Table 81: Global Hyperscale Data Center Industry Revenue Million Forecast, by Country 2019 & 2032
- Table 82: United Arab Emirates Hyperscale Data Center Industry Revenue (Million) Forecast, by Application 2019 & 2032
- Table 83: Saudi Arabia Hyperscale Data Center Industry Revenue (Million) Forecast, by Application 2019 & 2032
- Table 84: Rest of Middle East Hyperscale Data Center Industry Revenue (Million) Forecast, by Application 2019 & 2032
Frequently Asked Questions
1. What is the projected Compound Annual Growth Rate (CAGR) of the Hyperscale Data Center Industry?
The projected CAGR is approximately 5.29%.
2. Which companies are prominent players in the Hyperscale Data Center Industry?
Key companies in the market include IBM Corporation, Hewlett Packard Enterprise Co, Alphabet Inc, Cisco Systems Inc, Microsoft Corporation, Amazon Web Services Inc, Huawei Technologies Co, Quanta Computer Inc, Alibaba Group, Facebook Inc, Nvidia Corporation.
3. What are the main segments of the Hyperscale Data Center Industry?
The market segments include Data Center Type.
4. Can you provide details about the market size?
The market size is estimated to be USD 101.23 Million as of 2022.
5. What are some drivers contributing to market growth?
Growing Demand for Cloud Computing and Other High Performance Technologies.
6. What are the notable trends driving market growth?
Growing Demand for Cloud Computing and Other Hight Performance Technologies Driving the Market.
7. Are there any restraints impacting market growth?
High Costs and Operational Concerns; Concerns related to Geoprivacy and Confidential Data.
8. Can you provide examples of recent developments in the market?
November 2022 - Big Data Exchange (BDx), PT Indosat Tbk (Indosat Ooredoo Hutchison), and PT Aplikanusa Lintasarta announced their plan to build a 100MW data center complex on 12 acres of land. This new data center campus, CGK5, will be located in Karawang, West Java, east of Jakarta, and will be part of the company's third availability zone. The BDx Indonesia joint venture is a key component of the BDx platform, and the construction of CGK5 is BDx's 11th data center in the Asia-Pacific region. With more than USD 1 billion in committed investment funding, BDx's strong development trajectory across Asia allows scaled innovation in the most challenging markets.
9. What pricing options are available for accessing the report?
Pricing options include single-user, multi-user, and enterprise licenses priced at USD 4750, USD 5250, and USD 8750 respectively.
10. Is the market size provided in terms of value or volume?
The market size is provided in terms of value, measured in Million.
11. Are there any specific market keywords associated with the report?
Yes, the market keyword associated with the report is "Hyperscale Data Center Industry," which aids in identifying and referencing the specific market segment covered.
12. How do I determine which pricing option suits my needs best?
The pricing options vary based on user requirements and access needs. Individual users may opt for single-user licenses, while businesses requiring broader access may choose multi-user or enterprise licenses for cost-effective access to the report.
13. Are there any additional resources or data provided in the Hyperscale Data Center Industry report?
While the report offers comprehensive insights, it's advisable to review the specific contents or supplementary materials provided to ascertain if additional resources or data are available.
14. How can I stay updated on further developments or reports in the Hyperscale Data Center Industry?
To stay informed about further developments, trends, and reports in the Hyperscale Data Center Industry, consider subscribing to industry newsletters, following relevant companies and organizations, or regularly checking reputable industry news sources and publications.
Methodology
Step 1 - Identification of Relevant Samples Size from Population Database


Step 2 - Approaches for Defining Global Market Size (Value, Volume* & Price*)

Note*: In applicable scenarios
Step 3 - Data Sources
Primary Research
- Web Analytics
- Survey Reports
- Research Institute
- Latest Research Reports
- Opinion Leaders
Secondary Research
- Annual Reports
- White Paper
- Latest Press Release
- Industry Association
- Paid Database
- Investor Presentations

Step 4 - Data Triangulation
Involves using different sources of information in order to increase the validity of a study
These sources are likely to be stakeholders in a program - participants, other researchers, program staff, other community members, and so on.
Then we put all data in single framework & apply various statistical tools to find out the dynamic on the market.
During the analysis stage, feedback from the stakeholder groups would be compared to determine areas of agreement as well as areas of divergence


