
Key Insights
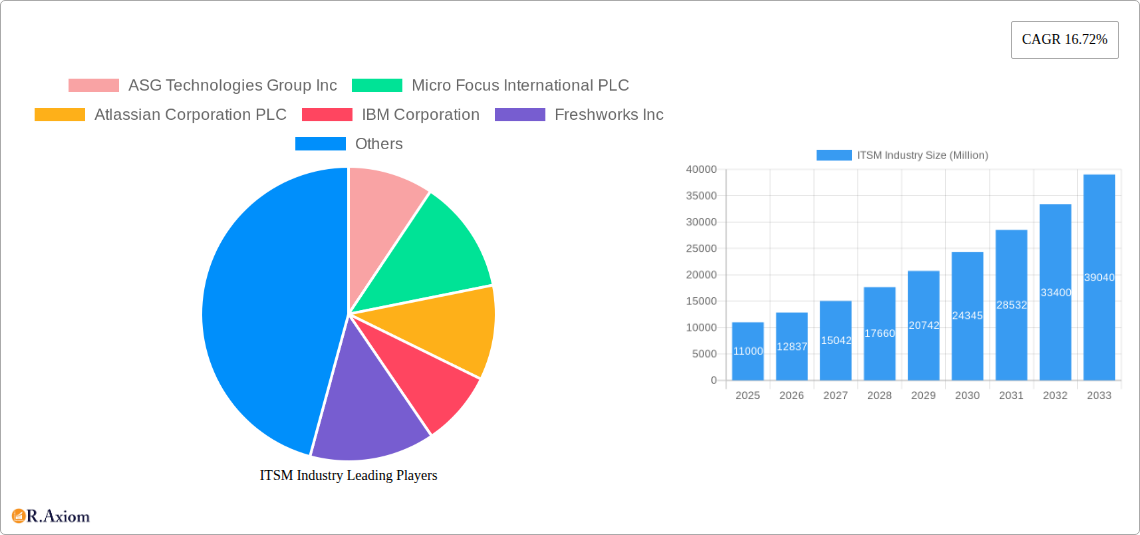
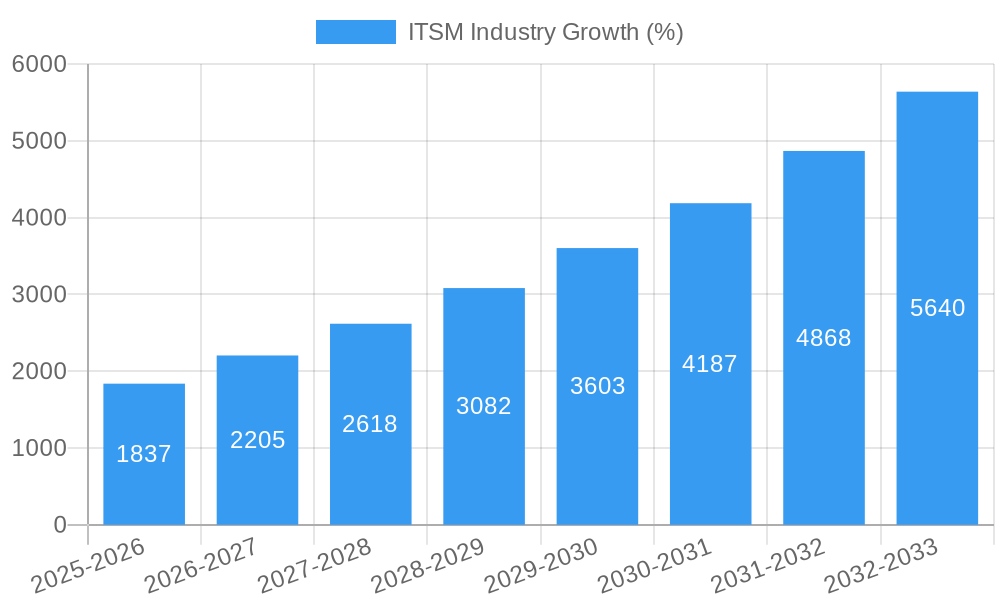
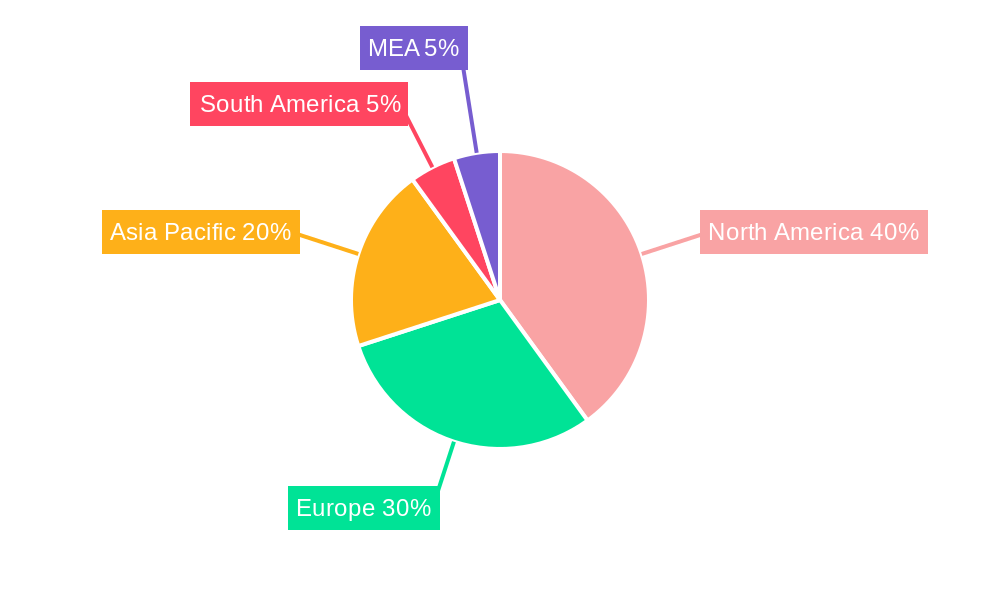
The ITSM (IT Service Management) market is experiencing robust growth, projected to reach \$11 billion in 2025 and maintain a Compound Annual Growth Rate (CAGR) of 16.72% from 2025 to 2033. This expansion is driven by several key factors. The increasing adoption of cloud-based solutions offers scalability and cost-effectiveness, fueling market growth. Furthermore, the rising complexity of IT infrastructures necessitates efficient management, leading organizations to invest heavily in ITSM tools for improved performance monitoring, configuration management, and incident resolution. The BFSI (Banking, Financial Services, and Insurance) sector, along with IT and telecommunications, are significant contributors to market revenue, demonstrating a high reliance on robust ITSM solutions for maintaining operational efficiency and regulatory compliance. Growth is further propelled by the increasing demand for automation and AI-powered ITSM solutions that streamline workflows and enhance service delivery. Geographical expansion is also a significant driver, with North America and Europe currently leading the market, but regions like Asia-Pacific exhibiting substantial growth potential due to increasing digitalization and infrastructure development.
While the market demonstrates significant promise, certain restraints exist. High implementation costs and the need for specialized expertise can be barriers to entry for smaller organizations. Moreover, integrating ITSM solutions with existing IT infrastructure can present challenges, potentially delaying adoption. However, ongoing technological advancements and the rising availability of user-friendly, cost-effective solutions are likely to mitigate these constraints. The market segmentation reveals a strong preference for cloud-based deployment models, reflecting a broader industry trend towards agility and scalability. The diverse application segments (configuration, performance, network, and database management) highlight the comprehensive nature of ITSM solutions, addressing critical aspects of IT operations across various industries. The projected growth trajectory strongly indicates a positive outlook for the ITSM market throughout the forecast period.
ITSM Industry Market Report: 2019-2033 - A Comprehensive Analysis
This in-depth report provides a comprehensive analysis of the IT Service Management (ITSM) industry, covering market size, segmentation, growth drivers, challenges, and key players. The study period spans from 2019 to 2033, with 2025 serving as the base and estimated year. The report leverages extensive data analysis and insights to offer actionable strategies for stakeholders across the ITSM ecosystem. The global ITSM market is projected to reach $XX million by 2033, exhibiting a robust CAGR of XX% during the forecast period (2025-2033).
ITSM Industry Market Concentration & Innovation
The ITSM market exhibits a moderately concentrated landscape, with key players like ASG Technologies Group Inc, Micro Focus International PLC, Atlassian Corporation PLC, IBM Corporation, Freshworks Inc, and ServiceNow Inc holding significant market share. However, the market also features numerous smaller players and niche providers, fostering competition and innovation. Market share estimates for 2025 indicate that ServiceNow holds approximately XX% of the market, followed by IBM with XX%, and Atlassian with XX%. The remaining share is distributed among other players.
Innovation is driven by factors like:
- Cloud adoption: Shift towards cloud-based ITSM solutions is fueling growth.
- AI and automation: Integration of AI and ML for improved efficiency and service delivery.
- Digital transformation: Organizations' focus on digital transformation is driving ITSM adoption.
- Enhanced user experience: Demand for user-friendly and intuitive ITSM platforms.
Regulatory frameworks, particularly around data privacy and security (e.g., GDPR, CCPA), significantly influence market dynamics. Product substitutes, such as in-house developed solutions, present a challenge, but are often less comprehensive and feature-rich than dedicated ITSM platforms. End-user trends, like increasing demand for self-service portals and proactive support, shape product development. Significant M&A activity has been observed, with total deal values exceeding $XX million in the past five years, demonstrating industry consolidation and expansion. Notable deals include:
- April 2024: 4me acquired StatusCast for an undisclosed sum.
- February 2024: Lyvia Group acquired Gorilla Services BV for EUR 1.1 million EBITDA.
ITSM Industry Trends & Insights
The ITSM market is experiencing substantial growth driven by several factors. The rising adoption of cloud-based solutions and the increasing focus on digital transformation are significantly impacting market expansion. The average annual growth rate (CAGR) is estimated at XX% from 2025 to 2033.
Technological disruptions, including the rise of AI, machine learning, and automation, are transforming ITSM capabilities and improving efficiency. Consumers increasingly prefer intuitive, user-friendly interfaces, personalized support, and self-service options. These preferences are driving the development of next-generation ITSM platforms. Competitive dynamics remain intense, with established players facing competition from emerging agile companies. Market penetration is currently estimated at XX%, with significant room for growth, particularly in emerging economies.
Dominant Markets & Segments in ITSM Industry
The North American region holds the largest market share in the ITSM industry, driven by high technological adoption, robust IT infrastructure, and a large base of enterprises. The Cloud deployment segment is experiencing the fastest growth, fueled by its scalability, cost-effectiveness, and accessibility.
Dominant Segments:
- By Application: Configuration Management holds a significant market share due to its critical role in maintaining IT infrastructure stability and security, followed by Performance Management and Network Management.
- By End-user Industry: BFSI and IT & Telecommunication are the leading segments due to their high IT reliance and stringent service level requirements. Government and Education sectors show significant growth potential.
- By Deployment: Cloud deployment is dominating the market due to its scalability and flexibility.
Key Drivers for Dominant Segments:
- Economic Policies: Government investments in IT infrastructure and digital transformation initiatives.
- Infrastructure: Robust IT infrastructure and widespread internet penetration.
- Industry-Specific Regulations: Compliance requirements in BFSI and Healthcare sectors.
ITSM Industry Product Developments
Recent product innovations focus on AI-driven automation, self-service capabilities, and improved integration with other enterprise applications. These advancements are enhancing efficiency, improving user experience, and strengthening competitive advantages. The market is moving towards unified platforms that integrate various ITSM functions, providing a holistic view of IT operations and improving collaboration among teams. The emphasis on proactive monitoring and predictive analytics is helping organizations anticipate and prevent IT issues, leading to greater operational efficiency.
Report Scope & Segmentation Analysis
This report comprehensively segments the ITSM market across multiple dimensions.
By Application: Configuration Management, Performance Management, Network Management, Database Management Systems, and Other Applications. Each segment's market size, growth projections, and competitive dynamics are analyzed.
By End-user Industry: BFSI, Manufacturing, Government and Education, IT and Telecommunication, Retail, Travel and Hospitality, Healthcare, and Other End-user Industries. The report delves into industry-specific ITSM needs and adoption rates.
By Deployment: Cloud and On-premise. The analysis includes a comparative study of the strengths and weaknesses of each deployment model. Growth projections for each segment are provided, with an estimation of market sizes in millions for the year 2033.
Key Drivers of ITSM Industry Growth
Technological advancements, such as AI, machine learning, and automation, are key drivers. The increasing focus on digital transformation across industries is also significantly impacting the market. Economic factors, including increased IT spending and government initiatives promoting digitalization, contribute to ITSM market growth. Lastly, regulatory changes mandating improved data security and compliance are further driving ITSM adoption.
Challenges in the ITSM Industry Sector
The ITSM industry faces challenges such as integrating legacy systems with modern cloud-based platforms, high implementation costs, a shortage of skilled IT professionals, and increasing competition from smaller, agile players. These factors, combined with the complexity of integrating various ITSM tools and the need for continuous upgrades and maintenance, present obstacles to market growth. The estimated impact on market growth due to these challenges is approximately XX million annually.
Emerging Opportunities in ITSM Industry
Emerging trends, including the increasing adoption of AIOps and the rise of low-code/no-code platforms, present exciting opportunities. Expansion into untapped markets, particularly in emerging economies, also offers significant potential for growth. The focus on proactive service management and predictive analytics creates further opportunities.
Leading Players in the ITSM Industry Market
- ASG Technologies Group Inc
- Micro Focus International PLC
- Atlassian Corporation PLC
- IBM Corporation
- Freshworks Inc
- ServiceNow Inc
- Ivanti Inc
- Broadcom Inc
- BMC Software Inc (Kohlberg Kravis Roberts & Co LP )
- Axios Systems
Key Developments in ITSM Industry
- April 2024: 4me's acquisition of StatusCast strengthens its position in cloud-based incident management.
- February 2024: Lyvia Group's acquisition of Gorilla Services BV expands its ITSM capabilities.
Strategic Outlook for ITSM Industry Market
The ITSM market is poised for sustained growth, driven by ongoing digital transformation, increasing cloud adoption, and the rise of AI and automation. Future market potential lies in the expansion of AI-driven ITSM solutions, the integration of emerging technologies like blockchain and IoT, and the development of more personalized and proactive service delivery models. The market will see significant growth in the next decade, with continued consolidation and innovation among key players.
ITSM Industry Segmentation
-
1. Deployment
- 1.1. Cloud
- 1.2. On-premise
-
2. Application
- 2.1. Configuration Management
- 2.2. Performance Management
- 2.3. Network Management
- 2.4. Database Management Systems
- 2.5. Other Applications
-
3. End-user Industry
- 3.1. BFSI
- 3.2. Manufacturing
- 3.3. Government and Education
- 3.4. IT and Telecommunication
- 3.5. Retail
- 3.6. Travel and Hospitality
- 3.7. Healthcare
- 3.8. Other End-user Industries
ITSM Industry Segmentation By Geography
- 1. North America
- 2. Europe
- 3. Asia Pacific
- 4. Latin America
- 5. Middle East and Africa
ITSM Industry REPORT HIGHLIGHTS
| Aspects | Details |
|---|---|
| Study Period | 2019-2033 |
| Base Year | 2024 |
| Estimated Year | 2025 |
| Forecast Period | 2025-2033 |
| Historical Period | 2019-2024 |
| Growth Rate | CAGR of 16.72% from 2019-2033 |
| Segmentation |
|
Table of Contents
- 1. Introduction
- 1.1. Research Scope
- 1.2. Market Segmentation
- 1.3. Research Methodology
- 1.4. Definitions and Assumptions
- 2. Executive Summary
- 2.1. Introduction
- 3. Market Dynamics
- 3.1. Introduction
- 3.2. Market Drivers
- 3.2.1. Rising Adoption of Updated IT Infrastructure Across End-user Industries; Increasing Demand for a Unified Platform to Manage and Monitor IT Infrastructure Performance
- 3.3. Market Restrains
- 3.3.1. Issues in ITSM Implementation and Lack of Quality Standards in Service-level Agreement
- 3.4. Market Trends
- 3.4.1. The IT and Telecommunication Segment is Expected to Hold a Significant Market Share
- 4. Market Factor Analysis
- 4.1. Porters Five Forces
- 4.2. Supply/Value Chain
- 4.3. PESTEL analysis
- 4.4. Market Entropy
- 4.5. Patent/Trademark Analysis
- 5. Global ITSM Industry Analysis, Insights and Forecast, 2019-2031
- 5.1. Market Analysis, Insights and Forecast - by Deployment
- 5.1.1. Cloud
- 5.1.2. On-premise
- 5.2. Market Analysis, Insights and Forecast - by Application
- 5.2.1. Configuration Management
- 5.2.2. Performance Management
- 5.2.3. Network Management
- 5.2.4. Database Management Systems
- 5.2.5. Other Applications
- 5.3. Market Analysis, Insights and Forecast - by End-user Industry
- 5.3.1. BFSI
- 5.3.2. Manufacturing
- 5.3.3. Government and Education
- 5.3.4. IT and Telecommunication
- 5.3.5. Retail
- 5.3.6. Travel and Hospitality
- 5.3.7. Healthcare
- 5.3.8. Other End-user Industries
- 5.4. Market Analysis, Insights and Forecast - by Region
- 5.4.1. North America
- 5.4.2. Europe
- 5.4.3. Asia Pacific
- 5.4.4. Latin America
- 5.4.5. Middle East and Africa
- 5.1. Market Analysis, Insights and Forecast - by Deployment
- 6. North America ITSM Industry Analysis, Insights and Forecast, 2019-2031
- 6.1. Market Analysis, Insights and Forecast - by Deployment
- 6.1.1. Cloud
- 6.1.2. On-premise
- 6.2. Market Analysis, Insights and Forecast - by Application
- 6.2.1. Configuration Management
- 6.2.2. Performance Management
- 6.2.3. Network Management
- 6.2.4. Database Management Systems
- 6.2.5. Other Applications
- 6.3. Market Analysis, Insights and Forecast - by End-user Industry
- 6.3.1. BFSI
- 6.3.2. Manufacturing
- 6.3.3. Government and Education
- 6.3.4. IT and Telecommunication
- 6.3.5. Retail
- 6.3.6. Travel and Hospitality
- 6.3.7. Healthcare
- 6.3.8. Other End-user Industries
- 6.1. Market Analysis, Insights and Forecast - by Deployment
- 7. Europe ITSM Industry Analysis, Insights and Forecast, 2019-2031
- 7.1. Market Analysis, Insights and Forecast - by Deployment
- 7.1.1. Cloud
- 7.1.2. On-premise
- 7.2. Market Analysis, Insights and Forecast - by Application
- 7.2.1. Configuration Management
- 7.2.2. Performance Management
- 7.2.3. Network Management
- 7.2.4. Database Management Systems
- 7.2.5. Other Applications
- 7.3. Market Analysis, Insights and Forecast - by End-user Industry
- 7.3.1. BFSI
- 7.3.2. Manufacturing
- 7.3.3. Government and Education
- 7.3.4. IT and Telecommunication
- 7.3.5. Retail
- 7.3.6. Travel and Hospitality
- 7.3.7. Healthcare
- 7.3.8. Other End-user Industries
- 7.1. Market Analysis, Insights and Forecast - by Deployment
- 8. Asia Pacific ITSM Industry Analysis, Insights and Forecast, 2019-2031
- 8.1. Market Analysis, Insights and Forecast - by Deployment
- 8.1.1. Cloud
- 8.1.2. On-premise
- 8.2. Market Analysis, Insights and Forecast - by Application
- 8.2.1. Configuration Management
- 8.2.2. Performance Management
- 8.2.3. Network Management
- 8.2.4. Database Management Systems
- 8.2.5. Other Applications
- 8.3. Market Analysis, Insights and Forecast - by End-user Industry
- 8.3.1. BFSI
- 8.3.2. Manufacturing
- 8.3.3. Government and Education
- 8.3.4. IT and Telecommunication
- 8.3.5. Retail
- 8.3.6. Travel and Hospitality
- 8.3.7. Healthcare
- 8.3.8. Other End-user Industries
- 8.1. Market Analysis, Insights and Forecast - by Deployment
- 9. Latin America ITSM Industry Analysis, Insights and Forecast, 2019-2031
- 9.1. Market Analysis, Insights and Forecast - by Deployment
- 9.1.1. Cloud
- 9.1.2. On-premise
- 9.2. Market Analysis, Insights and Forecast - by Application
- 9.2.1. Configuration Management
- 9.2.2. Performance Management
- 9.2.3. Network Management
- 9.2.4. Database Management Systems
- 9.2.5. Other Applications
- 9.3. Market Analysis, Insights and Forecast - by End-user Industry
- 9.3.1. BFSI
- 9.3.2. Manufacturing
- 9.3.3. Government and Education
- 9.3.4. IT and Telecommunication
- 9.3.5. Retail
- 9.3.6. Travel and Hospitality
- 9.3.7. Healthcare
- 9.3.8. Other End-user Industries
- 9.1. Market Analysis, Insights and Forecast - by Deployment
- 10. Middle East and Africa ITSM Industry Analysis, Insights and Forecast, 2019-2031
- 10.1. Market Analysis, Insights and Forecast - by Deployment
- 10.1.1. Cloud
- 10.1.2. On-premise
- 10.2. Market Analysis, Insights and Forecast - by Application
- 10.2.1. Configuration Management
- 10.2.2. Performance Management
- 10.2.3. Network Management
- 10.2.4. Database Management Systems
- 10.2.5. Other Applications
- 10.3. Market Analysis, Insights and Forecast - by End-user Industry
- 10.3.1. BFSI
- 10.3.2. Manufacturing
- 10.3.3. Government and Education
- 10.3.4. IT and Telecommunication
- 10.3.5. Retail
- 10.3.6. Travel and Hospitality
- 10.3.7. Healthcare
- 10.3.8. Other End-user Industries
- 10.1. Market Analysis, Insights and Forecast - by Deployment
- 11. North America ITSM Industry Analysis, Insights and Forecast, 2019-2031
- 11.1. Market Analysis, Insights and Forecast - By Country/Sub-region
- 11.1.1 United States
- 11.1.2 Canada
- 11.1.3 Mexico
- 12. Europe ITSM Industry Analysis, Insights and Forecast, 2019-2031
- 12.1. Market Analysis, Insights and Forecast - By Country/Sub-region
- 12.1.1 Germany
- 12.1.2 United Kingdom
- 12.1.3 France
- 12.1.4 Spain
- 12.1.5 Italy
- 12.1.6 Spain
- 12.1.7 Belgium
- 12.1.8 Netherland
- 12.1.9 Nordics
- 12.1.10 Rest of Europe
- 13. Asia Pacific ITSM Industry Analysis, Insights and Forecast, 2019-2031
- 13.1. Market Analysis, Insights and Forecast - By Country/Sub-region
- 13.1.1 China
- 13.1.2 Japan
- 13.1.3 India
- 13.1.4 South Korea
- 13.1.5 Southeast Asia
- 13.1.6 Australia
- 13.1.7 Indonesia
- 13.1.8 Phillipes
- 13.1.9 Singapore
- 13.1.10 Thailandc
- 13.1.11 Rest of Asia Pacific
- 14. South America ITSM Industry Analysis, Insights and Forecast, 2019-2031
- 14.1. Market Analysis, Insights and Forecast - By Country/Sub-region
- 14.1.1 Brazil
- 14.1.2 Argentina
- 14.1.3 Peru
- 14.1.4 Chile
- 14.1.5 Colombia
- 14.1.6 Ecuador
- 14.1.7 Venezuela
- 14.1.8 Rest of South America
- 15. North America ITSM Industry Analysis, Insights and Forecast, 2019-2031
- 15.1. Market Analysis, Insights and Forecast - By Country/Sub-region
- 15.1.1 United States
- 15.1.2 Canada
- 15.1.3 Mexico
- 16. MEA ITSM Industry Analysis, Insights and Forecast, 2019-2031
- 16.1. Market Analysis, Insights and Forecast - By Country/Sub-region
- 16.1.1 United Arab Emirates
- 16.1.2 Saudi Arabia
- 16.1.3 South Africa
- 16.1.4 Rest of Middle East and Africa
- 17. Competitive Analysis
- 17.1. Global Market Share Analysis 2024
- 17.2. Company Profiles
- 17.2.1 ASG Technologies Group Inc
- 17.2.1.1. Overview
- 17.2.1.2. Products
- 17.2.1.3. SWOT Analysis
- 17.2.1.4. Recent Developments
- 17.2.1.5. Financials (Based on Availability)
- 17.2.2 Micro Focus International PLC
- 17.2.2.1. Overview
- 17.2.2.2. Products
- 17.2.2.3. SWOT Analysis
- 17.2.2.4. Recent Developments
- 17.2.2.5. Financials (Based on Availability)
- 17.2.3 Atlassian Corporation PLC
- 17.2.3.1. Overview
- 17.2.3.2. Products
- 17.2.3.3. SWOT Analysis
- 17.2.3.4. Recent Developments
- 17.2.3.5. Financials (Based on Availability)
- 17.2.4 IBM Corporation
- 17.2.4.1. Overview
- 17.2.4.2. Products
- 17.2.4.3. SWOT Analysis
- 17.2.4.4. Recent Developments
- 17.2.4.5. Financials (Based on Availability)
- 17.2.5 Freshworks Inc
- 17.2.5.1. Overview
- 17.2.5.2. Products
- 17.2.5.3. SWOT Analysis
- 17.2.5.4. Recent Developments
- 17.2.5.5. Financials (Based on Availability)
- 17.2.6 ServiceNow Inc *List Not Exhaustive
- 17.2.6.1. Overview
- 17.2.6.2. Products
- 17.2.6.3. SWOT Analysis
- 17.2.6.4. Recent Developments
- 17.2.6.5. Financials (Based on Availability)
- 17.2.7 Ivanti Inc
- 17.2.7.1. Overview
- 17.2.7.2. Products
- 17.2.7.3. SWOT Analysis
- 17.2.7.4. Recent Developments
- 17.2.7.5. Financials (Based on Availability)
- 17.2.8 Broadcom Inc
- 17.2.8.1. Overview
- 17.2.8.2. Products
- 17.2.8.3. SWOT Analysis
- 17.2.8.4. Recent Developments
- 17.2.8.5. Financials (Based on Availability)
- 17.2.9 BMC Software Inc (Kohlberg Kravis Roberts & Co LP )
- 17.2.9.1. Overview
- 17.2.9.2. Products
- 17.2.9.3. SWOT Analysis
- 17.2.9.4. Recent Developments
- 17.2.9.5. Financials (Based on Availability)
- 17.2.10 Axios Systems
- 17.2.10.1. Overview
- 17.2.10.2. Products
- 17.2.10.3. SWOT Analysis
- 17.2.10.4. Recent Developments
- 17.2.10.5. Financials (Based on Availability)
- 17.2.1 ASG Technologies Group Inc
List of Figures
- Figure 1: Global ITSM Industry Revenue Breakdown (Million, %) by Region 2024 & 2032
- Figure 2: North America ITSM Industry Revenue (Million), by Country 2024 & 2032
- Figure 3: North America ITSM Industry Revenue Share (%), by Country 2024 & 2032
- Figure 4: Europe ITSM Industry Revenue (Million), by Country 2024 & 2032
- Figure 5: Europe ITSM Industry Revenue Share (%), by Country 2024 & 2032
- Figure 6: Asia Pacific ITSM Industry Revenue (Million), by Country 2024 & 2032
- Figure 7: Asia Pacific ITSM Industry Revenue Share (%), by Country 2024 & 2032
- Figure 8: South America ITSM Industry Revenue (Million), by Country 2024 & 2032
- Figure 9: South America ITSM Industry Revenue Share (%), by Country 2024 & 2032
- Figure 10: North America ITSM Industry Revenue (Million), by Country 2024 & 2032
- Figure 11: North America ITSM Industry Revenue Share (%), by Country 2024 & 2032
- Figure 12: MEA ITSM Industry Revenue (Million), by Country 2024 & 2032
- Figure 13: MEA ITSM Industry Revenue Share (%), by Country 2024 & 2032
- Figure 14: North America ITSM Industry Revenue (Million), by Deployment 2024 & 2032
- Figure 15: North America ITSM Industry Revenue Share (%), by Deployment 2024 & 2032
- Figure 16: North America ITSM Industry Revenue (Million), by Application 2024 & 2032
- Figure 17: North America ITSM Industry Revenue Share (%), by Application 2024 & 2032
- Figure 18: North America ITSM Industry Revenue (Million), by End-user Industry 2024 & 2032
- Figure 19: North America ITSM Industry Revenue Share (%), by End-user Industry 2024 & 2032
- Figure 20: North America ITSM Industry Revenue (Million), by Country 2024 & 2032
- Figure 21: North America ITSM Industry Revenue Share (%), by Country 2024 & 2032
- Figure 22: Europe ITSM Industry Revenue (Million), by Deployment 2024 & 2032
- Figure 23: Europe ITSM Industry Revenue Share (%), by Deployment 2024 & 2032
- Figure 24: Europe ITSM Industry Revenue (Million), by Application 2024 & 2032
- Figure 25: Europe ITSM Industry Revenue Share (%), by Application 2024 & 2032
- Figure 26: Europe ITSM Industry Revenue (Million), by End-user Industry 2024 & 2032
- Figure 27: Europe ITSM Industry Revenue Share (%), by End-user Industry 2024 & 2032
- Figure 28: Europe ITSM Industry Revenue (Million), by Country 2024 & 2032
- Figure 29: Europe ITSM Industry Revenue Share (%), by Country 2024 & 2032
- Figure 30: Asia Pacific ITSM Industry Revenue (Million), by Deployment 2024 & 2032
- Figure 31: Asia Pacific ITSM Industry Revenue Share (%), by Deployment 2024 & 2032
- Figure 32: Asia Pacific ITSM Industry Revenue (Million), by Application 2024 & 2032
- Figure 33: Asia Pacific ITSM Industry Revenue Share (%), by Application 2024 & 2032
- Figure 34: Asia Pacific ITSM Industry Revenue (Million), by End-user Industry 2024 & 2032
- Figure 35: Asia Pacific ITSM Industry Revenue Share (%), by End-user Industry 2024 & 2032
- Figure 36: Asia Pacific ITSM Industry Revenue (Million), by Country 2024 & 2032
- Figure 37: Asia Pacific ITSM Industry Revenue Share (%), by Country 2024 & 2032
- Figure 38: Latin America ITSM Industry Revenue (Million), by Deployment 2024 & 2032
- Figure 39: Latin America ITSM Industry Revenue Share (%), by Deployment 2024 & 2032
- Figure 40: Latin America ITSM Industry Revenue (Million), by Application 2024 & 2032
- Figure 41: Latin America ITSM Industry Revenue Share (%), by Application 2024 & 2032
- Figure 42: Latin America ITSM Industry Revenue (Million), by End-user Industry 2024 & 2032
- Figure 43: Latin America ITSM Industry Revenue Share (%), by End-user Industry 2024 & 2032
- Figure 44: Latin America ITSM Industry Revenue (Million), by Country 2024 & 2032
- Figure 45: Latin America ITSM Industry Revenue Share (%), by Country 2024 & 2032
- Figure 46: Middle East and Africa ITSM Industry Revenue (Million), by Deployment 2024 & 2032
- Figure 47: Middle East and Africa ITSM Industry Revenue Share (%), by Deployment 2024 & 2032
- Figure 48: Middle East and Africa ITSM Industry Revenue (Million), by Application 2024 & 2032
- Figure 49: Middle East and Africa ITSM Industry Revenue Share (%), by Application 2024 & 2032
- Figure 50: Middle East and Africa ITSM Industry Revenue (Million), by End-user Industry 2024 & 2032
- Figure 51: Middle East and Africa ITSM Industry Revenue Share (%), by End-user Industry 2024 & 2032
- Figure 52: Middle East and Africa ITSM Industry Revenue (Million), by Country 2024 & 2032
- Figure 53: Middle East and Africa ITSM Industry Revenue Share (%), by Country 2024 & 2032
List of Tables
- Table 1: Global ITSM Industry Revenue Million Forecast, by Region 2019 & 2032
- Table 2: Global ITSM Industry Revenue Million Forecast, by Deployment 2019 & 2032
- Table 3: Global ITSM Industry Revenue Million Forecast, by Application 2019 & 2032
- Table 4: Global ITSM Industry Revenue Million Forecast, by End-user Industry 2019 & 2032
- Table 5: Global ITSM Industry Revenue Million Forecast, by Region 2019 & 2032
- Table 6: Global ITSM Industry Revenue Million Forecast, by Country 2019 & 2032
- Table 7: United States ITSM Industry Revenue (Million) Forecast, by Application 2019 & 2032
- Table 8: Canada ITSM Industry Revenue (Million) Forecast, by Application 2019 & 2032
- Table 9: Mexico ITSM Industry Revenue (Million) Forecast, by Application 2019 & 2032
- Table 10: Global ITSM Industry Revenue Million Forecast, by Country 2019 & 2032
- Table 11: Germany ITSM Industry Revenue (Million) Forecast, by Application 2019 & 2032
- Table 12: United Kingdom ITSM Industry Revenue (Million) Forecast, by Application 2019 & 2032
- Table 13: France ITSM Industry Revenue (Million) Forecast, by Application 2019 & 2032
- Table 14: Spain ITSM Industry Revenue (Million) Forecast, by Application 2019 & 2032
- Table 15: Italy ITSM Industry Revenue (Million) Forecast, by Application 2019 & 2032
- Table 16: Spain ITSM Industry Revenue (Million) Forecast, by Application 2019 & 2032
- Table 17: Belgium ITSM Industry Revenue (Million) Forecast, by Application 2019 & 2032
- Table 18: Netherland ITSM Industry Revenue (Million) Forecast, by Application 2019 & 2032
- Table 19: Nordics ITSM Industry Revenue (Million) Forecast, by Application 2019 & 2032
- Table 20: Rest of Europe ITSM Industry Revenue (Million) Forecast, by Application 2019 & 2032
- Table 21: Global ITSM Industry Revenue Million Forecast, by Country 2019 & 2032
- Table 22: China ITSM Industry Revenue (Million) Forecast, by Application 2019 & 2032
- Table 23: Japan ITSM Industry Revenue (Million) Forecast, by Application 2019 & 2032
- Table 24: India ITSM Industry Revenue (Million) Forecast, by Application 2019 & 2032
- Table 25: South Korea ITSM Industry Revenue (Million) Forecast, by Application 2019 & 2032
- Table 26: Southeast Asia ITSM Industry Revenue (Million) Forecast, by Application 2019 & 2032
- Table 27: Australia ITSM Industry Revenue (Million) Forecast, by Application 2019 & 2032
- Table 28: Indonesia ITSM Industry Revenue (Million) Forecast, by Application 2019 & 2032
- Table 29: Phillipes ITSM Industry Revenue (Million) Forecast, by Application 2019 & 2032
- Table 30: Singapore ITSM Industry Revenue (Million) Forecast, by Application 2019 & 2032
- Table 31: Thailandc ITSM Industry Revenue (Million) Forecast, by Application 2019 & 2032
- Table 32: Rest of Asia Pacific ITSM Industry Revenue (Million) Forecast, by Application 2019 & 2032
- Table 33: Global ITSM Industry Revenue Million Forecast, by Country 2019 & 2032
- Table 34: Brazil ITSM Industry Revenue (Million) Forecast, by Application 2019 & 2032
- Table 35: Argentina ITSM Industry Revenue (Million) Forecast, by Application 2019 & 2032
- Table 36: Peru ITSM Industry Revenue (Million) Forecast, by Application 2019 & 2032
- Table 37: Chile ITSM Industry Revenue (Million) Forecast, by Application 2019 & 2032
- Table 38: Colombia ITSM Industry Revenue (Million) Forecast, by Application 2019 & 2032
- Table 39: Ecuador ITSM Industry Revenue (Million) Forecast, by Application 2019 & 2032
- Table 40: Venezuela ITSM Industry Revenue (Million) Forecast, by Application 2019 & 2032
- Table 41: Rest of South America ITSM Industry Revenue (Million) Forecast, by Application 2019 & 2032
- Table 42: Global ITSM Industry Revenue Million Forecast, by Country 2019 & 2032
- Table 43: United States ITSM Industry Revenue (Million) Forecast, by Application 2019 & 2032
- Table 44: Canada ITSM Industry Revenue (Million) Forecast, by Application 2019 & 2032
- Table 45: Mexico ITSM Industry Revenue (Million) Forecast, by Application 2019 & 2032
- Table 46: Global ITSM Industry Revenue Million Forecast, by Country 2019 & 2032
- Table 47: United Arab Emirates ITSM Industry Revenue (Million) Forecast, by Application 2019 & 2032
- Table 48: Saudi Arabia ITSM Industry Revenue (Million) Forecast, by Application 2019 & 2032
- Table 49: South Africa ITSM Industry Revenue (Million) Forecast, by Application 2019 & 2032
- Table 50: Rest of Middle East and Africa ITSM Industry Revenue (Million) Forecast, by Application 2019 & 2032
- Table 51: Global ITSM Industry Revenue Million Forecast, by Deployment 2019 & 2032
- Table 52: Global ITSM Industry Revenue Million Forecast, by Application 2019 & 2032
- Table 53: Global ITSM Industry Revenue Million Forecast, by End-user Industry 2019 & 2032
- Table 54: Global ITSM Industry Revenue Million Forecast, by Country 2019 & 2032
- Table 55: Global ITSM Industry Revenue Million Forecast, by Deployment 2019 & 2032
- Table 56: Global ITSM Industry Revenue Million Forecast, by Application 2019 & 2032
- Table 57: Global ITSM Industry Revenue Million Forecast, by End-user Industry 2019 & 2032
- Table 58: Global ITSM Industry Revenue Million Forecast, by Country 2019 & 2032
- Table 59: Global ITSM Industry Revenue Million Forecast, by Deployment 2019 & 2032
- Table 60: Global ITSM Industry Revenue Million Forecast, by Application 2019 & 2032
- Table 61: Global ITSM Industry Revenue Million Forecast, by End-user Industry 2019 & 2032
- Table 62: Global ITSM Industry Revenue Million Forecast, by Country 2019 & 2032
- Table 63: Global ITSM Industry Revenue Million Forecast, by Deployment 2019 & 2032
- Table 64: Global ITSM Industry Revenue Million Forecast, by Application 2019 & 2032
- Table 65: Global ITSM Industry Revenue Million Forecast, by End-user Industry 2019 & 2032
- Table 66: Global ITSM Industry Revenue Million Forecast, by Country 2019 & 2032
- Table 67: Global ITSM Industry Revenue Million Forecast, by Deployment 2019 & 2032
- Table 68: Global ITSM Industry Revenue Million Forecast, by Application 2019 & 2032
- Table 69: Global ITSM Industry Revenue Million Forecast, by End-user Industry 2019 & 2032
- Table 70: Global ITSM Industry Revenue Million Forecast, by Country 2019 & 2032
Frequently Asked Questions
1. What is the projected Compound Annual Growth Rate (CAGR) of the ITSM Industry?
The projected CAGR is approximately 16.72%.
2. Which companies are prominent players in the ITSM Industry?
Key companies in the market include ASG Technologies Group Inc, Micro Focus International PLC, Atlassian Corporation PLC, IBM Corporation, Freshworks Inc, ServiceNow Inc *List Not Exhaustive, Ivanti Inc, Broadcom Inc, BMC Software Inc (Kohlberg Kravis Roberts & Co LP ), Axios Systems.
3. What are the main segments of the ITSM Industry?
The market segments include Deployment, Application, End-user Industry.
4. Can you provide details about the market size?
The market size is estimated to be USD 11 Million as of 2022.
5. What are some drivers contributing to market growth?
Rising Adoption of Updated IT Infrastructure Across End-user Industries; Increasing Demand for a Unified Platform to Manage and Monitor IT Infrastructure Performance.
6. What are the notable trends driving market growth?
The IT and Telecommunication Segment is Expected to Hold a Significant Market Share.
7. Are there any restraints impacting market growth?
Issues in ITSM Implementation and Lack of Quality Standards in Service-level Agreement.
8. Can you provide examples of recent developments in the market?
April 2024: 4me, which has a software platform that covers everything from agile development to managed service providers (MSPs), consolidated its position in the fiercely competitive IT service management (ITSM) market by acquiring StatusCast, a provider of cloud-based incident management products.
9. What pricing options are available for accessing the report?
Pricing options include single-user, multi-user, and enterprise licenses priced at USD 4750, USD 5250, and USD 8750 respectively.
10. Is the market size provided in terms of value or volume?
The market size is provided in terms of value, measured in Million.
11. Are there any specific market keywords associated with the report?
Yes, the market keyword associated with the report is "ITSM Industry," which aids in identifying and referencing the specific market segment covered.
12. How do I determine which pricing option suits my needs best?
The pricing options vary based on user requirements and access needs. Individual users may opt for single-user licenses, while businesses requiring broader access may choose multi-user or enterprise licenses for cost-effective access to the report.
13. Are there any additional resources or data provided in the ITSM Industry report?
While the report offers comprehensive insights, it's advisable to review the specific contents or supplementary materials provided to ascertain if additional resources or data are available.
14. How can I stay updated on further developments or reports in the ITSM Industry?
To stay informed about further developments, trends, and reports in the ITSM Industry, consider subscribing to industry newsletters, following relevant companies and organizations, or regularly checking reputable industry news sources and publications.
Methodology
Step 1 - Identification of Relevant Samples Size from Population Database


Step 2 - Approaches for Defining Global Market Size (Value, Volume* & Price*)

Note*: In applicable scenarios
Step 3 - Data Sources
Primary Research
- Web Analytics
- Survey Reports
- Research Institute
- Latest Research Reports
- Opinion Leaders
Secondary Research
- Annual Reports
- White Paper
- Latest Press Release
- Industry Association
- Paid Database
- Investor Presentations

Step 4 - Data Triangulation
Involves using different sources of information in order to increase the validity of a study
These sources are likely to be stakeholders in a program - participants, other researchers, program staff, other community members, and so on.
Then we put all data in single framework & apply various statistical tools to find out the dynamic on the market.
During the analysis stage, feedback from the stakeholder groups would be compared to determine areas of agreement as well as areas of divergence


