
Key Insights
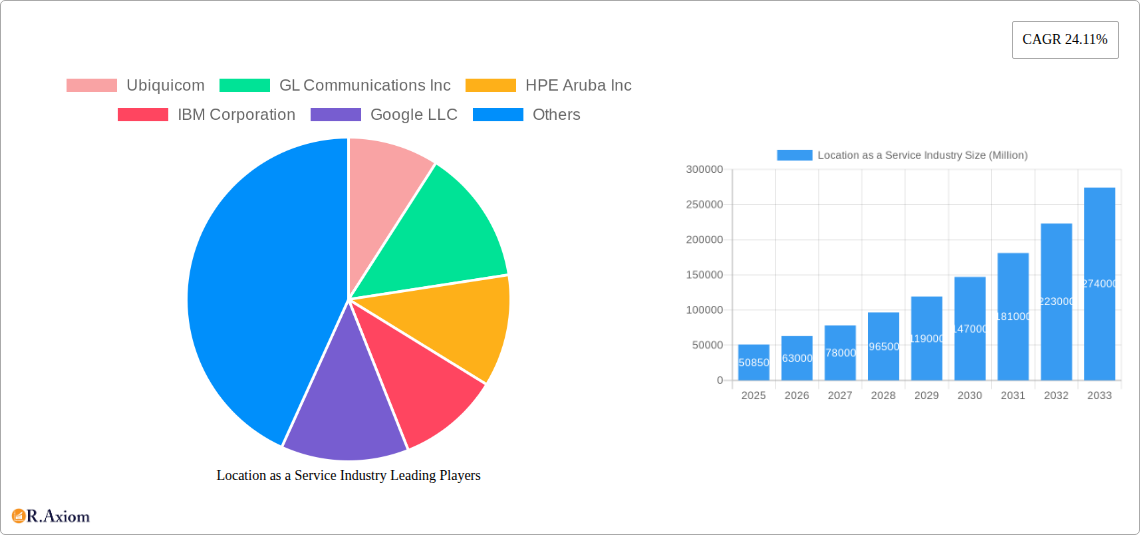
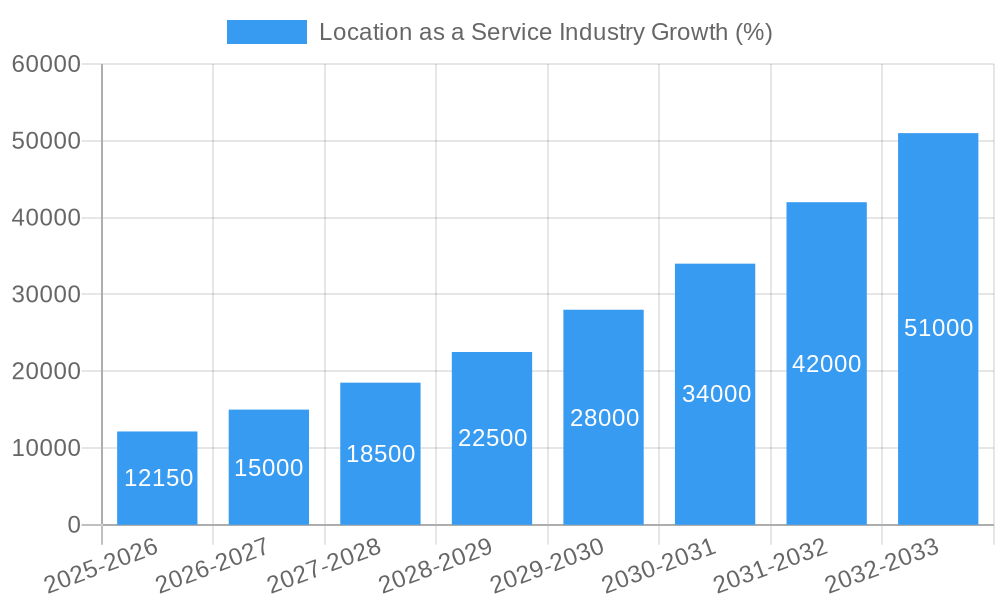
The Location as a Service (LaaS) industry is experiencing rapid growth, projected to reach a market size of $50.85 billion in 2025 and exhibiting a robust Compound Annual Growth Rate (CAGR) of 24.11%. This expansion is driven by several key factors. The increasing adoption of location-based services across diverse sectors, including FMCG, e-commerce, and retail, fuels the demand for precise and real-time location data. Furthermore, advancements in technologies like GPS, IoT, and AI are enhancing location accuracy and enabling the development of innovative applications, such as indoor navigation, asset tracking, and geofencing. The shift towards data-driven decision-making across industries also contributes significantly to LaaS market growth, as businesses leverage location intelligence for optimizing operations, improving customer experiences, and gaining a competitive edge. The market is segmented by location (indoor and outdoor), service type (professional and managed), and end-user industry, reflecting the diverse applications of LaaS across various sectors.
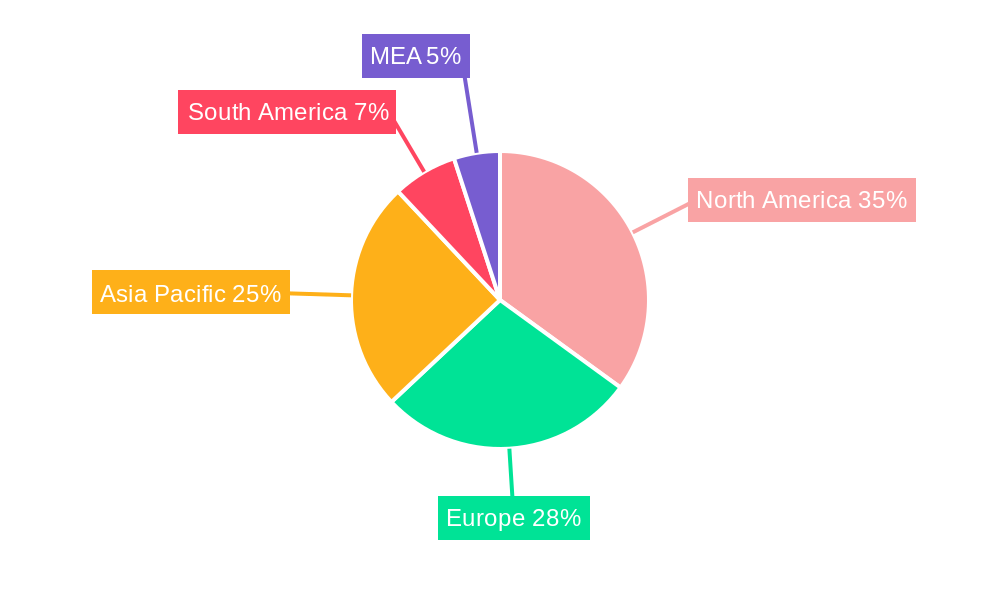
The growth trajectory is expected to continue throughout the forecast period (2025-2033), driven by increasing urbanization, the proliferation of smart devices, and the expanding adoption of cloud-based solutions. North America and Europe currently hold significant market shares, benefiting from advanced technological infrastructure and high adoption rates. However, the Asia-Pacific region is poised for substantial growth, fueled by rapid economic development and increasing smartphone penetration. While challenges such as data privacy concerns and the need for robust cybersecurity measures exist, the overall market outlook remains positive, with significant opportunities for LaaS providers to capitalize on the expanding demand for location-based services and innovative solutions across various industries and geographical regions. The competitive landscape is dynamic, with both established players and emerging startups vying for market share, fostering innovation and driving further growth within the industry.
Location as a Service (LaaS) Industry Market Report: 2019-2033
This comprehensive report provides a detailed analysis of the Location as a Service (LaaS) industry, covering market size, segmentation, key players, growth drivers, challenges, and future outlook. The report utilizes data from the historical period (2019-2024), the base year (2025), and forecasts the market's trajectory through the estimated year (2025) and forecast period (2025-2033). The total market value is projected to reach xx Million by 2033.
Location as a Service Industry Market Concentration & Innovation
The LaaS market is characterized by a moderately concentrated landscape with a few dominant players and numerous niche providers. While companies like Google LLC and HERE Global BV hold significant market share, smaller, specialized firms are innovating within specific segments. Market concentration is assessed through metrics like the Herfindahl-Hirschman Index (HHI) and market share analysis of top players (xx% combined market share estimated for the top 5 players in 2025). Innovation is driven by advancements in technologies such as GPS, IoT, AI, and machine learning. Regulatory frameworks, particularly concerning data privacy and security (GDPR, CCPA), significantly impact market dynamics. Product substitutes, such as traditional mapping services, are gradually losing relevance due to the enhanced precision and context-aware capabilities of LaaS. End-user trends favor integrated, real-time location solutions. Mergers and acquisitions (M&A) activity is moderate, with deal values averaging xx Million in recent years, primarily focused on consolidating market share and expanding technology portfolios. Notable M&A deals included: (specific examples with deal values if available; otherwise, state "Data unavailable").
- Market Share: Google LLC (xx%), HERE Global BV (xx%), Ubiquicom (xx%), others (xx%).
- M&A Activity: Average deal value: xx Million (2019-2024). Number of deals: xx.
Location as a Service Industry Industry Trends & Insights
The LaaS market is experiencing robust growth, driven by increased smartphone penetration, IoT device proliferation, and the rising demand for location-based services across diverse sectors. The compound annual growth rate (CAGR) is projected to be xx% during the forecast period (2025-2033). Technological disruptions, such as the adoption of 5G and advancements in sensor technology, are fueling market expansion. Consumer preferences are shifting towards personalized and context-aware location services. Competitive dynamics are characterized by innovation, strategic partnerships, and the continuous integration of new technologies. Market penetration across various industries is increasing, with significant uptake expected in sectors like transportation and logistics (xx% penetration by 2033), retail and e-commerce (xx% penetration by 2033), and healthcare (xx% penetration by 2033).
Dominant Markets & Segments in Location as a Service Industry
The LaaS market is dominated by the outdoor location segment, driven by the widespread adoption of GPS technology and its integration into smartphones and vehicles. However, the indoor location segment is witnessing rapid growth, fueled by the increasing demand for location-based services within buildings and infrastructure. The managed service segment holds a larger market share than the professional service segment, as businesses increasingly outsource their location-based service requirements. Within end-user industries, transportation and retail are currently the dominant segments, but healthcare and FMCG & e-commerce are expected to experience rapid growth in the coming years.
- Leading Regions/Countries: North America (xx Million), Europe (xx Million), Asia-Pacific (xx Million). (Specific country-level data if available).
- Key Drivers by Segment:
- Outdoor: Widespread GPS availability, smartphone penetration, advancements in mapping technologies.
- Indoor: Demand for location-based services in buildings, improved indoor positioning technologies (Wi-Fi, Bluetooth, UWB).
- Managed Services: Cost-effectiveness, expertise, scalability.
- Professional Services: Customization, specialized solutions.
- Transportation: Logistics optimization, fleet management, driver safety.
- Retail: Enhanced customer experience, targeted advertising, inventory management.
- Healthcare: Improved patient tracking, asset management, emergency response.
Location as a Service Industry Product Developments
Recent product innovations focus on enhancing accuracy, integrating AI for contextual understanding, and providing more comprehensive data analytics. This includes improved indoor positioning technologies like Ultra-Wideband (UWB), the use of AI for predictive analytics and personalized location-based services, and the development of advanced mapping solutions with 3D visualization. These innovations are tailored to meet diverse end-user needs, offering enhanced efficiency and improved decision-making. The competitive advantage lies in providing precise, reliable, and secure location data.
Report Scope & Segmentation Analysis
This report comprehensively analyzes the LaaS market across multiple segments:
By Location: Indoor and Outdoor segments are analyzed, examining their respective market sizes, growth rates, and competitive dynamics. The Outdoor segment currently dominates but the Indoor segment is exhibiting faster growth.
By Service Type: Managed and Professional services segments are analyzed, focusing on service models, pricing strategies, and market share. Managed services hold a larger market share.
By End-user Industry: FMCG and E-commerce, Retail, Healthcare, IT and Telecom, Transportation, Oil and Gas, and Other End-user Industries are examined, highlighting their specific location service requirements, growth prospects, and competitive intensity. Transportation and Retail are currently leading but growth is expected in Healthcare and FMCG/e-commerce.
Key Drivers of Location as a Service Industry Growth
Several factors contribute to the LaaS market's growth. Technological advancements, particularly in GPS, IoT, and AI, are improving accuracy, reliability, and the range of applications. Economic factors, such as increased investment in infrastructure and the rise of smart cities, are further boosting demand. Favorable regulatory environments in some regions are also encouraging adoption. The increasing adoption of mobile devices and the growth of location-based applications also play a role.
Challenges in the Location as a Service Industry Sector
Key challenges include data privacy concerns, the need for high-accuracy positioning, particularly indoors, and the complexity of integrating diverse location technologies. Regulatory hurdles, varying across different jurisdictions, can also hinder growth. Concerns around data security and potential misuse of location data are significant barriers. Supply chain disruptions impacting the availability of hardware components also pose a challenge. The presence of several established competitors further adds to the competitive pressure.
Emerging Opportunities in Location as a Service Industry
Emerging opportunities lie in the expansion of LaaS into new sectors, like agriculture and environmental monitoring. The integration of AI and machine learning offers scope for innovative applications. The increasing demand for real-time location tracking in various applications provides substantial opportunities for market expansion. The development of more sophisticated location-based analytics to provide deeper insights into user behavior can also fuel significant growth.
Leading Players in the Location as a Service Industry Market
- Ubiquicom
- GL Communications Inc
- HPE Aruba Inc
- IBM Corporation
- Google LLC
- Zebra Technologies Corporation
- Esri Technologies Ltd
- DigitalGlobe Inc (Maxar Technologies)
- Cisco Systems Inc
- Sewio Networks
- IndoorAtlas Ltd
- HID Global (Assa Abloy AB)
- Ericsson Inc
- Creativity Software Ltd
- ALE International
- Teldio Corporation
- HERE Global BV
Key Developments in Location as a Service Industry Industry
- May 2022: AT&T launched location-based routing with Intrado, improving public safety response for wireless 9-1-1 calls. This enhanced accuracy and speed of emergency response.
- January 2022: Catalina partnered with PlaceIQ to provide location-driven planning and measurement for CPG retailers. This improved targeted advertising and campaign effectiveness.
Strategic Outlook for Location as a Service Industry Market
The LaaS market is poised for continued strong growth driven by technological advancements, rising demand across diverse sectors, and the increasing adoption of location-based services. Opportunities for innovation, particularly in AI-powered solutions and the expansion into new market segments, will shape future market dynamics. The integration of LaaS into broader digital ecosystems will create further growth catalysts.
Location as a Service Industry Segmentation
-
1. Location
- 1.1. Indoor
- 1.2. Outdoor
-
2. Service Type
- 2.1. Professional
- 2.2. Managed
-
3. End-user Industry
- 3.1. FMCG and E-commerce
- 3.2. Retail
- 3.3. Healthcare
- 3.4. IT and Telecom
- 3.5. Transportation
- 3.6. Oil and Gas
- 3.7. Other End-user Industries
Location as a Service Industry Segmentation By Geography
-
1. North America
- 1.1. United States
- 1.2. Canada
-
2. Europe
- 2.1. United Kingdom
- 2.2. Germany
- 2.3. France
- 2.4. Rest of Europe
-
3. Asia Pacific
- 3.1. China
- 3.2. Japan
- 3.3. India
- 3.4. Rest of Asia Pacific
- 4. Rest of the World
Location as a Service Industry REPORT HIGHLIGHTS
| Aspects | Details |
|---|---|
| Study Period | 2019-2033 |
| Base Year | 2024 |
| Estimated Year | 2025 |
| Forecast Period | 2025-2033 |
| Historical Period | 2019-2024 |
| Growth Rate | CAGR of 24.11% from 2019-2033 |
| Segmentation |
|
Table of Contents
- 1. Introduction
- 1.1. Research Scope
- 1.2. Market Segmentation
- 1.3. Research Methodology
- 1.4. Definitions and Assumptions
- 2. Executive Summary
- 2.1. Introduction
- 3. Market Dynamics
- 3.1. Introduction
- 3.2. Market Drivers
- 3.2.1. Growing Demand for Geo-based Marketing; Technological Advancements Aided by Emergence of BLE and UWB for Indoor Services; Emerging Use-cases for LBS due to High Penetration of Social Media and Location-based App Adoption
- 3.3. Market Restrains
- 3.3.1. Trade-offs Between Privacy/Security and Regulatory Constraints
- 3.4. Market Trends
- 3.4.1. FMCG and E-Commerce Sector Expected to Witness Significant Growth
- 4. Market Factor Analysis
- 4.1. Porters Five Forces
- 4.2. Supply/Value Chain
- 4.3. PESTEL analysis
- 4.4. Market Entropy
- 4.5. Patent/Trademark Analysis
- 5. Global Location as a Service Industry Analysis, Insights and Forecast, 2019-2031
- 5.1. Market Analysis, Insights and Forecast - by Location
- 5.1.1. Indoor
- 5.1.2. Outdoor
- 5.2. Market Analysis, Insights and Forecast - by Service Type
- 5.2.1. Professional
- 5.2.2. Managed
- 5.3. Market Analysis, Insights and Forecast - by End-user Industry
- 5.3.1. FMCG and E-commerce
- 5.3.2. Retail
- 5.3.3. Healthcare
- 5.3.4. IT and Telecom
- 5.3.5. Transportation
- 5.3.6. Oil and Gas
- 5.3.7. Other End-user Industries
- 5.4. Market Analysis, Insights and Forecast - by Region
- 5.4.1. North America
- 5.4.2. Europe
- 5.4.3. Asia Pacific
- 5.4.4. Rest of the World
- 5.1. Market Analysis, Insights and Forecast - by Location
- 6. North America Location as a Service Industry Analysis, Insights and Forecast, 2019-2031
- 6.1. Market Analysis, Insights and Forecast - by Location
- 6.1.1. Indoor
- 6.1.2. Outdoor
- 6.2. Market Analysis, Insights and Forecast - by Service Type
- 6.2.1. Professional
- 6.2.2. Managed
- 6.3. Market Analysis, Insights and Forecast - by End-user Industry
- 6.3.1. FMCG and E-commerce
- 6.3.2. Retail
- 6.3.3. Healthcare
- 6.3.4. IT and Telecom
- 6.3.5. Transportation
- 6.3.6. Oil and Gas
- 6.3.7. Other End-user Industries
- 6.1. Market Analysis, Insights and Forecast - by Location
- 7. Europe Location as a Service Industry Analysis, Insights and Forecast, 2019-2031
- 7.1. Market Analysis, Insights and Forecast - by Location
- 7.1.1. Indoor
- 7.1.2. Outdoor
- 7.2. Market Analysis, Insights and Forecast - by Service Type
- 7.2.1. Professional
- 7.2.2. Managed
- 7.3. Market Analysis, Insights and Forecast - by End-user Industry
- 7.3.1. FMCG and E-commerce
- 7.3.2. Retail
- 7.3.3. Healthcare
- 7.3.4. IT and Telecom
- 7.3.5. Transportation
- 7.3.6. Oil and Gas
- 7.3.7. Other End-user Industries
- 7.1. Market Analysis, Insights and Forecast - by Location
- 8. Asia Pacific Location as a Service Industry Analysis, Insights and Forecast, 2019-2031
- 8.1. Market Analysis, Insights and Forecast - by Location
- 8.1.1. Indoor
- 8.1.2. Outdoor
- 8.2. Market Analysis, Insights and Forecast - by Service Type
- 8.2.1. Professional
- 8.2.2. Managed
- 8.3. Market Analysis, Insights and Forecast - by End-user Industry
- 8.3.1. FMCG and E-commerce
- 8.3.2. Retail
- 8.3.3. Healthcare
- 8.3.4. IT and Telecom
- 8.3.5. Transportation
- 8.3.6. Oil and Gas
- 8.3.7. Other End-user Industries
- 8.1. Market Analysis, Insights and Forecast - by Location
- 9. Rest of the World Location as a Service Industry Analysis, Insights and Forecast, 2019-2031
- 9.1. Market Analysis, Insights and Forecast - by Location
- 9.1.1. Indoor
- 9.1.2. Outdoor
- 9.2. Market Analysis, Insights and Forecast - by Service Type
- 9.2.1. Professional
- 9.2.2. Managed
- 9.3. Market Analysis, Insights and Forecast - by End-user Industry
- 9.3.1. FMCG and E-commerce
- 9.3.2. Retail
- 9.3.3. Healthcare
- 9.3.4. IT and Telecom
- 9.3.5. Transportation
- 9.3.6. Oil and Gas
- 9.3.7. Other End-user Industries
- 9.1. Market Analysis, Insights and Forecast - by Location
- 10. North America Location as a Service Industry Analysis, Insights and Forecast, 2019-2031
- 10.1. Market Analysis, Insights and Forecast - By Country/Sub-region
- 10.1.1 United States
- 10.1.2 Canada
- 10.1.3 Mexico
- 11. Europe Location as a Service Industry Analysis, Insights and Forecast, 2019-2031
- 11.1. Market Analysis, Insights and Forecast - By Country/Sub-region
- 11.1.1 Germany
- 11.1.2 United Kingdom
- 11.1.3 France
- 11.1.4 Spain
- 11.1.5 Italy
- 11.1.6 Spain
- 11.1.7 Belgium
- 11.1.8 Netherland
- 11.1.9 Nordics
- 11.1.10 Rest of Europe
- 12. Asia Pacific Location as a Service Industry Analysis, Insights and Forecast, 2019-2031
- 12.1. Market Analysis, Insights and Forecast - By Country/Sub-region
- 12.1.1 China
- 12.1.2 Japan
- 12.1.3 India
- 12.1.4 South Korea
- 12.1.5 Southeast Asia
- 12.1.6 Australia
- 12.1.7 Indonesia
- 12.1.8 Phillipes
- 12.1.9 Singapore
- 12.1.10 Thailandc
- 12.1.11 Rest of Asia Pacific
- 13. South America Location as a Service Industry Analysis, Insights and Forecast, 2019-2031
- 13.1. Market Analysis, Insights and Forecast - By Country/Sub-region
- 13.1.1 Brazil
- 13.1.2 Argentina
- 13.1.3 Peru
- 13.1.4 Chile
- 13.1.5 Colombia
- 13.1.6 Ecuador
- 13.1.7 Venezuela
- 13.1.8 Rest of South America
- 14. North America Location as a Service Industry Analysis, Insights and Forecast, 2019-2031
- 14.1. Market Analysis, Insights and Forecast - By Country/Sub-region
- 14.1.1 United States
- 14.1.2 Canada
- 14.1.3 Mexico
- 15. MEA Location as a Service Industry Analysis, Insights and Forecast, 2019-2031
- 15.1. Market Analysis, Insights and Forecast - By Country/Sub-region
- 15.1.1 United Arab Emirates
- 15.1.2 Saudi Arabia
- 15.1.3 South Africa
- 15.1.4 Rest of Middle East and Africa
- 16. Competitive Analysis
- 16.1. Global Market Share Analysis 2024
- 16.2. Company Profiles
- 16.2.1 Ubiquicom
- 16.2.1.1. Overview
- 16.2.1.2. Products
- 16.2.1.3. SWOT Analysis
- 16.2.1.4. Recent Developments
- 16.2.1.5. Financials (Based on Availability)
- 16.2.2 GL Communications Inc
- 16.2.2.1. Overview
- 16.2.2.2. Products
- 16.2.2.3. SWOT Analysis
- 16.2.2.4. Recent Developments
- 16.2.2.5. Financials (Based on Availability)
- 16.2.3 HPE Aruba Inc
- 16.2.3.1. Overview
- 16.2.3.2. Products
- 16.2.3.3. SWOT Analysis
- 16.2.3.4. Recent Developments
- 16.2.3.5. Financials (Based on Availability)
- 16.2.4 IBM Corporation
- 16.2.4.1. Overview
- 16.2.4.2. Products
- 16.2.4.3. SWOT Analysis
- 16.2.4.4. Recent Developments
- 16.2.4.5. Financials (Based on Availability)
- 16.2.5 Google LLC
- 16.2.5.1. Overview
- 16.2.5.2. Products
- 16.2.5.3. SWOT Analysis
- 16.2.5.4. Recent Developments
- 16.2.5.5. Financials (Based on Availability)
- 16.2.6 Zebra Technologies Corporation
- 16.2.6.1. Overview
- 16.2.6.2. Products
- 16.2.6.3. SWOT Analysis
- 16.2.6.4. Recent Developments
- 16.2.6.5. Financials (Based on Availability)
- 16.2.7 Esri Technologies Ltd
- 16.2.7.1. Overview
- 16.2.7.2. Products
- 16.2.7.3. SWOT Analysis
- 16.2.7.4. Recent Developments
- 16.2.7.5. Financials (Based on Availability)
- 16.2.8 DigitalGlobe Inc (Maxar Technologies )
- 16.2.8.1. Overview
- 16.2.8.2. Products
- 16.2.8.3. SWOT Analysis
- 16.2.8.4. Recent Developments
- 16.2.8.5. Financials (Based on Availability)
- 16.2.9 Cisco Systems Inc
- 16.2.9.1. Overview
- 16.2.9.2. Products
- 16.2.9.3. SWOT Analysis
- 16.2.9.4. Recent Developments
- 16.2.9.5. Financials (Based on Availability)
- 16.2.10 Sewio Networks
- 16.2.10.1. Overview
- 16.2.10.2. Products
- 16.2.10.3. SWOT Analysis
- 16.2.10.4. Recent Developments
- 16.2.10.5. Financials (Based on Availability)
- 16.2.11 IndoorAtlas Ltd
- 16.2.11.1. Overview
- 16.2.11.2. Products
- 16.2.11.3. SWOT Analysis
- 16.2.11.4. Recent Developments
- 16.2.11.5. Financials (Based on Availability)
- 16.2.12 HID Global (Assa Abloy AB)
- 16.2.12.1. Overview
- 16.2.12.2. Products
- 16.2.12.3. SWOT Analysis
- 16.2.12.4. Recent Developments
- 16.2.12.5. Financials (Based on Availability)
- 16.2.13 Ericsson Inc
- 16.2.13.1. Overview
- 16.2.13.2. Products
- 16.2.13.3. SWOT Analysis
- 16.2.13.4. Recent Developments
- 16.2.13.5. Financials (Based on Availability)
- 16.2.14 Creativity Software Ltd
- 16.2.14.1. Overview
- 16.2.14.2. Products
- 16.2.14.3. SWOT Analysis
- 16.2.14.4. Recent Developments
- 16.2.14.5. Financials (Based on Availability)
- 16.2.15 ALE International
- 16.2.15.1. Overview
- 16.2.15.2. Products
- 16.2.15.3. SWOT Analysis
- 16.2.15.4. Recent Developments
- 16.2.15.5. Financials (Based on Availability)
- 16.2.16 Teldio Corporation
- 16.2.16.1. Overview
- 16.2.16.2. Products
- 16.2.16.3. SWOT Analysis
- 16.2.16.4. Recent Developments
- 16.2.16.5. Financials (Based on Availability)
- 16.2.17 HERE Global BV
- 16.2.17.1. Overview
- 16.2.17.2. Products
- 16.2.17.3. SWOT Analysis
- 16.2.17.4. Recent Developments
- 16.2.17.5. Financials (Based on Availability)
- 16.2.1 Ubiquicom
List of Figures
- Figure 1: Global Location as a Service Industry Revenue Breakdown (Million, %) by Region 2024 & 2032
- Figure 2: Global Location as a Service Industry Volume Breakdown (K Unit, %) by Region 2024 & 2032
- Figure 3: North America Location as a Service Industry Revenue (Million), by Country 2024 & 2032
- Figure 4: North America Location as a Service Industry Volume (K Unit), by Country 2024 & 2032
- Figure 5: North America Location as a Service Industry Revenue Share (%), by Country 2024 & 2032
- Figure 6: North America Location as a Service Industry Volume Share (%), by Country 2024 & 2032
- Figure 7: Europe Location as a Service Industry Revenue (Million), by Country 2024 & 2032
- Figure 8: Europe Location as a Service Industry Volume (K Unit), by Country 2024 & 2032
- Figure 9: Europe Location as a Service Industry Revenue Share (%), by Country 2024 & 2032
- Figure 10: Europe Location as a Service Industry Volume Share (%), by Country 2024 & 2032
- Figure 11: Asia Pacific Location as a Service Industry Revenue (Million), by Country 2024 & 2032
- Figure 12: Asia Pacific Location as a Service Industry Volume (K Unit), by Country 2024 & 2032
- Figure 13: Asia Pacific Location as a Service Industry Revenue Share (%), by Country 2024 & 2032
- Figure 14: Asia Pacific Location as a Service Industry Volume Share (%), by Country 2024 & 2032
- Figure 15: South America Location as a Service Industry Revenue (Million), by Country 2024 & 2032
- Figure 16: South America Location as a Service Industry Volume (K Unit), by Country 2024 & 2032
- Figure 17: South America Location as a Service Industry Revenue Share (%), by Country 2024 & 2032
- Figure 18: South America Location as a Service Industry Volume Share (%), by Country 2024 & 2032
- Figure 19: North America Location as a Service Industry Revenue (Million), by Country 2024 & 2032
- Figure 20: North America Location as a Service Industry Volume (K Unit), by Country 2024 & 2032
- Figure 21: North America Location as a Service Industry Revenue Share (%), by Country 2024 & 2032
- Figure 22: North America Location as a Service Industry Volume Share (%), by Country 2024 & 2032
- Figure 23: MEA Location as a Service Industry Revenue (Million), by Country 2024 & 2032
- Figure 24: MEA Location as a Service Industry Volume (K Unit), by Country 2024 & 2032
- Figure 25: MEA Location as a Service Industry Revenue Share (%), by Country 2024 & 2032
- Figure 26: MEA Location as a Service Industry Volume Share (%), by Country 2024 & 2032
- Figure 27: North America Location as a Service Industry Revenue (Million), by Location 2024 & 2032
- Figure 28: North America Location as a Service Industry Volume (K Unit), by Location 2024 & 2032
- Figure 29: North America Location as a Service Industry Revenue Share (%), by Location 2024 & 2032
- Figure 30: North America Location as a Service Industry Volume Share (%), by Location 2024 & 2032
- Figure 31: North America Location as a Service Industry Revenue (Million), by Service Type 2024 & 2032
- Figure 32: North America Location as a Service Industry Volume (K Unit), by Service Type 2024 & 2032
- Figure 33: North America Location as a Service Industry Revenue Share (%), by Service Type 2024 & 2032
- Figure 34: North America Location as a Service Industry Volume Share (%), by Service Type 2024 & 2032
- Figure 35: North America Location as a Service Industry Revenue (Million), by End-user Industry 2024 & 2032
- Figure 36: North America Location as a Service Industry Volume (K Unit), by End-user Industry 2024 & 2032
- Figure 37: North America Location as a Service Industry Revenue Share (%), by End-user Industry 2024 & 2032
- Figure 38: North America Location as a Service Industry Volume Share (%), by End-user Industry 2024 & 2032
- Figure 39: North America Location as a Service Industry Revenue (Million), by Country 2024 & 2032
- Figure 40: North America Location as a Service Industry Volume (K Unit), by Country 2024 & 2032
- Figure 41: North America Location as a Service Industry Revenue Share (%), by Country 2024 & 2032
- Figure 42: North America Location as a Service Industry Volume Share (%), by Country 2024 & 2032
- Figure 43: Europe Location as a Service Industry Revenue (Million), by Location 2024 & 2032
- Figure 44: Europe Location as a Service Industry Volume (K Unit), by Location 2024 & 2032
- Figure 45: Europe Location as a Service Industry Revenue Share (%), by Location 2024 & 2032
- Figure 46: Europe Location as a Service Industry Volume Share (%), by Location 2024 & 2032
- Figure 47: Europe Location as a Service Industry Revenue (Million), by Service Type 2024 & 2032
- Figure 48: Europe Location as a Service Industry Volume (K Unit), by Service Type 2024 & 2032
- Figure 49: Europe Location as a Service Industry Revenue Share (%), by Service Type 2024 & 2032
- Figure 50: Europe Location as a Service Industry Volume Share (%), by Service Type 2024 & 2032
- Figure 51: Europe Location as a Service Industry Revenue (Million), by End-user Industry 2024 & 2032
- Figure 52: Europe Location as a Service Industry Volume (K Unit), by End-user Industry 2024 & 2032
- Figure 53: Europe Location as a Service Industry Revenue Share (%), by End-user Industry 2024 & 2032
- Figure 54: Europe Location as a Service Industry Volume Share (%), by End-user Industry 2024 & 2032
- Figure 55: Europe Location as a Service Industry Revenue (Million), by Country 2024 & 2032
- Figure 56: Europe Location as a Service Industry Volume (K Unit), by Country 2024 & 2032
- Figure 57: Europe Location as a Service Industry Revenue Share (%), by Country 2024 & 2032
- Figure 58: Europe Location as a Service Industry Volume Share (%), by Country 2024 & 2032
- Figure 59: Asia Pacific Location as a Service Industry Revenue (Million), by Location 2024 & 2032
- Figure 60: Asia Pacific Location as a Service Industry Volume (K Unit), by Location 2024 & 2032
- Figure 61: Asia Pacific Location as a Service Industry Revenue Share (%), by Location 2024 & 2032
- Figure 62: Asia Pacific Location as a Service Industry Volume Share (%), by Location 2024 & 2032
- Figure 63: Asia Pacific Location as a Service Industry Revenue (Million), by Service Type 2024 & 2032
- Figure 64: Asia Pacific Location as a Service Industry Volume (K Unit), by Service Type 2024 & 2032
- Figure 65: Asia Pacific Location as a Service Industry Revenue Share (%), by Service Type 2024 & 2032
- Figure 66: Asia Pacific Location as a Service Industry Volume Share (%), by Service Type 2024 & 2032
- Figure 67: Asia Pacific Location as a Service Industry Revenue (Million), by End-user Industry 2024 & 2032
- Figure 68: Asia Pacific Location as a Service Industry Volume (K Unit), by End-user Industry 2024 & 2032
- Figure 69: Asia Pacific Location as a Service Industry Revenue Share (%), by End-user Industry 2024 & 2032
- Figure 70: Asia Pacific Location as a Service Industry Volume Share (%), by End-user Industry 2024 & 2032
- Figure 71: Asia Pacific Location as a Service Industry Revenue (Million), by Country 2024 & 2032
- Figure 72: Asia Pacific Location as a Service Industry Volume (K Unit), by Country 2024 & 2032
- Figure 73: Asia Pacific Location as a Service Industry Revenue Share (%), by Country 2024 & 2032
- Figure 74: Asia Pacific Location as a Service Industry Volume Share (%), by Country 2024 & 2032
- Figure 75: Rest of the World Location as a Service Industry Revenue (Million), by Location 2024 & 2032
- Figure 76: Rest of the World Location as a Service Industry Volume (K Unit), by Location 2024 & 2032
- Figure 77: Rest of the World Location as a Service Industry Revenue Share (%), by Location 2024 & 2032
- Figure 78: Rest of the World Location as a Service Industry Volume Share (%), by Location 2024 & 2032
- Figure 79: Rest of the World Location as a Service Industry Revenue (Million), by Service Type 2024 & 2032
- Figure 80: Rest of the World Location as a Service Industry Volume (K Unit), by Service Type 2024 & 2032
- Figure 81: Rest of the World Location as a Service Industry Revenue Share (%), by Service Type 2024 & 2032
- Figure 82: Rest of the World Location as a Service Industry Volume Share (%), by Service Type 2024 & 2032
- Figure 83: Rest of the World Location as a Service Industry Revenue (Million), by End-user Industry 2024 & 2032
- Figure 84: Rest of the World Location as a Service Industry Volume (K Unit), by End-user Industry 2024 & 2032
- Figure 85: Rest of the World Location as a Service Industry Revenue Share (%), by End-user Industry 2024 & 2032
- Figure 86: Rest of the World Location as a Service Industry Volume Share (%), by End-user Industry 2024 & 2032
- Figure 87: Rest of the World Location as a Service Industry Revenue (Million), by Country 2024 & 2032
- Figure 88: Rest of the World Location as a Service Industry Volume (K Unit), by Country 2024 & 2032
- Figure 89: Rest of the World Location as a Service Industry Revenue Share (%), by Country 2024 & 2032
- Figure 90: Rest of the World Location as a Service Industry Volume Share (%), by Country 2024 & 2032
List of Tables
- Table 1: Global Location as a Service Industry Revenue Million Forecast, by Region 2019 & 2032
- Table 2: Global Location as a Service Industry Volume K Unit Forecast, by Region 2019 & 2032
- Table 3: Global Location as a Service Industry Revenue Million Forecast, by Location 2019 & 2032
- Table 4: Global Location as a Service Industry Volume K Unit Forecast, by Location 2019 & 2032
- Table 5: Global Location as a Service Industry Revenue Million Forecast, by Service Type 2019 & 2032
- Table 6: Global Location as a Service Industry Volume K Unit Forecast, by Service Type 2019 & 2032
- Table 7: Global Location as a Service Industry Revenue Million Forecast, by End-user Industry 2019 & 2032
- Table 8: Global Location as a Service Industry Volume K Unit Forecast, by End-user Industry 2019 & 2032
- Table 9: Global Location as a Service Industry Revenue Million Forecast, by Region 2019 & 2032
- Table 10: Global Location as a Service Industry Volume K Unit Forecast, by Region 2019 & 2032
- Table 11: Global Location as a Service Industry Revenue Million Forecast, by Country 2019 & 2032
- Table 12: Global Location as a Service Industry Volume K Unit Forecast, by Country 2019 & 2032
- Table 13: United States Location as a Service Industry Revenue (Million) Forecast, by Application 2019 & 2032
- Table 14: United States Location as a Service Industry Volume (K Unit) Forecast, by Application 2019 & 2032
- Table 15: Canada Location as a Service Industry Revenue (Million) Forecast, by Application 2019 & 2032
- Table 16: Canada Location as a Service Industry Volume (K Unit) Forecast, by Application 2019 & 2032
- Table 17: Mexico Location as a Service Industry Revenue (Million) Forecast, by Application 2019 & 2032
- Table 18: Mexico Location as a Service Industry Volume (K Unit) Forecast, by Application 2019 & 2032
- Table 19: Global Location as a Service Industry Revenue Million Forecast, by Country 2019 & 2032
- Table 20: Global Location as a Service Industry Volume K Unit Forecast, by Country 2019 & 2032
- Table 21: Germany Location as a Service Industry Revenue (Million) Forecast, by Application 2019 & 2032
- Table 22: Germany Location as a Service Industry Volume (K Unit) Forecast, by Application 2019 & 2032
- Table 23: United Kingdom Location as a Service Industry Revenue (Million) Forecast, by Application 2019 & 2032
- Table 24: United Kingdom Location as a Service Industry Volume (K Unit) Forecast, by Application 2019 & 2032
- Table 25: France Location as a Service Industry Revenue (Million) Forecast, by Application 2019 & 2032
- Table 26: France Location as a Service Industry Volume (K Unit) Forecast, by Application 2019 & 2032
- Table 27: Spain Location as a Service Industry Revenue (Million) Forecast, by Application 2019 & 2032
- Table 28: Spain Location as a Service Industry Volume (K Unit) Forecast, by Application 2019 & 2032
- Table 29: Italy Location as a Service Industry Revenue (Million) Forecast, by Application 2019 & 2032
- Table 30: Italy Location as a Service Industry Volume (K Unit) Forecast, by Application 2019 & 2032
- Table 31: Spain Location as a Service Industry Revenue (Million) Forecast, by Application 2019 & 2032
- Table 32: Spain Location as a Service Industry Volume (K Unit) Forecast, by Application 2019 & 2032
- Table 33: Belgium Location as a Service Industry Revenue (Million) Forecast, by Application 2019 & 2032
- Table 34: Belgium Location as a Service Industry Volume (K Unit) Forecast, by Application 2019 & 2032
- Table 35: Netherland Location as a Service Industry Revenue (Million) Forecast, by Application 2019 & 2032
- Table 36: Netherland Location as a Service Industry Volume (K Unit) Forecast, by Application 2019 & 2032
- Table 37: Nordics Location as a Service Industry Revenue (Million) Forecast, by Application 2019 & 2032
- Table 38: Nordics Location as a Service Industry Volume (K Unit) Forecast, by Application 2019 & 2032
- Table 39: Rest of Europe Location as a Service Industry Revenue (Million) Forecast, by Application 2019 & 2032
- Table 40: Rest of Europe Location as a Service Industry Volume (K Unit) Forecast, by Application 2019 & 2032
- Table 41: Global Location as a Service Industry Revenue Million Forecast, by Country 2019 & 2032
- Table 42: Global Location as a Service Industry Volume K Unit Forecast, by Country 2019 & 2032
- Table 43: China Location as a Service Industry Revenue (Million) Forecast, by Application 2019 & 2032
- Table 44: China Location as a Service Industry Volume (K Unit) Forecast, by Application 2019 & 2032
- Table 45: Japan Location as a Service Industry Revenue (Million) Forecast, by Application 2019 & 2032
- Table 46: Japan Location as a Service Industry Volume (K Unit) Forecast, by Application 2019 & 2032
- Table 47: India Location as a Service Industry Revenue (Million) Forecast, by Application 2019 & 2032
- Table 48: India Location as a Service Industry Volume (K Unit) Forecast, by Application 2019 & 2032
- Table 49: South Korea Location as a Service Industry Revenue (Million) Forecast, by Application 2019 & 2032
- Table 50: South Korea Location as a Service Industry Volume (K Unit) Forecast, by Application 2019 & 2032
- Table 51: Southeast Asia Location as a Service Industry Revenue (Million) Forecast, by Application 2019 & 2032
- Table 52: Southeast Asia Location as a Service Industry Volume (K Unit) Forecast, by Application 2019 & 2032
- Table 53: Australia Location as a Service Industry Revenue (Million) Forecast, by Application 2019 & 2032
- Table 54: Australia Location as a Service Industry Volume (K Unit) Forecast, by Application 2019 & 2032
- Table 55: Indonesia Location as a Service Industry Revenue (Million) Forecast, by Application 2019 & 2032
- Table 56: Indonesia Location as a Service Industry Volume (K Unit) Forecast, by Application 2019 & 2032
- Table 57: Phillipes Location as a Service Industry Revenue (Million) Forecast, by Application 2019 & 2032
- Table 58: Phillipes Location as a Service Industry Volume (K Unit) Forecast, by Application 2019 & 2032
- Table 59: Singapore Location as a Service Industry Revenue (Million) Forecast, by Application 2019 & 2032
- Table 60: Singapore Location as a Service Industry Volume (K Unit) Forecast, by Application 2019 & 2032
- Table 61: Thailandc Location as a Service Industry Revenue (Million) Forecast, by Application 2019 & 2032
- Table 62: Thailandc Location as a Service Industry Volume (K Unit) Forecast, by Application 2019 & 2032
- Table 63: Rest of Asia Pacific Location as a Service Industry Revenue (Million) Forecast, by Application 2019 & 2032
- Table 64: Rest of Asia Pacific Location as a Service Industry Volume (K Unit) Forecast, by Application 2019 & 2032
- Table 65: Global Location as a Service Industry Revenue Million Forecast, by Country 2019 & 2032
- Table 66: Global Location as a Service Industry Volume K Unit Forecast, by Country 2019 & 2032
- Table 67: Brazil Location as a Service Industry Revenue (Million) Forecast, by Application 2019 & 2032
- Table 68: Brazil Location as a Service Industry Volume (K Unit) Forecast, by Application 2019 & 2032
- Table 69: Argentina Location as a Service Industry Revenue (Million) Forecast, by Application 2019 & 2032
- Table 70: Argentina Location as a Service Industry Volume (K Unit) Forecast, by Application 2019 & 2032
- Table 71: Peru Location as a Service Industry Revenue (Million) Forecast, by Application 2019 & 2032
- Table 72: Peru Location as a Service Industry Volume (K Unit) Forecast, by Application 2019 & 2032
- Table 73: Chile Location as a Service Industry Revenue (Million) Forecast, by Application 2019 & 2032
- Table 74: Chile Location as a Service Industry Volume (K Unit) Forecast, by Application 2019 & 2032
- Table 75: Colombia Location as a Service Industry Revenue (Million) Forecast, by Application 2019 & 2032
- Table 76: Colombia Location as a Service Industry Volume (K Unit) Forecast, by Application 2019 & 2032
- Table 77: Ecuador Location as a Service Industry Revenue (Million) Forecast, by Application 2019 & 2032
- Table 78: Ecuador Location as a Service Industry Volume (K Unit) Forecast, by Application 2019 & 2032
- Table 79: Venezuela Location as a Service Industry Revenue (Million) Forecast, by Application 2019 & 2032
- Table 80: Venezuela Location as a Service Industry Volume (K Unit) Forecast, by Application 2019 & 2032
- Table 81: Rest of South America Location as a Service Industry Revenue (Million) Forecast, by Application 2019 & 2032
- Table 82: Rest of South America Location as a Service Industry Volume (K Unit) Forecast, by Application 2019 & 2032
- Table 83: Global Location as a Service Industry Revenue Million Forecast, by Country 2019 & 2032
- Table 84: Global Location as a Service Industry Volume K Unit Forecast, by Country 2019 & 2032
- Table 85: United States Location as a Service Industry Revenue (Million) Forecast, by Application 2019 & 2032
- Table 86: United States Location as a Service Industry Volume (K Unit) Forecast, by Application 2019 & 2032
- Table 87: Canada Location as a Service Industry Revenue (Million) Forecast, by Application 2019 & 2032
- Table 88: Canada Location as a Service Industry Volume (K Unit) Forecast, by Application 2019 & 2032
- Table 89: Mexico Location as a Service Industry Revenue (Million) Forecast, by Application 2019 & 2032
- Table 90: Mexico Location as a Service Industry Volume (K Unit) Forecast, by Application 2019 & 2032
- Table 91: Global Location as a Service Industry Revenue Million Forecast, by Country 2019 & 2032
- Table 92: Global Location as a Service Industry Volume K Unit Forecast, by Country 2019 & 2032
- Table 93: United Arab Emirates Location as a Service Industry Revenue (Million) Forecast, by Application 2019 & 2032
- Table 94: United Arab Emirates Location as a Service Industry Volume (K Unit) Forecast, by Application 2019 & 2032
- Table 95: Saudi Arabia Location as a Service Industry Revenue (Million) Forecast, by Application 2019 & 2032
- Table 96: Saudi Arabia Location as a Service Industry Volume (K Unit) Forecast, by Application 2019 & 2032
- Table 97: South Africa Location as a Service Industry Revenue (Million) Forecast, by Application 2019 & 2032
- Table 98: South Africa Location as a Service Industry Volume (K Unit) Forecast, by Application 2019 & 2032
- Table 99: Rest of Middle East and Africa Location as a Service Industry Revenue (Million) Forecast, by Application 2019 & 2032
- Table 100: Rest of Middle East and Africa Location as a Service Industry Volume (K Unit) Forecast, by Application 2019 & 2032
- Table 101: Global Location as a Service Industry Revenue Million Forecast, by Location 2019 & 2032
- Table 102: Global Location as a Service Industry Volume K Unit Forecast, by Location 2019 & 2032
- Table 103: Global Location as a Service Industry Revenue Million Forecast, by Service Type 2019 & 2032
- Table 104: Global Location as a Service Industry Volume K Unit Forecast, by Service Type 2019 & 2032
- Table 105: Global Location as a Service Industry Revenue Million Forecast, by End-user Industry 2019 & 2032
- Table 106: Global Location as a Service Industry Volume K Unit Forecast, by End-user Industry 2019 & 2032
- Table 107: Global Location as a Service Industry Revenue Million Forecast, by Country 2019 & 2032
- Table 108: Global Location as a Service Industry Volume K Unit Forecast, by Country 2019 & 2032
- Table 109: United States Location as a Service Industry Revenue (Million) Forecast, by Application 2019 & 2032
- Table 110: United States Location as a Service Industry Volume (K Unit) Forecast, by Application 2019 & 2032
- Table 111: Canada Location as a Service Industry Revenue (Million) Forecast, by Application 2019 & 2032
- Table 112: Canada Location as a Service Industry Volume (K Unit) Forecast, by Application 2019 & 2032
- Table 113: Global Location as a Service Industry Revenue Million Forecast, by Location 2019 & 2032
- Table 114: Global Location as a Service Industry Volume K Unit Forecast, by Location 2019 & 2032
- Table 115: Global Location as a Service Industry Revenue Million Forecast, by Service Type 2019 & 2032
- Table 116: Global Location as a Service Industry Volume K Unit Forecast, by Service Type 2019 & 2032
- Table 117: Global Location as a Service Industry Revenue Million Forecast, by End-user Industry 2019 & 2032
- Table 118: Global Location as a Service Industry Volume K Unit Forecast, by End-user Industry 2019 & 2032
- Table 119: Global Location as a Service Industry Revenue Million Forecast, by Country 2019 & 2032
- Table 120: Global Location as a Service Industry Volume K Unit Forecast, by Country 2019 & 2032
- Table 121: United Kingdom Location as a Service Industry Revenue (Million) Forecast, by Application 2019 & 2032
- Table 122: United Kingdom Location as a Service Industry Volume (K Unit) Forecast, by Application 2019 & 2032
- Table 123: Germany Location as a Service Industry Revenue (Million) Forecast, by Application 2019 & 2032
- Table 124: Germany Location as a Service Industry Volume (K Unit) Forecast, by Application 2019 & 2032
- Table 125: France Location as a Service Industry Revenue (Million) Forecast, by Application 2019 & 2032
- Table 126: France Location as a Service Industry Volume (K Unit) Forecast, by Application 2019 & 2032
- Table 127: Rest of Europe Location as a Service Industry Revenue (Million) Forecast, by Application 2019 & 2032
- Table 128: Rest of Europe Location as a Service Industry Volume (K Unit) Forecast, by Application 2019 & 2032
- Table 129: Global Location as a Service Industry Revenue Million Forecast, by Location 2019 & 2032
- Table 130: Global Location as a Service Industry Volume K Unit Forecast, by Location 2019 & 2032
- Table 131: Global Location as a Service Industry Revenue Million Forecast, by Service Type 2019 & 2032
- Table 132: Global Location as a Service Industry Volume K Unit Forecast, by Service Type 2019 & 2032
- Table 133: Global Location as a Service Industry Revenue Million Forecast, by End-user Industry 2019 & 2032
- Table 134: Global Location as a Service Industry Volume K Unit Forecast, by End-user Industry 2019 & 2032
- Table 135: Global Location as a Service Industry Revenue Million Forecast, by Country 2019 & 2032
- Table 136: Global Location as a Service Industry Volume K Unit Forecast, by Country 2019 & 2032
- Table 137: China Location as a Service Industry Revenue (Million) Forecast, by Application 2019 & 2032
- Table 138: China Location as a Service Industry Volume (K Unit) Forecast, by Application 2019 & 2032
- Table 139: Japan Location as a Service Industry Revenue (Million) Forecast, by Application 2019 & 2032
- Table 140: Japan Location as a Service Industry Volume (K Unit) Forecast, by Application 2019 & 2032
- Table 141: India Location as a Service Industry Revenue (Million) Forecast, by Application 2019 & 2032
- Table 142: India Location as a Service Industry Volume (K Unit) Forecast, by Application 2019 & 2032
- Table 143: Rest of Asia Pacific Location as a Service Industry Revenue (Million) Forecast, by Application 2019 & 2032
- Table 144: Rest of Asia Pacific Location as a Service Industry Volume (K Unit) Forecast, by Application 2019 & 2032
- Table 145: Global Location as a Service Industry Revenue Million Forecast, by Location 2019 & 2032
- Table 146: Global Location as a Service Industry Volume K Unit Forecast, by Location 2019 & 2032
- Table 147: Global Location as a Service Industry Revenue Million Forecast, by Service Type 2019 & 2032
- Table 148: Global Location as a Service Industry Volume K Unit Forecast, by Service Type 2019 & 2032
- Table 149: Global Location as a Service Industry Revenue Million Forecast, by End-user Industry 2019 & 2032
- Table 150: Global Location as a Service Industry Volume K Unit Forecast, by End-user Industry 2019 & 2032
- Table 151: Global Location as a Service Industry Revenue Million Forecast, by Country 2019 & 2032
- Table 152: Global Location as a Service Industry Volume K Unit Forecast, by Country 2019 & 2032
Frequently Asked Questions
1. What is the projected Compound Annual Growth Rate (CAGR) of the Location as a Service Industry?
The projected CAGR is approximately 24.11%.
2. Which companies are prominent players in the Location as a Service Industry?
Key companies in the market include Ubiquicom, GL Communications Inc, HPE Aruba Inc, IBM Corporation, Google LLC, Zebra Technologies Corporation, Esri Technologies Ltd, DigitalGlobe Inc (Maxar Technologies ), Cisco Systems Inc, Sewio Networks, IndoorAtlas Ltd, HID Global (Assa Abloy AB), Ericsson Inc, Creativity Software Ltd, ALE International, Teldio Corporation, HERE Global BV.
3. What are the main segments of the Location as a Service Industry?
The market segments include Location, Service Type, End-user Industry.
4. Can you provide details about the market size?
The market size is estimated to be USD 50.85 Million as of 2022.
5. What are some drivers contributing to market growth?
Growing Demand for Geo-based Marketing; Technological Advancements Aided by Emergence of BLE and UWB for Indoor Services; Emerging Use-cases for LBS due to High Penetration of Social Media and Location-based App Adoption.
6. What are the notable trends driving market growth?
FMCG and E-Commerce Sector Expected to Witness Significant Growth.
7. Are there any restraints impacting market growth?
Trade-offs Between Privacy/Security and Regulatory Constraints.
8. Can you provide examples of recent developments in the market?
May 2022: AT&T announced the launch of location-based routing with Intrado to improve public safety response for wireless 9-1-1 calls. AT&T can quickly and more accurately identify where a wireless 9-1-1 call is coming from using device GPS and hybrid information to route the call to the correct 9-1-1 call center, also known as the public safety answering point, or PSAP.
9. What pricing options are available for accessing the report?
Pricing options include single-user, multi-user, and enterprise licenses priced at USD 4750, USD 5250, and USD 8750 respectively.
10. Is the market size provided in terms of value or volume?
The market size is provided in terms of value, measured in Million and volume, measured in K Unit.
11. Are there any specific market keywords associated with the report?
Yes, the market keyword associated with the report is "Location as a Service Industry," which aids in identifying and referencing the specific market segment covered.
12. How do I determine which pricing option suits my needs best?
The pricing options vary based on user requirements and access needs. Individual users may opt for single-user licenses, while businesses requiring broader access may choose multi-user or enterprise licenses for cost-effective access to the report.
13. Are there any additional resources or data provided in the Location as a Service Industry report?
While the report offers comprehensive insights, it's advisable to review the specific contents or supplementary materials provided to ascertain if additional resources or data are available.
14. How can I stay updated on further developments or reports in the Location as a Service Industry?
To stay informed about further developments, trends, and reports in the Location as a Service Industry, consider subscribing to industry newsletters, following relevant companies and organizations, or regularly checking reputable industry news sources and publications.
Methodology
Step 1 - Identification of Relevant Samples Size from Population Database


Step 2 - Approaches for Defining Global Market Size (Value, Volume* & Price*)

Note*: In applicable scenarios
Step 3 - Data Sources
Primary Research
- Web Analytics
- Survey Reports
- Research Institute
- Latest Research Reports
- Opinion Leaders
Secondary Research
- Annual Reports
- White Paper
- Latest Press Release
- Industry Association
- Paid Database
- Investor Presentations

Step 4 - Data Triangulation
Involves using different sources of information in order to increase the validity of a study
These sources are likely to be stakeholders in a program - participants, other researchers, program staff, other community members, and so on.
Then we put all data in single framework & apply various statistical tools to find out the dynamic on the market.
During the analysis stage, feedback from the stakeholder groups would be compared to determine areas of agreement as well as areas of divergence


