
Key Insights
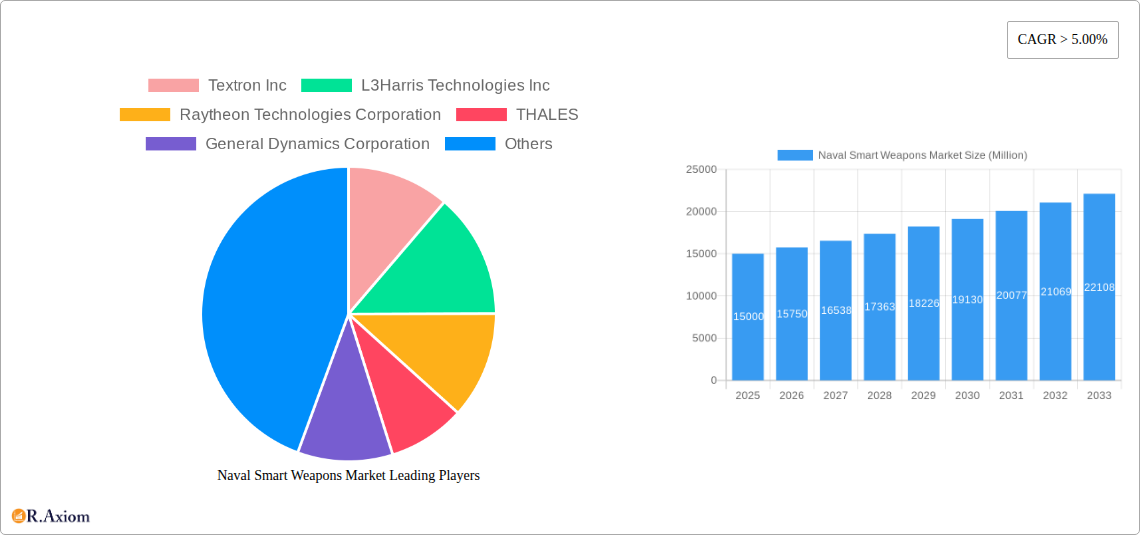
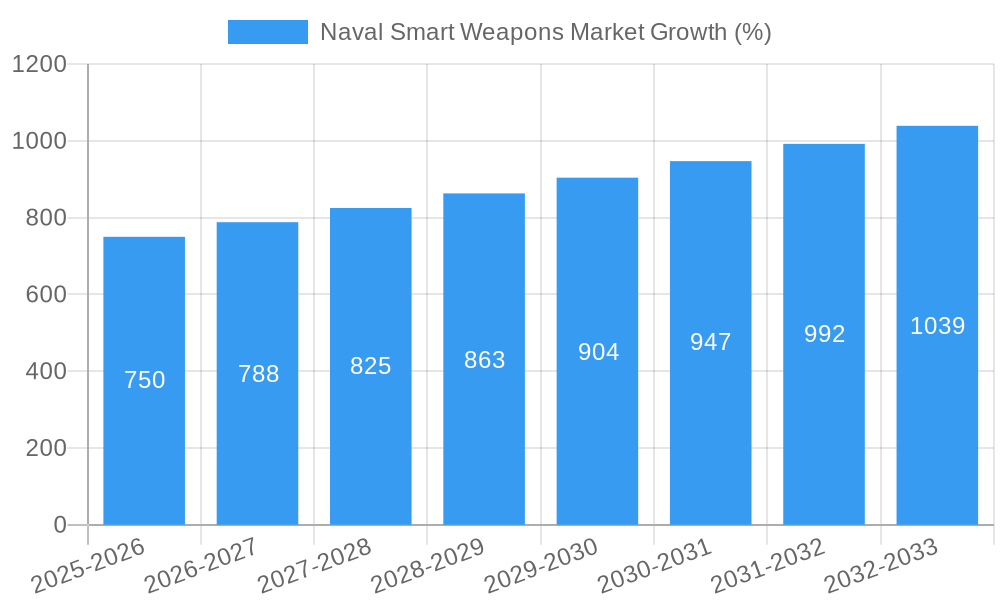
The Naval Smart Weapons market is experiencing robust growth, projected to maintain a Compound Annual Growth Rate (CAGR) exceeding 5% from 2025 to 2033. This expansion is driven by escalating geopolitical tensions, the modernization of naval fleets globally, and the increasing demand for precision-guided munitions to minimize collateral damage and enhance operational effectiveness. Key technological advancements, such as improved laser, radar, satellite, and infrared guidance systems, are further fueling market growth. The market is segmented by weapon type (missiles, ammunition, and other products) and guidance technology. Missiles currently dominate the market share due to their long-range capabilities and destructive power, while advancements in laser and radar guidance are driving significant increases in accuracy and effectiveness. The increasing integration of smart weapons into unmanned systems and autonomous platforms also contributes to the market's dynamism. Leading players like Lockheed Martin, Raytheon, and Thales are investing heavily in R&D to maintain their competitive edge, leading to the development of sophisticated and highly effective naval smart weapons.
Growth is anticipated to be particularly strong in the Asia-Pacific region, driven by increased defense spending and naval modernization initiatives in countries like China, India, and Japan. North America and Europe will also continue to be significant markets due to established naval forces and ongoing investments in defense technology. However, factors like stringent regulatory frameworks governing the development and deployment of advanced weaponry and the high cost associated with research and development pose significant restraints to market growth. Despite these challenges, the ongoing need for superior naval defense capabilities and technological advancements in guidance systems are expected to sustain the market's upward trajectory throughout the forecast period. The market is expected to reach a substantial size by 2033, reflecting a significant increase in global demand for sophisticated naval weaponry.
Naval Smart Weapons Market: A Comprehensive Market Analysis (2019-2033)
This in-depth report provides a comprehensive analysis of the global Naval Smart Weapons market, offering valuable insights for industry stakeholders, investors, and strategic decision-makers. The study period covers 2019-2033, with 2025 as the base and estimated year, and a forecast period of 2025-2033. The historical period analyzed is 2019-2024. The market is segmented by weapon type (Missiles, Ammunition, and Other Products) and guidance technology (Laser Guidance, Radar Guidance, Satellite Guidance, Infrared Guidance). Key players analyzed include Textron Inc, L3Harris Technologies Inc, Raytheon Technologies Corporation, THALES, General Dynamics Corporation, Rheinmetall AG, Lockheed Martin Corporation, MBDA, Leonardo S p A, BAE Systems plc, Northrop Grumman Corporation, and The Boeing Company.
Naval Smart Weapons Market Concentration & Innovation
The Naval Smart Weapons market exhibits a moderately concentrated landscape, dominated by a few large players with significant market share. While precise market share figures for each company are proprietary data within the full report, we can observe a trend toward consolidation through mergers and acquisitions (M&A). The total value of M&A deals in the sector from 2019 to 2024 is estimated at USD xx Million. Innovation is a critical driver, with companies investing heavily in research and development to improve accuracy, range, and lethality of smart weapons. Regulatory frameworks, particularly those related to export controls and arms trade treaties, significantly impact market dynamics. The increasing adoption of unmanned systems and autonomous capabilities further fuels innovation. Product substitutes are limited, with the primary alternative being conventional unguided weapons, which lack the precision and effectiveness of smart weapons. End-user trends show a clear preference for enhanced precision and reduced collateral damage, driving demand for advanced smart weapon systems.
- Key Market Concentration Metrics: The Herfindahl-Hirschman Index (HHI) is estimated at xx, indicating a moderately concentrated market. Specific company market share data is detailed in the full report.
- Innovation Drivers: Technological advancements in guidance systems, propulsion technology, and warhead design are crucial innovation drivers.
- M&A Activity: Significant M&A activity observed between 2019 and 2024, driven by the desire for increased market share and technological capabilities. Details on specific deals are provided in the report.
- Regulatory Landscape: Stringent export controls and international arms trade treaties shape market access and development strategies.
Naval Smart Weapons Market Industry Trends & Insights
The Naval Smart Weapons market is experiencing robust growth, driven by increasing geopolitical instability and rising defense budgets globally. The market is projected to register a CAGR of xx% during the forecast period (2025-2033). Technological advancements, such as the integration of artificial intelligence (AI) and improved sensor technologies, are disrupting the traditional landscape, enabling greater accuracy, range, and autonomous capabilities. Consumer preferences are shifting towards smarter, more precise weapons that minimize collateral damage and enhance operational effectiveness. Competitive dynamics are characterized by intense competition among established players and the emergence of innovative newcomers. Market penetration of smart weapons in naval fleets is steadily increasing, especially in advanced navies.
Dominant Markets & Segments in Naval Smart Weapons Market
The North American region holds a significant share of the global Naval Smart Weapons market, driven by substantial defense budgets and strong technological capabilities. Within this region, the United States dominates due to its large navy and robust defense industrial base.
- Leading Region: North America
- Leading Country: United States
- Dominant Weapon Type Segment: Missiles command the largest market share due to their long range and high destructive capabilities.
- Dominant Technology Segment: Infrared Guidance holds a significant share due to its effectiveness in various weather conditions and its cost-effectiveness compared to other guidance technologies. However, Laser Guidance systems are experiencing substantial growth.
Key Drivers for North American Dominance:
- Strong defense budgets.
- Advanced technological capabilities.
- Robust domestic defense industry.
- Large naval fleet.
Detailed Dominance Analysis: The detailed analysis provided in the full report examines economic policies that incentivize defense spending, infrastructure conducive to advanced technology development, and geopolitical factors that contribute to regional dominance.
Naval Smart Weapons Market Product Developments
Recent product innovations focus on enhancing precision, range, and reducing collateral damage. This includes advancements in guidance systems, propulsion technology, and warhead design. Integration of AI and autonomous capabilities is transforming smart weapons, enabling greater operational effectiveness. Key competitive advantages include superior accuracy, extended range, improved reliability, and reduced lifecycle costs. The market is witnessing a trend towards modularity and interoperability to allow for greater flexibility and adaptability.
Report Scope & Segmentation Analysis
This report provides a granular segmentation of the Naval Smart Weapons market, offering comprehensive analysis across various categories:
Weapon Type:
- Missiles: This segment is expected to witness significant growth owing to its long-range capabilities and high destructive power. The competitive landscape is intense among major defense contractors. Market size projections are detailed in the full report.
- Ammunition: This segment represents a substantial part of the market, with ongoing innovation focused on enhanced precision and lethality. Growth is projected to be steady, albeit at a slower pace than the missiles segment.
- Other Products: This segment includes various ancillary components, countermeasures, and support systems crucial to naval smart weapons operations. Growth will largely be dependent on the growth of the missiles and ammunition segments.
Guidance Technology:
- Laser Guidance: This technology is experiencing notable growth due to its high accuracy and effectiveness.
- Radar Guidance: This segment remains a vital part of the market, providing robust guidance in various operational conditions.
- Satellite Guidance: This technology is primarily used for long-range precision strikes and continues to see moderate growth.
- Infrared Guidance: A widely used and cost-effective technology, it is expected to experience steady growth.
Each segment's growth projections, market sizes, and competitive dynamics are detailed in the full report.
Key Drivers of Naval Smart Weapons Market Growth
Several factors contribute to the growth of the Naval Smart Weapons market. These include:
- Increased Defense Spending: Rising geopolitical tensions and the modernization of naval forces worldwide are boosting defense budgets globally.
- Technological Advancements: Continuous innovation in guidance systems, propulsion technology, and warhead design leads to more precise, lethal, and effective weapons.
- Demand for Enhanced Precision: Navies are prioritizing reduced collateral damage, leading to increased demand for precision-guided munitions.
Challenges in the Naval Smart Weapons Market Sector
The Naval Smart Weapons market faces certain challenges:
- High Development Costs: Research and development of advanced smart weapons involve substantial investment.
- Stringent Regulatory Frameworks: Export controls and arms trade treaties limit market access and hinder development in certain regions.
- Supply Chain Disruptions: Global supply chain volatility impacts production and delivery timelines.
- Competitive Pressure: Intense competition among major defense contractors can put pressure on pricing and profitability.
Emerging Opportunities in Naval Smart Weapons Market
Emerging opportunities exist in:
- Autonomous Weapons Systems: The integration of AI and autonomous capabilities opens new possibilities for enhanced operational efficiency and reduced human risk.
- Hypersonic Weapons: Development of hypersonic weapons promises to revolutionize naval warfare.
- Cybersecurity: Securing smart weapons systems from cyber threats becomes increasingly crucial.
Leading Players in the Naval Smart Weapons Market Market
- Textron Inc
- L3Harris Technologies Inc
- Raytheon Technologies Corporation
- THALES
- General Dynamics Corporation
- Rheinmetall AG
- Lockheed Martin Corporation
- MBDA
- Leonardo S p A
- BAE Systems plc
- Northrop Grumman Corporation
- The Boeing Company
Key Developments in Naval Smart Weapons Market Industry
- February 2023: The US Navy placed an order worth USD 92 Million for weapon assemblies for LAIRCM missile-defense systems with Northrop Grumman Corporation.
- November 2022: The German Navy tested its first high-energy laser weapon on the frigate Sachsen against drones.
Strategic Outlook for Naval Smart Weapons Market Market
The Naval Smart Weapons market is poised for sustained growth, driven by technological advancements, increasing defense budgets, and the ongoing demand for improved precision and effectiveness. Emerging technologies, such as AI and hypersonic weapons, will reshape the competitive landscape and create exciting new opportunities. Companies that effectively adapt to these changes and invest in R&D will be best positioned for success in the years to come.
Naval Smart Weapons Market Segmentation
- 1. Production Analysis
- 2. Consumption Analysis
- 3. Import Market Analysis (Value & Volume)
- 4. Export Market Analysis (Value & Volume)
- 5. Price Trend Analysis
Naval Smart Weapons Market Segmentation By Geography
-
1. North America
- 1.1. United States
- 1.2. Canada
- 1.3. Mexico
-
2. South America
- 2.1. Brazil
- 2.2. Argentina
- 2.3. Rest of South America
-
3. Europe
- 3.1. United Kingdom
- 3.2. Germany
- 3.3. France
- 3.4. Italy
- 3.5. Spain
- 3.6. Russia
- 3.7. Benelux
- 3.8. Nordics
- 3.9. Rest of Europe
-
4. Middle East & Africa
- 4.1. Turkey
- 4.2. Israel
- 4.3. GCC
- 4.4. North Africa
- 4.5. South Africa
- 4.6. Rest of Middle East & Africa
-
5. Asia Pacific
- 5.1. China
- 5.2. India
- 5.3. Japan
- 5.4. South Korea
- 5.5. ASEAN
- 5.6. Oceania
- 5.7. Rest of Asia Pacific

Naval Smart Weapons Market REPORT HIGHLIGHTS
| Aspects | Details |
|---|---|
| Study Period | 2019-2033 |
| Base Year | 2024 |
| Estimated Year | 2025 |
| Forecast Period | 2025-2033 |
| Historical Period | 2019-2024 |
| Growth Rate | CAGR of > 5.00% from 2019-2033 |
| Segmentation |
|
Table of Contents
- 1. Introduction
- 1.1. Research Scope
- 1.2. Market Segmentation
- 1.3. Research Methodology
- 1.4. Definitions and Assumptions
- 2. Executive Summary
- 2.1. Introduction
- 3. Market Dynamics
- 3.1. Introduction
- 3.2. Market Drivers
- 3.2.1. Increase in Internet of Things (IoT) and Autonomous Systems; Rise in Demand for Military and Defense Satellite Communication Solutions
- 3.3. Market Restrains
- 3.3.1. Cybersecurity Threats to Satellite Communication; Interference in Transmission of Data
- 3.4. Market Trends
- 3.4.1. Laser Guidance Segment Holds the Highest Share in the Market
- 4. Market Factor Analysis
- 4.1. Porters Five Forces
- 4.2. Supply/Value Chain
- 4.3. PESTEL analysis
- 4.4. Market Entropy
- 4.5. Patent/Trademark Analysis
- 5. Global Naval Smart Weapons Market Analysis, Insights and Forecast, 2019-2031
- 5.1. Market Analysis, Insights and Forecast - by Production Analysis
- 5.2. Market Analysis, Insights and Forecast - by Consumption Analysis
- 5.3. Market Analysis, Insights and Forecast - by Import Market Analysis (Value & Volume)
- 5.4. Market Analysis, Insights and Forecast - by Export Market Analysis (Value & Volume)
- 5.5. Market Analysis, Insights and Forecast - by Price Trend Analysis
- 5.6. Market Analysis, Insights and Forecast - by Region
- 5.6.1. North America
- 5.6.2. South America
- 5.6.3. Europe
- 5.6.4. Middle East & Africa
- 5.6.5. Asia Pacific
- 5.1. Market Analysis, Insights and Forecast - by Production Analysis
- 6. North America Naval Smart Weapons Market Analysis, Insights and Forecast, 2019-2031
- 6.1. Market Analysis, Insights and Forecast - by Production Analysis
- 6.2. Market Analysis, Insights and Forecast - by Consumption Analysis
- 6.3. Market Analysis, Insights and Forecast - by Import Market Analysis (Value & Volume)
- 6.4. Market Analysis, Insights and Forecast - by Export Market Analysis (Value & Volume)
- 6.5. Market Analysis, Insights and Forecast - by Price Trend Analysis
- 6.1. Market Analysis, Insights and Forecast - by Production Analysis
- 7. South America Naval Smart Weapons Market Analysis, Insights and Forecast, 2019-2031
- 7.1. Market Analysis, Insights and Forecast - by Production Analysis
- 7.2. Market Analysis, Insights and Forecast - by Consumption Analysis
- 7.3. Market Analysis, Insights and Forecast - by Import Market Analysis (Value & Volume)
- 7.4. Market Analysis, Insights and Forecast - by Export Market Analysis (Value & Volume)
- 7.5. Market Analysis, Insights and Forecast - by Price Trend Analysis
- 7.1. Market Analysis, Insights and Forecast - by Production Analysis
- 8. Europe Naval Smart Weapons Market Analysis, Insights and Forecast, 2019-2031
- 8.1. Market Analysis, Insights and Forecast - by Production Analysis
- 8.2. Market Analysis, Insights and Forecast - by Consumption Analysis
- 8.3. Market Analysis, Insights and Forecast - by Import Market Analysis (Value & Volume)
- 8.4. Market Analysis, Insights and Forecast - by Export Market Analysis (Value & Volume)
- 8.5. Market Analysis, Insights and Forecast - by Price Trend Analysis
- 8.1. Market Analysis, Insights and Forecast - by Production Analysis
- 9. Middle East & Africa Naval Smart Weapons Market Analysis, Insights and Forecast, 2019-2031
- 9.1. Market Analysis, Insights and Forecast - by Production Analysis
- 9.2. Market Analysis, Insights and Forecast - by Consumption Analysis
- 9.3. Market Analysis, Insights and Forecast - by Import Market Analysis (Value & Volume)
- 9.4. Market Analysis, Insights and Forecast - by Export Market Analysis (Value & Volume)
- 9.5. Market Analysis, Insights and Forecast - by Price Trend Analysis
- 9.1. Market Analysis, Insights and Forecast - by Production Analysis
- 10. Asia Pacific Naval Smart Weapons Market Analysis, Insights and Forecast, 2019-2031
- 10.1. Market Analysis, Insights and Forecast - by Production Analysis
- 10.2. Market Analysis, Insights and Forecast - by Consumption Analysis
- 10.3. Market Analysis, Insights and Forecast - by Import Market Analysis (Value & Volume)
- 10.4. Market Analysis, Insights and Forecast - by Export Market Analysis (Value & Volume)
- 10.5. Market Analysis, Insights and Forecast - by Price Trend Analysis
- 10.1. Market Analysis, Insights and Forecast - by Production Analysis
- 11. North America Naval Smart Weapons Market Analysis, Insights and Forecast, 2019-2031
- 11.1. Market Analysis, Insights and Forecast - By Country/Sub-region
- 11.1.1 United States
- 11.1.2 Canada
- 12. Europe Naval Smart Weapons Market Analysis, Insights and Forecast, 2019-2031
- 12.1. Market Analysis, Insights and Forecast - By Country/Sub-region
- 12.1.1 United Kingdom
- 12.1.2 France
- 12.1.3 Germany
- 12.1.4 Rest of Europe
- 13. Asia Pacific Naval Smart Weapons Market Analysis, Insights and Forecast, 2019-2031
- 13.1. Market Analysis, Insights and Forecast - By Country/Sub-region
- 13.1.1 India
- 13.1.2 China
- 13.1.3 Japan
- 13.1.4 South Korea
- 13.1.5 Rest of Asia Pacific
- 14. Rest of the World Naval Smart Weapons Market Analysis, Insights and Forecast, 2019-2031
- 14.1. Market Analysis, Insights and Forecast - By Country/Sub-region
- 14.1.1.
- 15. Competitive Analysis
- 15.1. Global Market Share Analysis 2024
- 15.2. Company Profiles
- 15.2.1 Textron Inc
- 15.2.1.1. Overview
- 15.2.1.2. Products
- 15.2.1.3. SWOT Analysis
- 15.2.1.4. Recent Developments
- 15.2.1.5. Financials (Based on Availability)
- 15.2.2 L3Harris Technologies Inc
- 15.2.2.1. Overview
- 15.2.2.2. Products
- 15.2.2.3. SWOT Analysis
- 15.2.2.4. Recent Developments
- 15.2.2.5. Financials (Based on Availability)
- 15.2.3 Raytheon Technologies Corporation
- 15.2.3.1. Overview
- 15.2.3.2. Products
- 15.2.3.3. SWOT Analysis
- 15.2.3.4. Recent Developments
- 15.2.3.5. Financials (Based on Availability)
- 15.2.4 THALES
- 15.2.4.1. Overview
- 15.2.4.2. Products
- 15.2.4.3. SWOT Analysis
- 15.2.4.4. Recent Developments
- 15.2.4.5. Financials (Based on Availability)
- 15.2.5 General Dynamics Corporation
- 15.2.5.1. Overview
- 15.2.5.2. Products
- 15.2.5.3. SWOT Analysis
- 15.2.5.4. Recent Developments
- 15.2.5.5. Financials (Based on Availability)
- 15.2.6 Rheinmetall AG
- 15.2.6.1. Overview
- 15.2.6.2. Products
- 15.2.6.3. SWOT Analysis
- 15.2.6.4. Recent Developments
- 15.2.6.5. Financials (Based on Availability)
- 15.2.7 Lockheed Martin Corporation
- 15.2.7.1. Overview
- 15.2.7.2. Products
- 15.2.7.3. SWOT Analysis
- 15.2.7.4. Recent Developments
- 15.2.7.5. Financials (Based on Availability)
- 15.2.8 MBDA
- 15.2.8.1. Overview
- 15.2.8.2. Products
- 15.2.8.3. SWOT Analysis
- 15.2.8.4. Recent Developments
- 15.2.8.5. Financials (Based on Availability)
- 15.2.9 Leonardo S p A
- 15.2.9.1. Overview
- 15.2.9.2. Products
- 15.2.9.3. SWOT Analysis
- 15.2.9.4. Recent Developments
- 15.2.9.5. Financials (Based on Availability)
- 15.2.10 BAE Systems plc
- 15.2.10.1. Overview
- 15.2.10.2. Products
- 15.2.10.3. SWOT Analysis
- 15.2.10.4. Recent Developments
- 15.2.10.5. Financials (Based on Availability)
- 15.2.11 Northrop Grumman Corporation
- 15.2.11.1. Overview
- 15.2.11.2. Products
- 15.2.11.3. SWOT Analysis
- 15.2.11.4. Recent Developments
- 15.2.11.5. Financials (Based on Availability)
- 15.2.12 The Boeing Company
- 15.2.12.1. Overview
- 15.2.12.2. Products
- 15.2.12.3. SWOT Analysis
- 15.2.12.4. Recent Developments
- 15.2.12.5. Financials (Based on Availability)
- 15.2.1 Textron Inc
List of Figures
- Figure 1: Global Naval Smart Weapons Market Revenue Breakdown (Million, %) by Region 2024 & 2032
- Figure 2: North America Naval Smart Weapons Market Revenue (Million), by Country 2024 & 2032
- Figure 3: North America Naval Smart Weapons Market Revenue Share (%), by Country 2024 & 2032
- Figure 4: Europe Naval Smart Weapons Market Revenue (Million), by Country 2024 & 2032
- Figure 5: Europe Naval Smart Weapons Market Revenue Share (%), by Country 2024 & 2032
- Figure 6: Asia Pacific Naval Smart Weapons Market Revenue (Million), by Country 2024 & 2032
- Figure 7: Asia Pacific Naval Smart Weapons Market Revenue Share (%), by Country 2024 & 2032
- Figure 8: Rest of the World Naval Smart Weapons Market Revenue (Million), by Country 2024 & 2032
- Figure 9: Rest of the World Naval Smart Weapons Market Revenue Share (%), by Country 2024 & 2032
- Figure 10: North America Naval Smart Weapons Market Revenue (Million), by Production Analysis 2024 & 2032
- Figure 11: North America Naval Smart Weapons Market Revenue Share (%), by Production Analysis 2024 & 2032
- Figure 12: North America Naval Smart Weapons Market Revenue (Million), by Consumption Analysis 2024 & 2032
- Figure 13: North America Naval Smart Weapons Market Revenue Share (%), by Consumption Analysis 2024 & 2032
- Figure 14: North America Naval Smart Weapons Market Revenue (Million), by Import Market Analysis (Value & Volume) 2024 & 2032
- Figure 15: North America Naval Smart Weapons Market Revenue Share (%), by Import Market Analysis (Value & Volume) 2024 & 2032
- Figure 16: North America Naval Smart Weapons Market Revenue (Million), by Export Market Analysis (Value & Volume) 2024 & 2032
- Figure 17: North America Naval Smart Weapons Market Revenue Share (%), by Export Market Analysis (Value & Volume) 2024 & 2032
- Figure 18: North America Naval Smart Weapons Market Revenue (Million), by Price Trend Analysis 2024 & 2032
- Figure 19: North America Naval Smart Weapons Market Revenue Share (%), by Price Trend Analysis 2024 & 2032
- Figure 20: North America Naval Smart Weapons Market Revenue (Million), by Country 2024 & 2032
- Figure 21: North America Naval Smart Weapons Market Revenue Share (%), by Country 2024 & 2032
- Figure 22: South America Naval Smart Weapons Market Revenue (Million), by Production Analysis 2024 & 2032
- Figure 23: South America Naval Smart Weapons Market Revenue Share (%), by Production Analysis 2024 & 2032
- Figure 24: South America Naval Smart Weapons Market Revenue (Million), by Consumption Analysis 2024 & 2032
- Figure 25: South America Naval Smart Weapons Market Revenue Share (%), by Consumption Analysis 2024 & 2032
- Figure 26: South America Naval Smart Weapons Market Revenue (Million), by Import Market Analysis (Value & Volume) 2024 & 2032
- Figure 27: South America Naval Smart Weapons Market Revenue Share (%), by Import Market Analysis (Value & Volume) 2024 & 2032
- Figure 28: South America Naval Smart Weapons Market Revenue (Million), by Export Market Analysis (Value & Volume) 2024 & 2032
- Figure 29: South America Naval Smart Weapons Market Revenue Share (%), by Export Market Analysis (Value & Volume) 2024 & 2032
- Figure 30: South America Naval Smart Weapons Market Revenue (Million), by Price Trend Analysis 2024 & 2032
- Figure 31: South America Naval Smart Weapons Market Revenue Share (%), by Price Trend Analysis 2024 & 2032
- Figure 32: South America Naval Smart Weapons Market Revenue (Million), by Country 2024 & 2032
- Figure 33: South America Naval Smart Weapons Market Revenue Share (%), by Country 2024 & 2032
- Figure 34: Europe Naval Smart Weapons Market Revenue (Million), by Production Analysis 2024 & 2032
- Figure 35: Europe Naval Smart Weapons Market Revenue Share (%), by Production Analysis 2024 & 2032
- Figure 36: Europe Naval Smart Weapons Market Revenue (Million), by Consumption Analysis 2024 & 2032
- Figure 37: Europe Naval Smart Weapons Market Revenue Share (%), by Consumption Analysis 2024 & 2032
- Figure 38: Europe Naval Smart Weapons Market Revenue (Million), by Import Market Analysis (Value & Volume) 2024 & 2032
- Figure 39: Europe Naval Smart Weapons Market Revenue Share (%), by Import Market Analysis (Value & Volume) 2024 & 2032
- Figure 40: Europe Naval Smart Weapons Market Revenue (Million), by Export Market Analysis (Value & Volume) 2024 & 2032
- Figure 41: Europe Naval Smart Weapons Market Revenue Share (%), by Export Market Analysis (Value & Volume) 2024 & 2032
- Figure 42: Europe Naval Smart Weapons Market Revenue (Million), by Price Trend Analysis 2024 & 2032
- Figure 43: Europe Naval Smart Weapons Market Revenue Share (%), by Price Trend Analysis 2024 & 2032
- Figure 44: Europe Naval Smart Weapons Market Revenue (Million), by Country 2024 & 2032
- Figure 45: Europe Naval Smart Weapons Market Revenue Share (%), by Country 2024 & 2032
- Figure 46: Middle East & Africa Naval Smart Weapons Market Revenue (Million), by Production Analysis 2024 & 2032
- Figure 47: Middle East & Africa Naval Smart Weapons Market Revenue Share (%), by Production Analysis 2024 & 2032
- Figure 48: Middle East & Africa Naval Smart Weapons Market Revenue (Million), by Consumption Analysis 2024 & 2032
- Figure 49: Middle East & Africa Naval Smart Weapons Market Revenue Share (%), by Consumption Analysis 2024 & 2032
- Figure 50: Middle East & Africa Naval Smart Weapons Market Revenue (Million), by Import Market Analysis (Value & Volume) 2024 & 2032
- Figure 51: Middle East & Africa Naval Smart Weapons Market Revenue Share (%), by Import Market Analysis (Value & Volume) 2024 & 2032
- Figure 52: Middle East & Africa Naval Smart Weapons Market Revenue (Million), by Export Market Analysis (Value & Volume) 2024 & 2032
- Figure 53: Middle East & Africa Naval Smart Weapons Market Revenue Share (%), by Export Market Analysis (Value & Volume) 2024 & 2032
- Figure 54: Middle East & Africa Naval Smart Weapons Market Revenue (Million), by Price Trend Analysis 2024 & 2032
- Figure 55: Middle East & Africa Naval Smart Weapons Market Revenue Share (%), by Price Trend Analysis 2024 & 2032
- Figure 56: Middle East & Africa Naval Smart Weapons Market Revenue (Million), by Country 2024 & 2032
- Figure 57: Middle East & Africa Naval Smart Weapons Market Revenue Share (%), by Country 2024 & 2032
- Figure 58: Asia Pacific Naval Smart Weapons Market Revenue (Million), by Production Analysis 2024 & 2032
- Figure 59: Asia Pacific Naval Smart Weapons Market Revenue Share (%), by Production Analysis 2024 & 2032
- Figure 60: Asia Pacific Naval Smart Weapons Market Revenue (Million), by Consumption Analysis 2024 & 2032
- Figure 61: Asia Pacific Naval Smart Weapons Market Revenue Share (%), by Consumption Analysis 2024 & 2032
- Figure 62: Asia Pacific Naval Smart Weapons Market Revenue (Million), by Import Market Analysis (Value & Volume) 2024 & 2032
- Figure 63: Asia Pacific Naval Smart Weapons Market Revenue Share (%), by Import Market Analysis (Value & Volume) 2024 & 2032
- Figure 64: Asia Pacific Naval Smart Weapons Market Revenue (Million), by Export Market Analysis (Value & Volume) 2024 & 2032
- Figure 65: Asia Pacific Naval Smart Weapons Market Revenue Share (%), by Export Market Analysis (Value & Volume) 2024 & 2032
- Figure 66: Asia Pacific Naval Smart Weapons Market Revenue (Million), by Price Trend Analysis 2024 & 2032
- Figure 67: Asia Pacific Naval Smart Weapons Market Revenue Share (%), by Price Trend Analysis 2024 & 2032
- Figure 68: Asia Pacific Naval Smart Weapons Market Revenue (Million), by Country 2024 & 2032
- Figure 69: Asia Pacific Naval Smart Weapons Market Revenue Share (%), by Country 2024 & 2032
List of Tables
- Table 1: Global Naval Smart Weapons Market Revenue Million Forecast, by Region 2019 & 2032
- Table 2: Global Naval Smart Weapons Market Revenue Million Forecast, by Production Analysis 2019 & 2032
- Table 3: Global Naval Smart Weapons Market Revenue Million Forecast, by Consumption Analysis 2019 & 2032
- Table 4: Global Naval Smart Weapons Market Revenue Million Forecast, by Import Market Analysis (Value & Volume) 2019 & 2032
- Table 5: Global Naval Smart Weapons Market Revenue Million Forecast, by Export Market Analysis (Value & Volume) 2019 & 2032
- Table 6: Global Naval Smart Weapons Market Revenue Million Forecast, by Price Trend Analysis 2019 & 2032
- Table 7: Global Naval Smart Weapons Market Revenue Million Forecast, by Region 2019 & 2032
- Table 8: Global Naval Smart Weapons Market Revenue Million Forecast, by Country 2019 & 2032
- Table 9: United States Naval Smart Weapons Market Revenue (Million) Forecast, by Application 2019 & 2032
- Table 10: Canada Naval Smart Weapons Market Revenue (Million) Forecast, by Application 2019 & 2032
- Table 11: Global Naval Smart Weapons Market Revenue Million Forecast, by Country 2019 & 2032
- Table 12: United Kingdom Naval Smart Weapons Market Revenue (Million) Forecast, by Application 2019 & 2032
- Table 13: France Naval Smart Weapons Market Revenue (Million) Forecast, by Application 2019 & 2032
- Table 14: Germany Naval Smart Weapons Market Revenue (Million) Forecast, by Application 2019 & 2032
- Table 15: Rest of Europe Naval Smart Weapons Market Revenue (Million) Forecast, by Application 2019 & 2032
- Table 16: Global Naval Smart Weapons Market Revenue Million Forecast, by Country 2019 & 2032
- Table 17: India Naval Smart Weapons Market Revenue (Million) Forecast, by Application 2019 & 2032
- Table 18: China Naval Smart Weapons Market Revenue (Million) Forecast, by Application 2019 & 2032
- Table 19: Japan Naval Smart Weapons Market Revenue (Million) Forecast, by Application 2019 & 2032
- Table 20: South Korea Naval Smart Weapons Market Revenue (Million) Forecast, by Application 2019 & 2032
- Table 21: Rest of Asia Pacific Naval Smart Weapons Market Revenue (Million) Forecast, by Application 2019 & 2032
- Table 22: Global Naval Smart Weapons Market Revenue Million Forecast, by Country 2019 & 2032
- Table 23: Naval Smart Weapons Market Revenue (Million) Forecast, by Application 2019 & 2032
- Table 24: Global Naval Smart Weapons Market Revenue Million Forecast, by Production Analysis 2019 & 2032
- Table 25: Global Naval Smart Weapons Market Revenue Million Forecast, by Consumption Analysis 2019 & 2032
- Table 26: Global Naval Smart Weapons Market Revenue Million Forecast, by Import Market Analysis (Value & Volume) 2019 & 2032
- Table 27: Global Naval Smart Weapons Market Revenue Million Forecast, by Export Market Analysis (Value & Volume) 2019 & 2032
- Table 28: Global Naval Smart Weapons Market Revenue Million Forecast, by Price Trend Analysis 2019 & 2032
- Table 29: Global Naval Smart Weapons Market Revenue Million Forecast, by Country 2019 & 2032
- Table 30: United States Naval Smart Weapons Market Revenue (Million) Forecast, by Application 2019 & 2032
- Table 31: Canada Naval Smart Weapons Market Revenue (Million) Forecast, by Application 2019 & 2032
- Table 32: Mexico Naval Smart Weapons Market Revenue (Million) Forecast, by Application 2019 & 2032
- Table 33: Global Naval Smart Weapons Market Revenue Million Forecast, by Production Analysis 2019 & 2032
- Table 34: Global Naval Smart Weapons Market Revenue Million Forecast, by Consumption Analysis 2019 & 2032
- Table 35: Global Naval Smart Weapons Market Revenue Million Forecast, by Import Market Analysis (Value & Volume) 2019 & 2032
- Table 36: Global Naval Smart Weapons Market Revenue Million Forecast, by Export Market Analysis (Value & Volume) 2019 & 2032
- Table 37: Global Naval Smart Weapons Market Revenue Million Forecast, by Price Trend Analysis 2019 & 2032
- Table 38: Global Naval Smart Weapons Market Revenue Million Forecast, by Country 2019 & 2032
- Table 39: Brazil Naval Smart Weapons Market Revenue (Million) Forecast, by Application 2019 & 2032
- Table 40: Argentina Naval Smart Weapons Market Revenue (Million) Forecast, by Application 2019 & 2032
- Table 41: Rest of South America Naval Smart Weapons Market Revenue (Million) Forecast, by Application 2019 & 2032
- Table 42: Global Naval Smart Weapons Market Revenue Million Forecast, by Production Analysis 2019 & 2032
- Table 43: Global Naval Smart Weapons Market Revenue Million Forecast, by Consumption Analysis 2019 & 2032
- Table 44: Global Naval Smart Weapons Market Revenue Million Forecast, by Import Market Analysis (Value & Volume) 2019 & 2032
- Table 45: Global Naval Smart Weapons Market Revenue Million Forecast, by Export Market Analysis (Value & Volume) 2019 & 2032
- Table 46: Global Naval Smart Weapons Market Revenue Million Forecast, by Price Trend Analysis 2019 & 2032
- Table 47: Global Naval Smart Weapons Market Revenue Million Forecast, by Country 2019 & 2032
- Table 48: United Kingdom Naval Smart Weapons Market Revenue (Million) Forecast, by Application 2019 & 2032
- Table 49: Germany Naval Smart Weapons Market Revenue (Million) Forecast, by Application 2019 & 2032
- Table 50: France Naval Smart Weapons Market Revenue (Million) Forecast, by Application 2019 & 2032
- Table 51: Italy Naval Smart Weapons Market Revenue (Million) Forecast, by Application 2019 & 2032
- Table 52: Spain Naval Smart Weapons Market Revenue (Million) Forecast, by Application 2019 & 2032
- Table 53: Russia Naval Smart Weapons Market Revenue (Million) Forecast, by Application 2019 & 2032
- Table 54: Benelux Naval Smart Weapons Market Revenue (Million) Forecast, by Application 2019 & 2032
- Table 55: Nordics Naval Smart Weapons Market Revenue (Million) Forecast, by Application 2019 & 2032
- Table 56: Rest of Europe Naval Smart Weapons Market Revenue (Million) Forecast, by Application 2019 & 2032
- Table 57: Global Naval Smart Weapons Market Revenue Million Forecast, by Production Analysis 2019 & 2032
- Table 58: Global Naval Smart Weapons Market Revenue Million Forecast, by Consumption Analysis 2019 & 2032
- Table 59: Global Naval Smart Weapons Market Revenue Million Forecast, by Import Market Analysis (Value & Volume) 2019 & 2032
- Table 60: Global Naval Smart Weapons Market Revenue Million Forecast, by Export Market Analysis (Value & Volume) 2019 & 2032
- Table 61: Global Naval Smart Weapons Market Revenue Million Forecast, by Price Trend Analysis 2019 & 2032
- Table 62: Global Naval Smart Weapons Market Revenue Million Forecast, by Country 2019 & 2032
- Table 63: Turkey Naval Smart Weapons Market Revenue (Million) Forecast, by Application 2019 & 2032
- Table 64: Israel Naval Smart Weapons Market Revenue (Million) Forecast, by Application 2019 & 2032
- Table 65: GCC Naval Smart Weapons Market Revenue (Million) Forecast, by Application 2019 & 2032
- Table 66: North Africa Naval Smart Weapons Market Revenue (Million) Forecast, by Application 2019 & 2032
- Table 67: South Africa Naval Smart Weapons Market Revenue (Million) Forecast, by Application 2019 & 2032
- Table 68: Rest of Middle East & Africa Naval Smart Weapons Market Revenue (Million) Forecast, by Application 2019 & 2032
- Table 69: Global Naval Smart Weapons Market Revenue Million Forecast, by Production Analysis 2019 & 2032
- Table 70: Global Naval Smart Weapons Market Revenue Million Forecast, by Consumption Analysis 2019 & 2032
- Table 71: Global Naval Smart Weapons Market Revenue Million Forecast, by Import Market Analysis (Value & Volume) 2019 & 2032
- Table 72: Global Naval Smart Weapons Market Revenue Million Forecast, by Export Market Analysis (Value & Volume) 2019 & 2032
- Table 73: Global Naval Smart Weapons Market Revenue Million Forecast, by Price Trend Analysis 2019 & 2032
- Table 74: Global Naval Smart Weapons Market Revenue Million Forecast, by Country 2019 & 2032
- Table 75: China Naval Smart Weapons Market Revenue (Million) Forecast, by Application 2019 & 2032
- Table 76: India Naval Smart Weapons Market Revenue (Million) Forecast, by Application 2019 & 2032
- Table 77: Japan Naval Smart Weapons Market Revenue (Million) Forecast, by Application 2019 & 2032
- Table 78: South Korea Naval Smart Weapons Market Revenue (Million) Forecast, by Application 2019 & 2032
- Table 79: ASEAN Naval Smart Weapons Market Revenue (Million) Forecast, by Application 2019 & 2032
- Table 80: Oceania Naval Smart Weapons Market Revenue (Million) Forecast, by Application 2019 & 2032
- Table 81: Rest of Asia Pacific Naval Smart Weapons Market Revenue (Million) Forecast, by Application 2019 & 2032
Frequently Asked Questions
1. What is the projected Compound Annual Growth Rate (CAGR) of the Naval Smart Weapons Market?
The projected CAGR is approximately > 5.00%.
2. Which companies are prominent players in the Naval Smart Weapons Market?
Key companies in the market include Textron Inc, L3Harris Technologies Inc, Raytheon Technologies Corporation, THALES, General Dynamics Corporation, Rheinmetall AG, Lockheed Martin Corporation, MBDA, Leonardo S p A, BAE Systems plc, Northrop Grumman Corporation, The Boeing Company.
3. What are the main segments of the Naval Smart Weapons Market?
The market segments include Production Analysis, Consumption Analysis, Import Market Analysis (Value & Volume), Export Market Analysis (Value & Volume), Price Trend Analysis.
4. Can you provide details about the market size?
The market size is estimated to be USD XX Million as of 2022.
5. What are some drivers contributing to market growth?
Increase in Internet of Things (IoT) and Autonomous Systems; Rise in Demand for Military and Defense Satellite Communication Solutions.
6. What are the notable trends driving market growth?
Laser Guidance Segment Holds the Highest Share in the Market.
7. Are there any restraints impacting market growth?
Cybersecurity Threats to Satellite Communication; Interference in Transmission of Data.
8. Can you provide examples of recent developments in the market?
In February 2023, the US Navy placed an order worth USD 92 million for weapon assemblies for LAIRCM missile-defense systems with Northrop Grumman Corporation.
9. What pricing options are available for accessing the report?
Pricing options include single-user, multi-user, and enterprise licenses priced at USD 4750, USD 5250, and USD 8750 respectively.
10. Is the market size provided in terms of value or volume?
The market size is provided in terms of value, measured in Million.
11. Are there any specific market keywords associated with the report?
Yes, the market keyword associated with the report is "Naval Smart Weapons Market," which aids in identifying and referencing the specific market segment covered.
12. How do I determine which pricing option suits my needs best?
The pricing options vary based on user requirements and access needs. Individual users may opt for single-user licenses, while businesses requiring broader access may choose multi-user or enterprise licenses for cost-effective access to the report.
13. Are there any additional resources or data provided in the Naval Smart Weapons Market report?
While the report offers comprehensive insights, it's advisable to review the specific contents or supplementary materials provided to ascertain if additional resources or data are available.
14. How can I stay updated on further developments or reports in the Naval Smart Weapons Market?
To stay informed about further developments, trends, and reports in the Naval Smart Weapons Market, consider subscribing to industry newsletters, following relevant companies and organizations, or regularly checking reputable industry news sources and publications.
Methodology
Step 1 - Identification of Relevant Samples Size from Population Database


Step 2 - Approaches for Defining Global Market Size (Value, Volume* & Price*)

Note*: In applicable scenarios
Step 3 - Data Sources
Primary Research
- Web Analytics
- Survey Reports
- Research Institute
- Latest Research Reports
- Opinion Leaders
Secondary Research
- Annual Reports
- White Paper
- Latest Press Release
- Industry Association
- Paid Database
- Investor Presentations

Step 4 - Data Triangulation
Involves using different sources of information in order to increase the validity of a study
These sources are likely to be stakeholders in a program - participants, other researchers, program staff, other community members, and so on.
Then we put all data in single framework & apply various statistical tools to find out the dynamic on the market.
During the analysis stage, feedback from the stakeholder groups would be compared to determine areas of agreement as well as areas of divergence


