
Key Insights
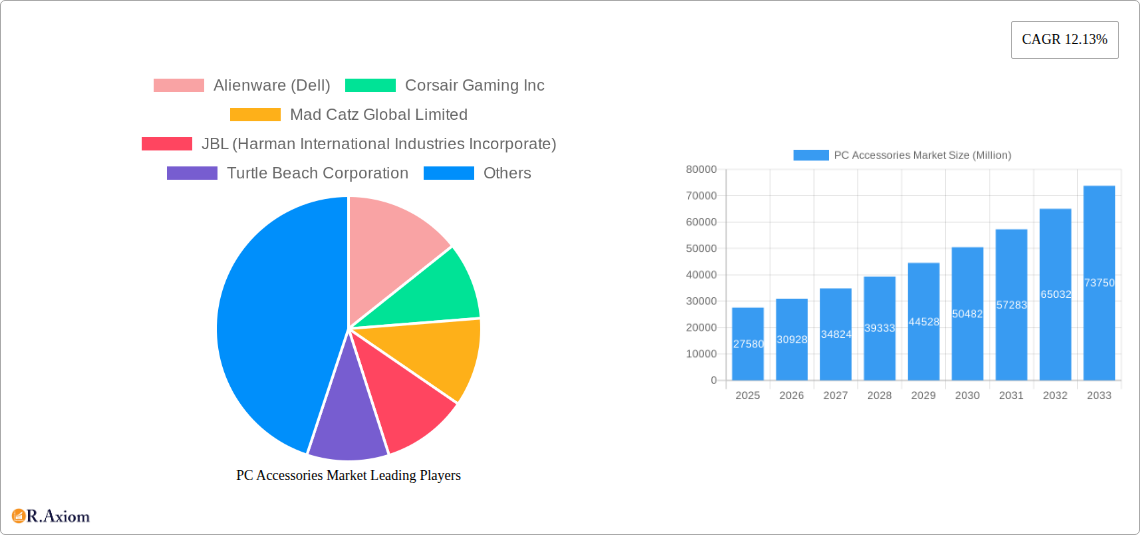
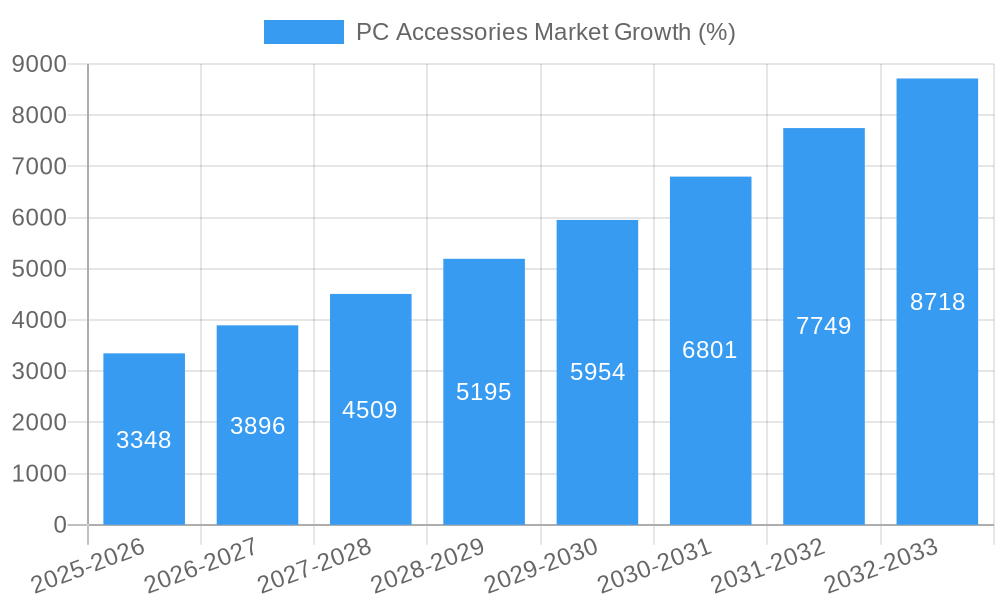
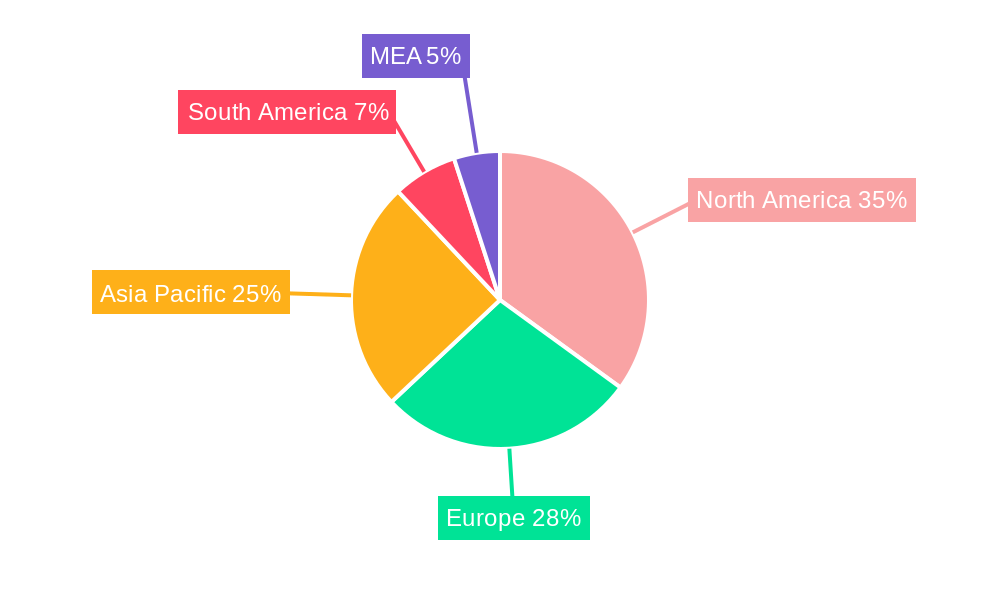
The PC accessories market, valued at $27.58 billion in 2025, is experiencing robust growth, projected to expand at a compound annual growth rate (CAGR) of 12.13% from 2025 to 2033. This surge is fueled by several key factors. The increasing popularity of gaming, both professionally and casually, is driving demand for high-performance peripherals like gaming mice, keyboards, headsets, and chairs. Furthermore, the rise of remote work and hybrid work models has boosted demand for ergonomic accessories such as monitor arms and webcams, essential for creating comfortable and productive home office setups. Technological advancements, such as improved sensor technology in mice and enhanced audio quality in headsets, also contribute to market expansion. Competition among established players like Logitech, Razer, and Corsair, alongside emerging brands, fosters innovation and drives down prices, making PC accessories more accessible to a wider consumer base. Regional variations exist, with North America and Asia Pacific anticipated to dominate the market due to high PC penetration rates and a strong gaming culture.
However, potential restraints include economic fluctuations which may impact discretionary spending on non-essential electronics. Supply chain disruptions and the increasing prevalence of integrated peripherals within laptops could also pose challenges. Despite these factors, the long-term outlook for the PC accessories market remains positive, driven by continuous technological innovation, the growing adoption of gaming and esports, and the enduring need for ergonomic and productivity-enhancing accessories in both professional and personal settings. The market segmentation by product type (mice, keyboards, headsets, etc.) and by target consumer (gaming, enterprise, consumer) allows for targeted marketing strategies and product development to better meet specific needs within the market. The diverse geographical distribution of major players and the expanding consumer base in emerging markets further contribute to the market's potential for growth.
This comprehensive report provides an in-depth analysis of the PC Accessories Market, offering valuable insights for industry stakeholders, investors, and strategic decision-makers. The study period spans from 2019 to 2033, with 2025 serving as the base and estimated year. The report meticulously examines market size, growth drivers, challenges, emerging opportunities, and competitive dynamics within this rapidly evolving sector. Detailed segmentation analysis across various product categories and geographic regions offers actionable insights for informed strategic planning. The report projects a market size of xx Million by 2033, exhibiting a CAGR of xx% during the forecast period (2025-2033).
PC Accessories Market Concentration & Innovation
The PC accessories market exhibits a moderately concentrated landscape, with a few key players holding significant market share. However, the presence of numerous smaller, specialized companies fosters innovation and competitive pricing. Market share data from 2024 indicates that Logitech International SA holds approximately xx% market share, followed by Razer Inc. with xx%, and Corsair Gaming Inc. with xx%. These figures are estimates and are subject to change based on future market developments. Innovation is driven by several factors, including advancements in ergonomics, integration of AI and IoT technologies, and a growing demand for specialized accessories tailored to specific end-user needs (e.g., gaming, professional productivity).
Regulatory frameworks, such as those concerning electronic waste and product safety, influence market practices. The market also witnesses substitution effects as technological advancements create alternative solutions. For example, the increasing popularity of cloud computing reduces reliance on certain types of physical storage devices. End-user trends, particularly the rise of remote work and e-sports, strongly influence demand for specific accessories. Mergers and acquisitions (M&A) activities, while less frequent than in some other tech sectors, contribute to market consolidation and technology transfer. Notable M&A deals in the recent past have involved smaller companies being acquired by larger players to gain access to specific technologies or expand market reach. The total value of M&A transactions within the PC accessories sector between 2019 and 2024 is estimated at xx Million.
PC Accessories Market Industry Trends & Insights
The PC accessories market is experiencing robust growth, driven by several key factors. The increasing adoption of PCs across both consumer and enterprise segments fuels demand for a wide range of accessories. Technological disruptions, such as the introduction of advanced wireless technologies (e.g., Bluetooth 5.0, Wi-Fi 6E), enhance connectivity and functionality, boosting market penetration. Consumer preferences are shifting towards ergonomic designs, customizable features, and aesthetically pleasing products. The rise of e-sports and professional gaming contributes significantly to the growth of gaming-focused accessories. The market also witnesses intense competitive dynamics, with companies constantly striving to improve product offerings, expand distribution channels, and enhance brand visibility. This competition is driving innovation and fostering price reductions, making PC accessories more accessible to a broader customer base. The overall market growth is projected to remain positive, with a compound annual growth rate (CAGR) estimated at xx% during the forecast period.
Dominant Markets & Segments in PC Accessories Market
The North American market currently holds a dominant position in the PC accessories sector, driven by strong consumer demand for gaming-related peripherals and a robust enterprise sector. Within the product segments, the gaming headset segment is particularly prominent, experiencing exceptional growth due to the expansion of the e-sports market. Other high-growth segments include gaming mice, gaming keyboards, and gaming chairs.
- Key Drivers for North American Dominance:
- High disposable incomes
- Strong technological infrastructure
- Significant adoption of PCs and gaming consoles
- High demand for high-quality PC accessories
- Supportive economic policies fostering technological innovation
The dominance of specific segments, like gaming headsets, stems from factors such as increasing popularity of e-sports, improved audio quality, and enhanced features in newer products.
PC Accessories Market Product Developments
Recent product innovations focus on enhancing ergonomics, improving performance, and integrating advanced technologies. Companies are developing accessories with customizable features, improved durability, and superior aesthetics. Wireless technologies play a key role, enhancing convenience and user experience. The integration of artificial intelligence (AI) and the Internet of Things (IoT) are emerging trends, promising more personalized and connected PC accessories in the future. For instance, AI-powered gaming headsets can analyze gameplay to optimize sound settings, and smart desk setups integrate various PC accessories into an interconnected ecosystem. These innovations are largely driven by the increasing demand for advanced functionality and a better user experience.
Report Scope & Segmentation Analysis
This report segments the PC accessories market across several key categories:
By Product:
- Mice: This segment encompasses both gaming and non-gaming mice, with a focus on features like sensor technology, ergonomics, and button customization. The market is expected to show xx% growth by 2033.
- Keyboards (Non-gaming, Enterprise and Consumer): This includes standard keyboards, ergonomic keyboards, and specialized keyboards for different applications (e.g., programming, data entry). Expected growth rate: xx% by 2033.
- Headsets (Non-gaming, Enterprise and Consumer): This segment comprises headsets for communication, gaming, and general use, ranging from basic models to high-end noise-canceling options. Expected growth rate: xx% by 2033.
- Monitor Arms (Non-gaming, Commercial): This category involves various monitor arm designs offering adjustable height, tilt, and rotation. Expected growth rate: xx% by 2033.
- Gaming Chairs (Non-gaming, Commercial): This segment focuses on chairs designed for extended gaming sessions, prioritizing ergonomics, comfort, and adjustability. Expected growth rate: xx% by 2033.
- Webcams (Non-gaming, Commercial): This segment consists of webcams for video conferencing, streaming, and general video capture, with various resolutions and features available. Expected growth rate: xx% by 2033.
Each segment's growth trajectory is influenced by diverse factors, including technological advancements, shifting consumer preferences, and pricing dynamics. Competitive landscapes vary significantly depending on the specific segment.
Key Drivers of PC Accessories Market Growth
Several factors fuel the growth of the PC accessories market:
- Technological advancements: Innovations in materials, wireless connectivity, and AI-powered features enhance product functionality and user experience.
- Rising demand for gaming accessories: The escalating popularity of e-sports and gaming fuels demand for high-performance gaming peripherals.
- Growth in remote work and e-learning: The shift towards remote work and e-learning necessitates improved accessories for enhanced productivity and communication.
- Increasing adoption of PCs in developing economies: Expanding PC penetration in emerging markets creates new growth opportunities for PC accessories.
These factors collectively drive market expansion and influence overall growth projections.
Challenges in the PC Accessories Market Sector
The PC accessories market faces several challenges:
- Intense competition: The market is highly competitive, with numerous established and emerging players.
- Supply chain disruptions: Global supply chain disruptions can lead to component shortages and increased production costs.
- Price sensitivity: Consumers often exhibit price sensitivity, particularly for non-gaming accessories.
- Technological obsolescence: Rapid technological advancements can make products obsolete quickly.
These challenges necessitate strategic planning and adaptability to maintain profitability and market share. For example, supply chain disruptions experienced between 2020 and 2022 led to an estimated xx% increase in production costs for certain components.
Emerging Opportunities in PC Accessories Market
The PC accessories market presents several emerging opportunities:
- Integration of AI and IoT technologies: AI-powered accessories and smart home integration are promising new areas of growth.
- Expansion into niche markets: Focus on specialized accessories for specific applications (e.g., medical, industrial) can unlock new revenue streams.
- Sustainable and eco-friendly products: Demand for environmentally responsible accessories presents a significant opportunity.
- Customization and personalization: Consumers increasingly seek personalized and customizable accessories.
These opportunities require proactive adaptation and innovation to meet evolving market demands.
Leading Players in the PC Accessories Market Market
- Alienware (Dell)
- Corsair Gaming Inc
- Mad Catz Global Limited
- JBL (Harman International Industries Incorporate)
- Turtle Beach Corporation
- Microsoft Corporation
- Nintendo Co Ltd
- Koninklijke Philips NV
- Cooler Master Co Ltd (CMC)
- Sennheiser Electronic GmbH & Co KG
- AOC Internationa
- Razer Inc
- Reddragon (Eastern Times Technology Co Ltd)
- Logitech International SA
- Sony Corporation
Key Developments in PC Accessories Market Industry
April 2024: Qualcomm Technologies, Inc. expands the Snapdragon X Series platform portfolio with Snapdragon X Plus, featuring the Qualcomm Oryon CPU, offering up to 37% faster CPU performance and 54% less power consumption. This development has significant implications for high-performance PC accessories that leverage this advanced platform.
January 2024: Lenovo launched over 40 new AI-powered devices, including PC innovations across various sub-brands. This signifies a move towards AI-integrated PC accessories and could drive growth in related segments.
Strategic Outlook for PC Accessories Market Market
The PC accessories market is poised for sustained growth, driven by technological advancements, evolving consumer preferences, and the expansion of related sectors. New opportunities in AI-powered accessories, personalized products, and sustainable solutions present significant potential. The market's future hinges on companies' ability to adapt to technological disruptions, maintain competitive pricing, and effectively cater to the demands of a diverse customer base. The continuing integration of AI and IoT technologies is expected to significantly influence product development and market expansion in the coming years.
PC Accessories Market Segmentation
-
1. Product
-
1.1. Mice
- 1.1.1. Gaming
- 1.1.2. Non-gaming (Enterprise and Consumer)
- 1.2. Keyboard
-
1.3. Headset
- 1.3.1. Gaming and Personal
- 1.3.2. Non-gaming (Commercial)
- 1.4. Monitor Arms
- 1.5. Gaming Chairs
- 1.6. Webcams
-
1.1. Mice
PC Accessories Market Segmentation By Geography
-
1. North America
- 1.1. United States
- 1.2. Canada
-
2. Europe
- 2.1. Germany
- 2.2. United Kingdom
- 2.3. France
- 2.4. Italy
- 2.5. Russia
- 2.6. Switzerland
-
3. Asia Pacific
- 3.1. China
- 3.2. Japan
- 3.3. South Korea
- 3.4. Australia and New Zealand
-
4. Latin America
- 4.1. Brazil
- 4.2. Mexico
-
5. Middle East and Africa
- 5.1. United Arab Emirates
- 5.2. Saudi Arabia
- 5.3. South Africa
PC Accessories Market REPORT HIGHLIGHTS
| Aspects | Details |
|---|---|
| Study Period | 2019-2033 |
| Base Year | 2024 |
| Estimated Year | 2025 |
| Forecast Period | 2025-2033 |
| Historical Period | 2019-2024 |
| Growth Rate | CAGR of 12.13% from 2019-2033 |
| Segmentation |
|
Table of Contents
- 1. Introduction
- 1.1. Research Scope
- 1.2. Market Segmentation
- 1.3. Research Methodology
- 1.4. Definitions and Assumptions
- 2. Executive Summary
- 2.1. Introduction
- 3. Market Dynamics
- 3.1. Introduction
- 3.2. Market Drivers
- 3.2.1 Rising Adoption of Wireless Technologies; Emergence of Technologies Such as AR
- 3.2.2 VR
- 3.2.3 and AI; Adoption of Gaming Platforms Such as E-sports
- 3.3. Market Restrains
- 3.3.1. Fluctuation in the Production of Silicon Chips is Leading to a Shortage in the Demand for Gaming Accessories
- 3.4. Market Trends
- 3.4.1 Emergence of Technologies such as AR
- 3.4.2 VR
- 3.4.3 and AI to Drive the Market
- 4. Market Factor Analysis
- 4.1. Porters Five Forces
- 4.2. Supply/Value Chain
- 4.3. PESTEL analysis
- 4.4. Market Entropy
- 4.5. Patent/Trademark Analysis
- 5. Global PC Accessories Market Analysis, Insights and Forecast, 2019-2031
- 5.1. Market Analysis, Insights and Forecast - by Product
- 5.1.1. Mice
- 5.1.1.1. Gaming
- 5.1.1.2. Non-gaming (Enterprise and Consumer)
- 5.1.2. Keyboard
- 5.1.3. Headset
- 5.1.3.1. Gaming and Personal
- 5.1.3.2. Non-gaming (Commercial)
- 5.1.4. Monitor Arms
- 5.1.5. Gaming Chairs
- 5.1.6. Webcams
- 5.1.1. Mice
- 5.2. Market Analysis, Insights and Forecast - by Region
- 5.2.1. North America
- 5.2.2. Europe
- 5.2.3. Asia Pacific
- 5.2.4. Latin America
- 5.2.5. Middle East and Africa
- 5.1. Market Analysis, Insights and Forecast - by Product
- 6. North America PC Accessories Market Analysis, Insights and Forecast, 2019-2031
- 6.1. Market Analysis, Insights and Forecast - by Product
- 6.1.1. Mice
- 6.1.1.1. Gaming
- 6.1.1.2. Non-gaming (Enterprise and Consumer)
- 6.1.2. Keyboard
- 6.1.3. Headset
- 6.1.3.1. Gaming and Personal
- 6.1.3.2. Non-gaming (Commercial)
- 6.1.4. Monitor Arms
- 6.1.5. Gaming Chairs
- 6.1.6. Webcams
- 6.1.1. Mice
- 6.1. Market Analysis, Insights and Forecast - by Product
- 7. Europe PC Accessories Market Analysis, Insights and Forecast, 2019-2031
- 7.1. Market Analysis, Insights and Forecast - by Product
- 7.1.1. Mice
- 7.1.1.1. Gaming
- 7.1.1.2. Non-gaming (Enterprise and Consumer)
- 7.1.2. Keyboard
- 7.1.3. Headset
- 7.1.3.1. Gaming and Personal
- 7.1.3.2. Non-gaming (Commercial)
- 7.1.4. Monitor Arms
- 7.1.5. Gaming Chairs
- 7.1.6. Webcams
- 7.1.1. Mice
- 7.1. Market Analysis, Insights and Forecast - by Product
- 8. Asia Pacific PC Accessories Market Analysis, Insights and Forecast, 2019-2031
- 8.1. Market Analysis, Insights and Forecast - by Product
- 8.1.1. Mice
- 8.1.1.1. Gaming
- 8.1.1.2. Non-gaming (Enterprise and Consumer)
- 8.1.2. Keyboard
- 8.1.3. Headset
- 8.1.3.1. Gaming and Personal
- 8.1.3.2. Non-gaming (Commercial)
- 8.1.4. Monitor Arms
- 8.1.5. Gaming Chairs
- 8.1.6. Webcams
- 8.1.1. Mice
- 8.1. Market Analysis, Insights and Forecast - by Product
- 9. Latin America PC Accessories Market Analysis, Insights and Forecast, 2019-2031
- 9.1. Market Analysis, Insights and Forecast - by Product
- 9.1.1. Mice
- 9.1.1.1. Gaming
- 9.1.1.2. Non-gaming (Enterprise and Consumer)
- 9.1.2. Keyboard
- 9.1.3. Headset
- 9.1.3.1. Gaming and Personal
- 9.1.3.2. Non-gaming (Commercial)
- 9.1.4. Monitor Arms
- 9.1.5. Gaming Chairs
- 9.1.6. Webcams
- 9.1.1. Mice
- 9.1. Market Analysis, Insights and Forecast - by Product
- 10. Middle East and Africa PC Accessories Market Analysis, Insights and Forecast, 2019-2031
- 10.1. Market Analysis, Insights and Forecast - by Product
- 10.1.1. Mice
- 10.1.1.1. Gaming
- 10.1.1.2. Non-gaming (Enterprise and Consumer)
- 10.1.2. Keyboard
- 10.1.3. Headset
- 10.1.3.1. Gaming and Personal
- 10.1.3.2. Non-gaming (Commercial)
- 10.1.4. Monitor Arms
- 10.1.5. Gaming Chairs
- 10.1.6. Webcams
- 10.1.1. Mice
- 10.1. Market Analysis, Insights and Forecast - by Product
- 11. North America PC Accessories Market Analysis, Insights and Forecast, 2019-2031
- 11.1. Market Analysis, Insights and Forecast - By Country/Sub-region
- 11.1.1 United States
- 11.1.2 Canada
- 11.1.3 Mexico
- 12. Europe PC Accessories Market Analysis, Insights and Forecast, 2019-2031
- 12.1. Market Analysis, Insights and Forecast - By Country/Sub-region
- 12.1.1 Germany
- 12.1.2 United Kingdom
- 12.1.3 France
- 12.1.4 Spain
- 12.1.5 Italy
- 12.1.6 Spain
- 12.1.7 Belgium
- 12.1.8 Netherland
- 12.1.9 Nordics
- 12.1.10 Rest of Europe
- 13. Asia Pacific PC Accessories Market Analysis, Insights and Forecast, 2019-2031
- 13.1. Market Analysis, Insights and Forecast - By Country/Sub-region
- 13.1.1 China
- 13.1.2 Japan
- 13.1.3 India
- 13.1.4 South Korea
- 13.1.5 Southeast Asia
- 13.1.6 Australia
- 13.1.7 Indonesia
- 13.1.8 Phillipes
- 13.1.9 Singapore
- 13.1.10 Thailandc
- 13.1.11 Rest of Asia Pacific
- 14. South America PC Accessories Market Analysis, Insights and Forecast, 2019-2031
- 14.1. Market Analysis, Insights and Forecast - By Country/Sub-region
- 14.1.1 Brazil
- 14.1.2 Argentina
- 14.1.3 Peru
- 14.1.4 Chile
- 14.1.5 Colombia
- 14.1.6 Ecuador
- 14.1.7 Venezuela
- 14.1.8 Rest of South America
- 15. North America PC Accessories Market Analysis, Insights and Forecast, 2019-2031
- 15.1. Market Analysis, Insights and Forecast - By Country/Sub-region
- 15.1.1 United States
- 15.1.2 Canada
- 15.1.3 Mexico
- 16. MEA PC Accessories Market Analysis, Insights and Forecast, 2019-2031
- 16.1. Market Analysis, Insights and Forecast - By Country/Sub-region
- 16.1.1 United Arab Emirates
- 16.1.2 Saudi Arabia
- 16.1.3 South Africa
- 16.1.4 Rest of Middle East and Africa
- 17. Competitive Analysis
- 17.1. Global Market Share Analysis 2024
- 17.2. Company Profiles
- 17.2.1 Alienware (Dell)
- 17.2.1.1. Overview
- 17.2.1.2. Products
- 17.2.1.3. SWOT Analysis
- 17.2.1.4. Recent Developments
- 17.2.1.5. Financials (Based on Availability)
- 17.2.2 Corsair Gaming Inc
- 17.2.2.1. Overview
- 17.2.2.2. Products
- 17.2.2.3. SWOT Analysis
- 17.2.2.4. Recent Developments
- 17.2.2.5. Financials (Based on Availability)
- 17.2.3 Mad Catz Global Limited
- 17.2.3.1. Overview
- 17.2.3.2. Products
- 17.2.3.3. SWOT Analysis
- 17.2.3.4. Recent Developments
- 17.2.3.5. Financials (Based on Availability)
- 17.2.4 JBL (Harman International Industries Incorporate)
- 17.2.4.1. Overview
- 17.2.4.2. Products
- 17.2.4.3. SWOT Analysis
- 17.2.4.4. Recent Developments
- 17.2.4.5. Financials (Based on Availability)
- 17.2.5 Turtle Beach Corporation
- 17.2.5.1. Overview
- 17.2.5.2. Products
- 17.2.5.3. SWOT Analysis
- 17.2.5.4. Recent Developments
- 17.2.5.5. Financials (Based on Availability)
- 17.2.6 Microsoft Corporation
- 17.2.6.1. Overview
- 17.2.6.2. Products
- 17.2.6.3. SWOT Analysis
- 17.2.6.4. Recent Developments
- 17.2.6.5. Financials (Based on Availability)
- 17.2.7 Nintendo Co Ltd
- 17.2.7.1. Overview
- 17.2.7.2. Products
- 17.2.7.3. SWOT Analysis
- 17.2.7.4. Recent Developments
- 17.2.7.5. Financials (Based on Availability)
- 17.2.8 Koninklijke Philips NV
- 17.2.8.1. Overview
- 17.2.8.2. Products
- 17.2.8.3. SWOT Analysis
- 17.2.8.4. Recent Developments
- 17.2.8.5. Financials (Based on Availability)
- 17.2.9 Cooler Master Co Ltd (CMC)
- 17.2.9.1. Overview
- 17.2.9.2. Products
- 17.2.9.3. SWOT Analysis
- 17.2.9.4. Recent Developments
- 17.2.9.5. Financials (Based on Availability)
- 17.2.10 Sennheiser Electronic GmbH & Co KG
- 17.2.10.1. Overview
- 17.2.10.2. Products
- 17.2.10.3. SWOT Analysis
- 17.2.10.4. Recent Developments
- 17.2.10.5. Financials (Based on Availability)
- 17.2.11 AOC Internationa
- 17.2.11.1. Overview
- 17.2.11.2. Products
- 17.2.11.3. SWOT Analysis
- 17.2.11.4. Recent Developments
- 17.2.11.5. Financials (Based on Availability)
- 17.2.12 Razer Inc
- 17.2.12.1. Overview
- 17.2.12.2. Products
- 17.2.12.3. SWOT Analysis
- 17.2.12.4. Recent Developments
- 17.2.12.5. Financials (Based on Availability)
- 17.2.13 Reddragon (Eastern Times Technology Co Ltd)
- 17.2.13.1. Overview
- 17.2.13.2. Products
- 17.2.13.3. SWOT Analysis
- 17.2.13.4. Recent Developments
- 17.2.13.5. Financials (Based on Availability)
- 17.2.14 Logitech International SA
- 17.2.14.1. Overview
- 17.2.14.2. Products
- 17.2.14.3. SWOT Analysis
- 17.2.14.4. Recent Developments
- 17.2.14.5. Financials (Based on Availability)
- 17.2.15 Sony Corporation
- 17.2.15.1. Overview
- 17.2.15.2. Products
- 17.2.15.3. SWOT Analysis
- 17.2.15.4. Recent Developments
- 17.2.15.5. Financials (Based on Availability)
- 17.2.1 Alienware (Dell)
List of Figures
- Figure 1: Global PC Accessories Market Revenue Breakdown (Million, %) by Region 2024 & 2032
- Figure 2: Global PC Accessories Market Volume Breakdown (K Unit, %) by Region 2024 & 2032
- Figure 3: North America PC Accessories Market Revenue (Million), by Country 2024 & 2032
- Figure 4: North America PC Accessories Market Volume (K Unit), by Country 2024 & 2032
- Figure 5: North America PC Accessories Market Revenue Share (%), by Country 2024 & 2032
- Figure 6: North America PC Accessories Market Volume Share (%), by Country 2024 & 2032
- Figure 7: Europe PC Accessories Market Revenue (Million), by Country 2024 & 2032
- Figure 8: Europe PC Accessories Market Volume (K Unit), by Country 2024 & 2032
- Figure 9: Europe PC Accessories Market Revenue Share (%), by Country 2024 & 2032
- Figure 10: Europe PC Accessories Market Volume Share (%), by Country 2024 & 2032
- Figure 11: Asia Pacific PC Accessories Market Revenue (Million), by Country 2024 & 2032
- Figure 12: Asia Pacific PC Accessories Market Volume (K Unit), by Country 2024 & 2032
- Figure 13: Asia Pacific PC Accessories Market Revenue Share (%), by Country 2024 & 2032
- Figure 14: Asia Pacific PC Accessories Market Volume Share (%), by Country 2024 & 2032
- Figure 15: South America PC Accessories Market Revenue (Million), by Country 2024 & 2032
- Figure 16: South America PC Accessories Market Volume (K Unit), by Country 2024 & 2032
- Figure 17: South America PC Accessories Market Revenue Share (%), by Country 2024 & 2032
- Figure 18: South America PC Accessories Market Volume Share (%), by Country 2024 & 2032
- Figure 19: North America PC Accessories Market Revenue (Million), by Country 2024 & 2032
- Figure 20: North America PC Accessories Market Volume (K Unit), by Country 2024 & 2032
- Figure 21: North America PC Accessories Market Revenue Share (%), by Country 2024 & 2032
- Figure 22: North America PC Accessories Market Volume Share (%), by Country 2024 & 2032
- Figure 23: MEA PC Accessories Market Revenue (Million), by Country 2024 & 2032
- Figure 24: MEA PC Accessories Market Volume (K Unit), by Country 2024 & 2032
- Figure 25: MEA PC Accessories Market Revenue Share (%), by Country 2024 & 2032
- Figure 26: MEA PC Accessories Market Volume Share (%), by Country 2024 & 2032
- Figure 27: North America PC Accessories Market Revenue (Million), by Product 2024 & 2032
- Figure 28: North America PC Accessories Market Volume (K Unit), by Product 2024 & 2032
- Figure 29: North America PC Accessories Market Revenue Share (%), by Product 2024 & 2032
- Figure 30: North America PC Accessories Market Volume Share (%), by Product 2024 & 2032
- Figure 31: North America PC Accessories Market Revenue (Million), by Country 2024 & 2032
- Figure 32: North America PC Accessories Market Volume (K Unit), by Country 2024 & 2032
- Figure 33: North America PC Accessories Market Revenue Share (%), by Country 2024 & 2032
- Figure 34: North America PC Accessories Market Volume Share (%), by Country 2024 & 2032
- Figure 35: Europe PC Accessories Market Revenue (Million), by Product 2024 & 2032
- Figure 36: Europe PC Accessories Market Volume (K Unit), by Product 2024 & 2032
- Figure 37: Europe PC Accessories Market Revenue Share (%), by Product 2024 & 2032
- Figure 38: Europe PC Accessories Market Volume Share (%), by Product 2024 & 2032
- Figure 39: Europe PC Accessories Market Revenue (Million), by Country 2024 & 2032
- Figure 40: Europe PC Accessories Market Volume (K Unit), by Country 2024 & 2032
- Figure 41: Europe PC Accessories Market Revenue Share (%), by Country 2024 & 2032
- Figure 42: Europe PC Accessories Market Volume Share (%), by Country 2024 & 2032
- Figure 43: Asia Pacific PC Accessories Market Revenue (Million), by Product 2024 & 2032
- Figure 44: Asia Pacific PC Accessories Market Volume (K Unit), by Product 2024 & 2032
- Figure 45: Asia Pacific PC Accessories Market Revenue Share (%), by Product 2024 & 2032
- Figure 46: Asia Pacific PC Accessories Market Volume Share (%), by Product 2024 & 2032
- Figure 47: Asia Pacific PC Accessories Market Revenue (Million), by Country 2024 & 2032
- Figure 48: Asia Pacific PC Accessories Market Volume (K Unit), by Country 2024 & 2032
- Figure 49: Asia Pacific PC Accessories Market Revenue Share (%), by Country 2024 & 2032
- Figure 50: Asia Pacific PC Accessories Market Volume Share (%), by Country 2024 & 2032
- Figure 51: Latin America PC Accessories Market Revenue (Million), by Product 2024 & 2032
- Figure 52: Latin America PC Accessories Market Volume (K Unit), by Product 2024 & 2032
- Figure 53: Latin America PC Accessories Market Revenue Share (%), by Product 2024 & 2032
- Figure 54: Latin America PC Accessories Market Volume Share (%), by Product 2024 & 2032
- Figure 55: Latin America PC Accessories Market Revenue (Million), by Country 2024 & 2032
- Figure 56: Latin America PC Accessories Market Volume (K Unit), by Country 2024 & 2032
- Figure 57: Latin America PC Accessories Market Revenue Share (%), by Country 2024 & 2032
- Figure 58: Latin America PC Accessories Market Volume Share (%), by Country 2024 & 2032
- Figure 59: Middle East and Africa PC Accessories Market Revenue (Million), by Product 2024 & 2032
- Figure 60: Middle East and Africa PC Accessories Market Volume (K Unit), by Product 2024 & 2032
- Figure 61: Middle East and Africa PC Accessories Market Revenue Share (%), by Product 2024 & 2032
- Figure 62: Middle East and Africa PC Accessories Market Volume Share (%), by Product 2024 & 2032
- Figure 63: Middle East and Africa PC Accessories Market Revenue (Million), by Country 2024 & 2032
- Figure 64: Middle East and Africa PC Accessories Market Volume (K Unit), by Country 2024 & 2032
- Figure 65: Middle East and Africa PC Accessories Market Revenue Share (%), by Country 2024 & 2032
- Figure 66: Middle East and Africa PC Accessories Market Volume Share (%), by Country 2024 & 2032
List of Tables
- Table 1: Global PC Accessories Market Revenue Million Forecast, by Region 2019 & 2032
- Table 2: Global PC Accessories Market Volume K Unit Forecast, by Region 2019 & 2032
- Table 3: Global PC Accessories Market Revenue Million Forecast, by Product 2019 & 2032
- Table 4: Global PC Accessories Market Volume K Unit Forecast, by Product 2019 & 2032
- Table 5: Global PC Accessories Market Revenue Million Forecast, by Region 2019 & 2032
- Table 6: Global PC Accessories Market Volume K Unit Forecast, by Region 2019 & 2032
- Table 7: Global PC Accessories Market Revenue Million Forecast, by Country 2019 & 2032
- Table 8: Global PC Accessories Market Volume K Unit Forecast, by Country 2019 & 2032
- Table 9: United States PC Accessories Market Revenue (Million) Forecast, by Application 2019 & 2032
- Table 10: United States PC Accessories Market Volume (K Unit) Forecast, by Application 2019 & 2032
- Table 11: Canada PC Accessories Market Revenue (Million) Forecast, by Application 2019 & 2032
- Table 12: Canada PC Accessories Market Volume (K Unit) Forecast, by Application 2019 & 2032
- Table 13: Mexico PC Accessories Market Revenue (Million) Forecast, by Application 2019 & 2032
- Table 14: Mexico PC Accessories Market Volume (K Unit) Forecast, by Application 2019 & 2032
- Table 15: Global PC Accessories Market Revenue Million Forecast, by Country 2019 & 2032
- Table 16: Global PC Accessories Market Volume K Unit Forecast, by Country 2019 & 2032
- Table 17: Germany PC Accessories Market Revenue (Million) Forecast, by Application 2019 & 2032
- Table 18: Germany PC Accessories Market Volume (K Unit) Forecast, by Application 2019 & 2032
- Table 19: United Kingdom PC Accessories Market Revenue (Million) Forecast, by Application 2019 & 2032
- Table 20: United Kingdom PC Accessories Market Volume (K Unit) Forecast, by Application 2019 & 2032
- Table 21: France PC Accessories Market Revenue (Million) Forecast, by Application 2019 & 2032
- Table 22: France PC Accessories Market Volume (K Unit) Forecast, by Application 2019 & 2032
- Table 23: Spain PC Accessories Market Revenue (Million) Forecast, by Application 2019 & 2032
- Table 24: Spain PC Accessories Market Volume (K Unit) Forecast, by Application 2019 & 2032
- Table 25: Italy PC Accessories Market Revenue (Million) Forecast, by Application 2019 & 2032
- Table 26: Italy PC Accessories Market Volume (K Unit) Forecast, by Application 2019 & 2032
- Table 27: Spain PC Accessories Market Revenue (Million) Forecast, by Application 2019 & 2032
- Table 28: Spain PC Accessories Market Volume (K Unit) Forecast, by Application 2019 & 2032
- Table 29: Belgium PC Accessories Market Revenue (Million) Forecast, by Application 2019 & 2032
- Table 30: Belgium PC Accessories Market Volume (K Unit) Forecast, by Application 2019 & 2032
- Table 31: Netherland PC Accessories Market Revenue (Million) Forecast, by Application 2019 & 2032
- Table 32: Netherland PC Accessories Market Volume (K Unit) Forecast, by Application 2019 & 2032
- Table 33: Nordics PC Accessories Market Revenue (Million) Forecast, by Application 2019 & 2032
- Table 34: Nordics PC Accessories Market Volume (K Unit) Forecast, by Application 2019 & 2032
- Table 35: Rest of Europe PC Accessories Market Revenue (Million) Forecast, by Application 2019 & 2032
- Table 36: Rest of Europe PC Accessories Market Volume (K Unit) Forecast, by Application 2019 & 2032
- Table 37: Global PC Accessories Market Revenue Million Forecast, by Country 2019 & 2032
- Table 38: Global PC Accessories Market Volume K Unit Forecast, by Country 2019 & 2032
- Table 39: China PC Accessories Market Revenue (Million) Forecast, by Application 2019 & 2032
- Table 40: China PC Accessories Market Volume (K Unit) Forecast, by Application 2019 & 2032
- Table 41: Japan PC Accessories Market Revenue (Million) Forecast, by Application 2019 & 2032
- Table 42: Japan PC Accessories Market Volume (K Unit) Forecast, by Application 2019 & 2032
- Table 43: India PC Accessories Market Revenue (Million) Forecast, by Application 2019 & 2032
- Table 44: India PC Accessories Market Volume (K Unit) Forecast, by Application 2019 & 2032
- Table 45: South Korea PC Accessories Market Revenue (Million) Forecast, by Application 2019 & 2032
- Table 46: South Korea PC Accessories Market Volume (K Unit) Forecast, by Application 2019 & 2032
- Table 47: Southeast Asia PC Accessories Market Revenue (Million) Forecast, by Application 2019 & 2032
- Table 48: Southeast Asia PC Accessories Market Volume (K Unit) Forecast, by Application 2019 & 2032
- Table 49: Australia PC Accessories Market Revenue (Million) Forecast, by Application 2019 & 2032
- Table 50: Australia PC Accessories Market Volume (K Unit) Forecast, by Application 2019 & 2032
- Table 51: Indonesia PC Accessories Market Revenue (Million) Forecast, by Application 2019 & 2032
- Table 52: Indonesia PC Accessories Market Volume (K Unit) Forecast, by Application 2019 & 2032
- Table 53: Phillipes PC Accessories Market Revenue (Million) Forecast, by Application 2019 & 2032
- Table 54: Phillipes PC Accessories Market Volume (K Unit) Forecast, by Application 2019 & 2032
- Table 55: Singapore PC Accessories Market Revenue (Million) Forecast, by Application 2019 & 2032
- Table 56: Singapore PC Accessories Market Volume (K Unit) Forecast, by Application 2019 & 2032
- Table 57: Thailandc PC Accessories Market Revenue (Million) Forecast, by Application 2019 & 2032
- Table 58: Thailandc PC Accessories Market Volume (K Unit) Forecast, by Application 2019 & 2032
- Table 59: Rest of Asia Pacific PC Accessories Market Revenue (Million) Forecast, by Application 2019 & 2032
- Table 60: Rest of Asia Pacific PC Accessories Market Volume (K Unit) Forecast, by Application 2019 & 2032
- Table 61: Global PC Accessories Market Revenue Million Forecast, by Country 2019 & 2032
- Table 62: Global PC Accessories Market Volume K Unit Forecast, by Country 2019 & 2032
- Table 63: Brazil PC Accessories Market Revenue (Million) Forecast, by Application 2019 & 2032
- Table 64: Brazil PC Accessories Market Volume (K Unit) Forecast, by Application 2019 & 2032
- Table 65: Argentina PC Accessories Market Revenue (Million) Forecast, by Application 2019 & 2032
- Table 66: Argentina PC Accessories Market Volume (K Unit) Forecast, by Application 2019 & 2032
- Table 67: Peru PC Accessories Market Revenue (Million) Forecast, by Application 2019 & 2032
- Table 68: Peru PC Accessories Market Volume (K Unit) Forecast, by Application 2019 & 2032
- Table 69: Chile PC Accessories Market Revenue (Million) Forecast, by Application 2019 & 2032
- Table 70: Chile PC Accessories Market Volume (K Unit) Forecast, by Application 2019 & 2032
- Table 71: Colombia PC Accessories Market Revenue (Million) Forecast, by Application 2019 & 2032
- Table 72: Colombia PC Accessories Market Volume (K Unit) Forecast, by Application 2019 & 2032
- Table 73: Ecuador PC Accessories Market Revenue (Million) Forecast, by Application 2019 & 2032
- Table 74: Ecuador PC Accessories Market Volume (K Unit) Forecast, by Application 2019 & 2032
- Table 75: Venezuela PC Accessories Market Revenue (Million) Forecast, by Application 2019 & 2032
- Table 76: Venezuela PC Accessories Market Volume (K Unit) Forecast, by Application 2019 & 2032
- Table 77: Rest of South America PC Accessories Market Revenue (Million) Forecast, by Application 2019 & 2032
- Table 78: Rest of South America PC Accessories Market Volume (K Unit) Forecast, by Application 2019 & 2032
- Table 79: Global PC Accessories Market Revenue Million Forecast, by Country 2019 & 2032
- Table 80: Global PC Accessories Market Volume K Unit Forecast, by Country 2019 & 2032
- Table 81: United States PC Accessories Market Revenue (Million) Forecast, by Application 2019 & 2032
- Table 82: United States PC Accessories Market Volume (K Unit) Forecast, by Application 2019 & 2032
- Table 83: Canada PC Accessories Market Revenue (Million) Forecast, by Application 2019 & 2032
- Table 84: Canada PC Accessories Market Volume (K Unit) Forecast, by Application 2019 & 2032
- Table 85: Mexico PC Accessories Market Revenue (Million) Forecast, by Application 2019 & 2032
- Table 86: Mexico PC Accessories Market Volume (K Unit) Forecast, by Application 2019 & 2032
- Table 87: Global PC Accessories Market Revenue Million Forecast, by Country 2019 & 2032
- Table 88: Global PC Accessories Market Volume K Unit Forecast, by Country 2019 & 2032
- Table 89: United Arab Emirates PC Accessories Market Revenue (Million) Forecast, by Application 2019 & 2032
- Table 90: United Arab Emirates PC Accessories Market Volume (K Unit) Forecast, by Application 2019 & 2032
- Table 91: Saudi Arabia PC Accessories Market Revenue (Million) Forecast, by Application 2019 & 2032
- Table 92: Saudi Arabia PC Accessories Market Volume (K Unit) Forecast, by Application 2019 & 2032
- Table 93: South Africa PC Accessories Market Revenue (Million) Forecast, by Application 2019 & 2032
- Table 94: South Africa PC Accessories Market Volume (K Unit) Forecast, by Application 2019 & 2032
- Table 95: Rest of Middle East and Africa PC Accessories Market Revenue (Million) Forecast, by Application 2019 & 2032
- Table 96: Rest of Middle East and Africa PC Accessories Market Volume (K Unit) Forecast, by Application 2019 & 2032
- Table 97: Global PC Accessories Market Revenue Million Forecast, by Product 2019 & 2032
- Table 98: Global PC Accessories Market Volume K Unit Forecast, by Product 2019 & 2032
- Table 99: Global PC Accessories Market Revenue Million Forecast, by Country 2019 & 2032
- Table 100: Global PC Accessories Market Volume K Unit Forecast, by Country 2019 & 2032
- Table 101: United States PC Accessories Market Revenue (Million) Forecast, by Application 2019 & 2032
- Table 102: United States PC Accessories Market Volume (K Unit) Forecast, by Application 2019 & 2032
- Table 103: Canada PC Accessories Market Revenue (Million) Forecast, by Application 2019 & 2032
- Table 104: Canada PC Accessories Market Volume (K Unit) Forecast, by Application 2019 & 2032
- Table 105: Global PC Accessories Market Revenue Million Forecast, by Product 2019 & 2032
- Table 106: Global PC Accessories Market Volume K Unit Forecast, by Product 2019 & 2032
- Table 107: Global PC Accessories Market Revenue Million Forecast, by Country 2019 & 2032
- Table 108: Global PC Accessories Market Volume K Unit Forecast, by Country 2019 & 2032
- Table 109: Germany PC Accessories Market Revenue (Million) Forecast, by Application 2019 & 2032
- Table 110: Germany PC Accessories Market Volume (K Unit) Forecast, by Application 2019 & 2032
- Table 111: United Kingdom PC Accessories Market Revenue (Million) Forecast, by Application 2019 & 2032
- Table 112: United Kingdom PC Accessories Market Volume (K Unit) Forecast, by Application 2019 & 2032
- Table 113: France PC Accessories Market Revenue (Million) Forecast, by Application 2019 & 2032
- Table 114: France PC Accessories Market Volume (K Unit) Forecast, by Application 2019 & 2032
- Table 115: Italy PC Accessories Market Revenue (Million) Forecast, by Application 2019 & 2032
- Table 116: Italy PC Accessories Market Volume (K Unit) Forecast, by Application 2019 & 2032
- Table 117: Russia PC Accessories Market Revenue (Million) Forecast, by Application 2019 & 2032
- Table 118: Russia PC Accessories Market Volume (K Unit) Forecast, by Application 2019 & 2032
- Table 119: Switzerland PC Accessories Market Revenue (Million) Forecast, by Application 2019 & 2032
- Table 120: Switzerland PC Accessories Market Volume (K Unit) Forecast, by Application 2019 & 2032
- Table 121: Global PC Accessories Market Revenue Million Forecast, by Product 2019 & 2032
- Table 122: Global PC Accessories Market Volume K Unit Forecast, by Product 2019 & 2032
- Table 123: Global PC Accessories Market Revenue Million Forecast, by Country 2019 & 2032
- Table 124: Global PC Accessories Market Volume K Unit Forecast, by Country 2019 & 2032
- Table 125: China PC Accessories Market Revenue (Million) Forecast, by Application 2019 & 2032
- Table 126: China PC Accessories Market Volume (K Unit) Forecast, by Application 2019 & 2032
- Table 127: Japan PC Accessories Market Revenue (Million) Forecast, by Application 2019 & 2032
- Table 128: Japan PC Accessories Market Volume (K Unit) Forecast, by Application 2019 & 2032
- Table 129: South Korea PC Accessories Market Revenue (Million) Forecast, by Application 2019 & 2032
- Table 130: South Korea PC Accessories Market Volume (K Unit) Forecast, by Application 2019 & 2032
- Table 131: Australia and New Zealand PC Accessories Market Revenue (Million) Forecast, by Application 2019 & 2032
- Table 132: Australia and New Zealand PC Accessories Market Volume (K Unit) Forecast, by Application 2019 & 2032
- Table 133: Global PC Accessories Market Revenue Million Forecast, by Product 2019 & 2032
- Table 134: Global PC Accessories Market Volume K Unit Forecast, by Product 2019 & 2032
- Table 135: Global PC Accessories Market Revenue Million Forecast, by Country 2019 & 2032
- Table 136: Global PC Accessories Market Volume K Unit Forecast, by Country 2019 & 2032
- Table 137: Brazil PC Accessories Market Revenue (Million) Forecast, by Application 2019 & 2032
- Table 138: Brazil PC Accessories Market Volume (K Unit) Forecast, by Application 2019 & 2032
- Table 139: Mexico PC Accessories Market Revenue (Million) Forecast, by Application 2019 & 2032
- Table 140: Mexico PC Accessories Market Volume (K Unit) Forecast, by Application 2019 & 2032
- Table 141: Global PC Accessories Market Revenue Million Forecast, by Product 2019 & 2032
- Table 142: Global PC Accessories Market Volume K Unit Forecast, by Product 2019 & 2032
- Table 143: Global PC Accessories Market Revenue Million Forecast, by Country 2019 & 2032
- Table 144: Global PC Accessories Market Volume K Unit Forecast, by Country 2019 & 2032
- Table 145: United Arab Emirates PC Accessories Market Revenue (Million) Forecast, by Application 2019 & 2032
- Table 146: United Arab Emirates PC Accessories Market Volume (K Unit) Forecast, by Application 2019 & 2032
- Table 147: Saudi Arabia PC Accessories Market Revenue (Million) Forecast, by Application 2019 & 2032
- Table 148: Saudi Arabia PC Accessories Market Volume (K Unit) Forecast, by Application 2019 & 2032
- Table 149: South Africa PC Accessories Market Revenue (Million) Forecast, by Application 2019 & 2032
- Table 150: South Africa PC Accessories Market Volume (K Unit) Forecast, by Application 2019 & 2032
Frequently Asked Questions
1. What is the projected Compound Annual Growth Rate (CAGR) of the PC Accessories Market?
The projected CAGR is approximately 12.13%.
2. Which companies are prominent players in the PC Accessories Market?
Key companies in the market include Alienware (Dell), Corsair Gaming Inc, Mad Catz Global Limited, JBL (Harman International Industries Incorporate), Turtle Beach Corporation, Microsoft Corporation, Nintendo Co Ltd, Koninklijke Philips NV, Cooler Master Co Ltd (CMC), Sennheiser Electronic GmbH & Co KG, AOC Internationa, Razer Inc, Reddragon (Eastern Times Technology Co Ltd), Logitech International SA, Sony Corporation.
3. What are the main segments of the PC Accessories Market?
The market segments include Product.
4. Can you provide details about the market size?
The market size is estimated to be USD 27.58 Million as of 2022.
5. What are some drivers contributing to market growth?
Rising Adoption of Wireless Technologies; Emergence of Technologies Such as AR. VR. and AI; Adoption of Gaming Platforms Such as E-sports.
6. What are the notable trends driving market growth?
Emergence of Technologies such as AR. VR. and AI to Drive the Market.
7. Are there any restraints impacting market growth?
Fluctuation in the Production of Silicon Chips is Leading to a Shortage in the Demand for Gaming Accessories.
8. Can you provide examples of recent developments in the market?
April 2024 - Qualcomm Technologies, Inc. expands the leading Snapdragon X Series platform portfolio with Snapdragon X Plus. Snapdragon X Plus features the advanced Qualcomm Oryon CPU, a custom-integrated processor that delivers up to 37% faster CPU performance than competitors while consuming up to 54% less power.
9. What pricing options are available for accessing the report?
Pricing options include single-user, multi-user, and enterprise licenses priced at USD 4750, USD 5250, and USD 8750 respectively.
10. Is the market size provided in terms of value or volume?
The market size is provided in terms of value, measured in Million and volume, measured in K Unit.
11. Are there any specific market keywords associated with the report?
Yes, the market keyword associated with the report is "PC Accessories Market," which aids in identifying and referencing the specific market segment covered.
12. How do I determine which pricing option suits my needs best?
The pricing options vary based on user requirements and access needs. Individual users may opt for single-user licenses, while businesses requiring broader access may choose multi-user or enterprise licenses for cost-effective access to the report.
13. Are there any additional resources or data provided in the PC Accessories Market report?
While the report offers comprehensive insights, it's advisable to review the specific contents or supplementary materials provided to ascertain if additional resources or data are available.
14. How can I stay updated on further developments or reports in the PC Accessories Market?
To stay informed about further developments, trends, and reports in the PC Accessories Market, consider subscribing to industry newsletters, following relevant companies and organizations, or regularly checking reputable industry news sources and publications.
Methodology
Step 1 - Identification of Relevant Samples Size from Population Database


Step 2 - Approaches for Defining Global Market Size (Value, Volume* & Price*)

Note*: In applicable scenarios
Step 3 - Data Sources
Primary Research
- Web Analytics
- Survey Reports
- Research Institute
- Latest Research Reports
- Opinion Leaders
Secondary Research
- Annual Reports
- White Paper
- Latest Press Release
- Industry Association
- Paid Database
- Investor Presentations

Step 4 - Data Triangulation
Involves using different sources of information in order to increase the validity of a study
These sources are likely to be stakeholders in a program - participants, other researchers, program staff, other community members, and so on.
Then we put all data in single framework & apply various statistical tools to find out the dynamic on the market.
During the analysis stage, feedback from the stakeholder groups would be compared to determine areas of agreement as well as areas of divergence


