
Key Insights
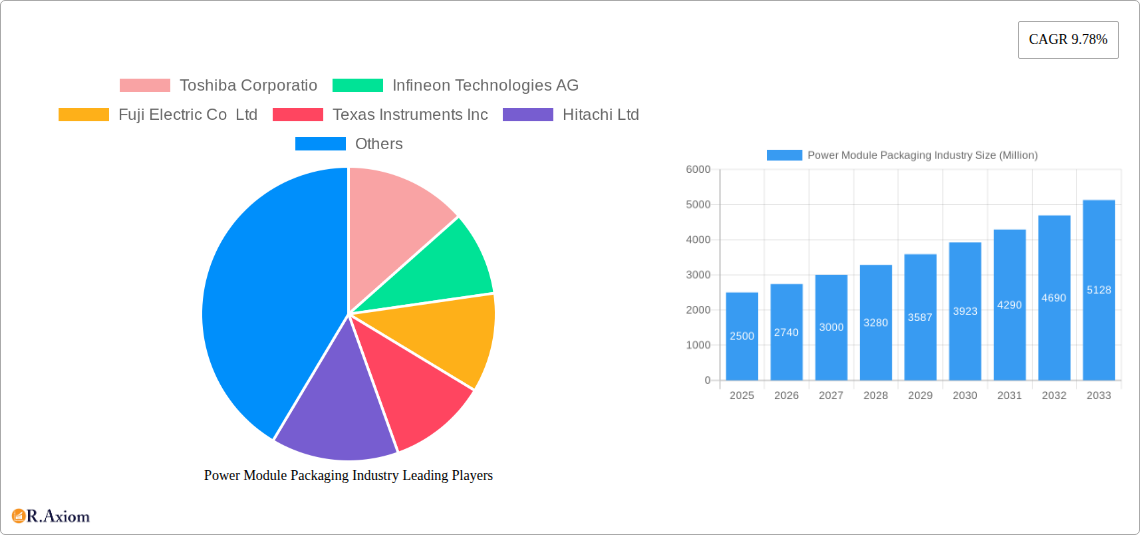
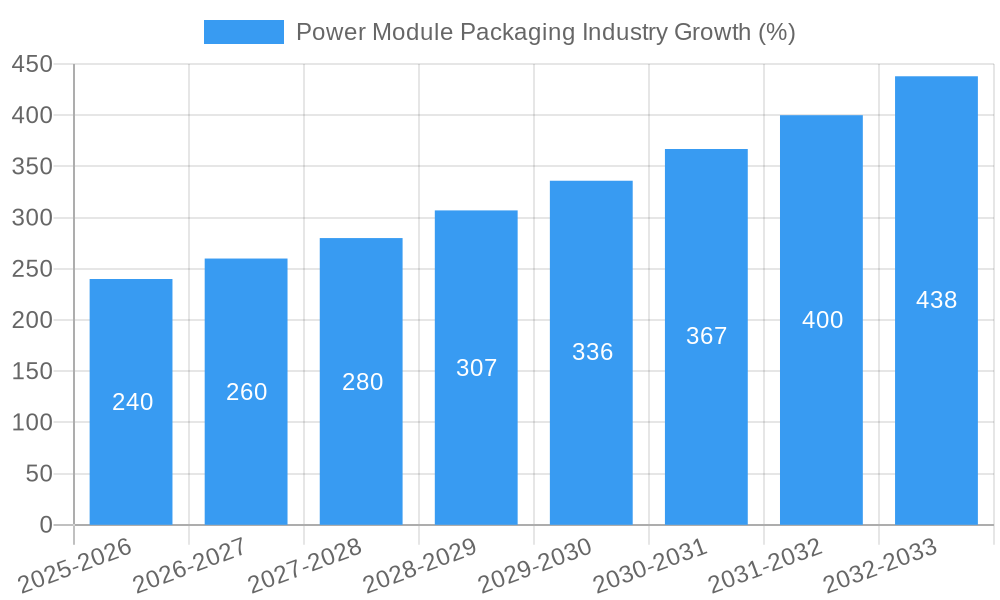
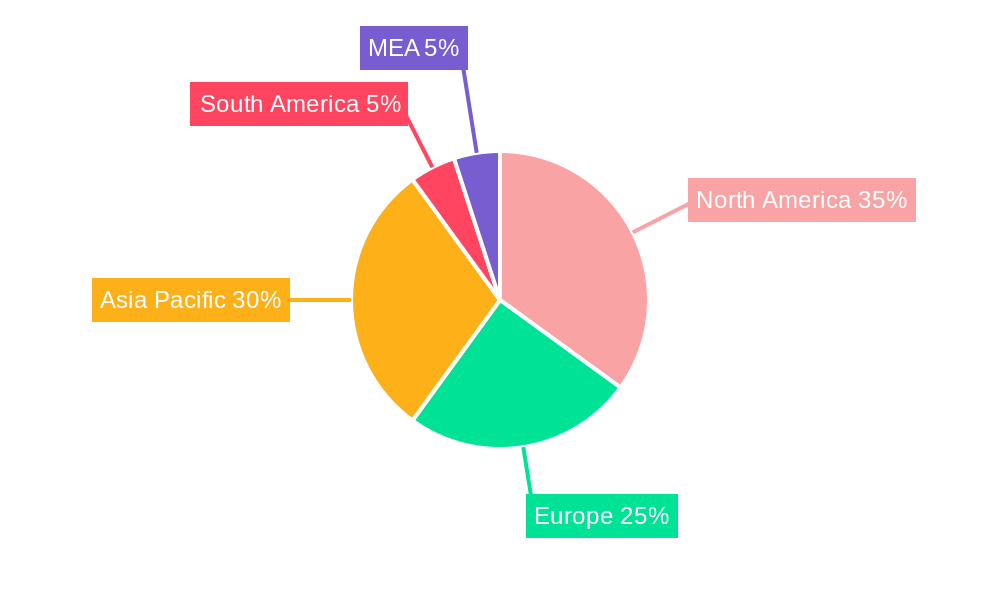
The power module packaging market is experiencing robust growth, projected to reach \$2.5 billion in 2025 and maintain a Compound Annual Growth Rate (CAGR) of 9.78% from 2025 to 2033. This expansion is fueled by the increasing demand for high-power density and efficient power electronics across various sectors. The automotive industry, driven by the electrification of vehicles and the adoption of hybrid and electric powertrains, is a significant driver. Renewable energy sources, such as solar and wind power, also contribute substantially to market growth, necessitating efficient power conversion and management solutions. Advancements in semiconductor technology, particularly in wide bandgap materials like silicon carbide (SiC) and gallium nitride (GaN), are further accelerating the demand for sophisticated power module packaging solutions. The market is segmented by technology, with substrate, baseplate, die attach, and encapsulation technologies showing strong growth potential due to their role in enhancing thermal management, reliability, and miniaturization of power modules. Leading companies are focusing on innovative packaging techniques and materials to meet the evolving needs of the industry. Geographical growth varies, with North America and Asia Pacific expected to be dominant regions, reflecting the concentration of manufacturing facilities and end-user industries in these areas. The market's future depends on ongoing innovation in materials science, miniaturization technologies, and the continuous increase in demand for power electronics across various applications.
The competitive landscape is characterized by a mix of established semiconductor companies and specialized packaging providers. Companies like Toshiba, Infineon, and Texas Instruments are major players, leveraging their expertise in semiconductor design and manufacturing. However, smaller, specialized firms are also contributing significantly through their innovative packaging solutions. The market is characterized by intense competition, with companies focusing on differentiating their offerings through enhanced thermal management, higher power density, and improved reliability. The ongoing trend toward electric vehicles and renewable energy investments is anticipated to sustain the market's healthy growth trajectory in the coming years. The market will continue to mature, with further consolidation possible among companies as they aim to expand their market share and build capabilities in next-generation technologies.
Power Module Packaging Industry: A Comprehensive Market Report (2019-2033)
This in-depth report provides a comprehensive analysis of the Power Module Packaging industry, offering valuable insights for stakeholders seeking to understand market dynamics, growth opportunities, and competitive landscapes. Covering the period from 2019 to 2033, with a focus on 2025, this report delivers actionable intelligence to inform strategic decision-making. The global market is projected to reach xx Million by 2033, exhibiting a CAGR of xx% during the forecast period (2025-2033).
Power Module Packaging Industry Market Concentration & Innovation
This section analyzes the competitive landscape of the Power Module Packaging industry, examining market concentration, innovation drivers, regulatory frameworks, and key industry developments. The market is characterized by a moderately concentrated structure with several key players holding significant market share. Toshiba Corporation, Infineon Technologies AG, and Fuji Electric Co Ltd are among the leading players, collectively accounting for an estimated xx% of the global market in 2025. Innovation is driven by the increasing demand for higher power density, improved efficiency, and miniaturization in various applications, particularly in electric vehicles and renewable energy.
- Market Concentration: The top 5 players hold approximately xx% market share in 2025.
- Innovation Drivers: Advancements in materials science (SiC, GaN), thermal management solutions, and miniaturization techniques are key drivers.
- Regulatory Frameworks: Stringent environmental regulations and safety standards are influencing packaging design and material selection.
- Product Substitutes: Alternative packaging technologies and materials are emerging, but traditional solutions still dominate.
- End-User Trends: The growing adoption of electric vehicles, renewable energy systems, and industrial automation is boosting demand.
- M&A Activities: The industry has witnessed xx Million in M&A deal value between 2019 and 2024, primarily focused on expanding product portfolios and technological capabilities. Several strategic partnerships have also been formed to leverage complementary expertise.
Power Module Packaging Industry Industry Trends & Insights
The Power Module Packaging market is experiencing robust growth fueled by several key factors. The increasing adoption of electric vehicles (EVs) and hybrid electric vehicles (HEVs) is a major driver, demanding power modules with higher power density and efficiency. The expansion of renewable energy infrastructure, including solar and wind power, also contributes significantly to market expansion. Technological advancements, such as the adoption of wide-bandgap semiconductors (SiC and GaN), are further enhancing the performance and capabilities of power modules, driving the demand for advanced packaging solutions. The market is witnessing a shift towards more sophisticated packaging techniques like 3D packaging to meet the demanding requirements of high-power applications. The competitive landscape is dynamic, with companies investing heavily in R&D to develop innovative packaging solutions and expand their market share.
Dominant Markets & Segments in Power Module Packaging Industry
The Asia-Pacific region is expected to dominate the Power Module Packaging market throughout the forecast period, driven by robust growth in the electronics and automotive industries in China, Japan, and South Korea. Within the technology segments, the Substrate and Die Attach segments are projected to witness significant growth, fuelled by rising demand for high-power density modules in various applications.
Key Drivers:
- Asia-Pacific Dominance: High growth in electronics manufacturing and automotive sectors.
- Substrate Segment: Demand for high-performance substrates in EVs and renewable energy.
- Die Attach Segment: Critical for ensuring reliable and efficient power module performance.
- Economic Policies: Government incentives and investments in renewable energy and electric vehicle infrastructure are fueling market expansion.
- Infrastructure Development: Advancements in power grid infrastructure and charging stations are facilitating the growth of electric vehicles and renewable energy systems.
Power Module Packaging Industry Product Developments
Recent innovations focus on improved thermal management, higher power density, and miniaturization. The adoption of advanced materials like SiC and GaN enables higher switching frequencies and reduced power loss. New packaging techniques, such as 3D integration and embedded passives, are enhancing module performance and reliability. These developments cater to the growing demand for compact, efficient, and high-performance power modules in various applications including electric vehicles, renewable energy systems, and industrial automation.
Report Scope & Segmentation Analysis
This report segments the Power Module Packaging market by technology:
- Substrate: This segment encompasses various substrate materials and their manufacturing processes. The market is expected to grow at a CAGR of xx% during the forecast period.
- Baseplate: Growth is driven by demand for effective thermal management solutions. CAGR: xx%.
- Die Attach: This critical aspect ensures reliable electrical and thermal connections. CAGR: xx%.
- Substrate Attach: Techniques for attaching the die to the substrate are evolving to meet higher power demands. CAGR: xx%.
- Encapsulations: Protects the module from environmental factors. CAGR: xx%.
- Interconnections: Advanced interconnects enable higher power handling and efficiency. CAGR: xx%.
- Others: This segment includes other supporting technologies and materials. CAGR: xx%.
Key Drivers of Power Module Packaging Industry Growth
The growth of the Power Module Packaging industry is driven by several key factors, including:
- Rising demand for electric vehicles and hybrid electric vehicles: This sector is a significant driver of growth, requiring advanced packaging solutions to handle higher power densities and improve efficiency.
- Expansion of renewable energy infrastructure: Solar and wind power systems are boosting the demand for efficient power modules.
- Technological advancements in semiconductor materials: SiC and GaN are revolutionizing power electronics, necessitating new packaging methods.
- Stringent environmental regulations: Government policies promoting energy efficiency and reducing carbon emissions are driving the adoption of advanced power module packaging.
Challenges in the Power Module Packaging Industry Sector
The industry faces several challenges, including:
- High manufacturing costs: Advanced packaging technologies can be expensive, impacting affordability.
- Supply chain disruptions: Global events can significantly impact the availability of raw materials and components.
- Competition from alternative technologies: New packaging approaches constantly emerge, creating competitive pressure.
- Meeting stringent safety and reliability standards: Maintaining high quality and reliability is crucial in power electronics applications.
Emerging Opportunities in Power Module Packaging Industry
Emerging opportunities include:
- Growth of the electric vehicle market: Further expansion of EV adoption globally presents significant opportunities.
- Advancements in wide-bandgap semiconductor technology: SiC and GaN are opening up new possibilities for improved packaging solutions.
- Development of new packaging techniques: Innovations in 3D packaging and embedded passives are expected to revolutionize the field.
- Expansion into new applications: Opportunities exist in various sectors, including industrial automation and smart grids.
Leading Players in the Power Module Packaging Industry Market
- Toshiba Corporation
- Infineon Technologies AG
- Fuji Electric Co Ltd
- Texas Instruments Inc
- Hitachi Ltd
- Mitsubishi Electric Corporation
- Starpower Semiconductor Ltd
- STMicroelectronics NV
- Macmic Science & Technology Co Ltd
- Semikron Danfoss Holding A/S (Danfoss A/S)
- Amkor Technology Inc
Key Developments in Power Module Packaging Industry Industry
- December 2023: STMicroelectronics signed a long-term silicon carbide (SiC) supply agreement with Li Auto for SiC MOSFET devices in BEVs. This significantly boosts STMicroelectronics' position in the EV market and highlights the growing demand for SiC-based power modules.
- November 2023: Mitsubishi Electric Corporation partnered with Nexperia B.V. to jointly develop silicon carbide (SiC) power semiconductors. This collaboration strengthens both companies' positions in the SiC power semiconductor market and demonstrates the ongoing trend of strategic partnerships in the industry.
Strategic Outlook for Power Module Packaging Industry Market
The Power Module Packaging industry is poised for continued growth, driven by the ongoing expansion of electric vehicles, renewable energy, and industrial automation. Technological advancements in materials and packaging techniques will continue to drive innovation and enhance the performance and efficiency of power modules. Companies focusing on developing high-power density, cost-effective, and reliable solutions will be well-positioned to capitalize on the market's significant growth potential. The increasing adoption of wide-bandgap semiconductors and advanced thermal management solutions will be crucial for achieving higher power densities and improved efficiency, leading to continued market growth in the coming years.
Power Module Packaging Industry Segmentation
-
1. Technology
- 1.1. Substrate
- 1.2. Baseplate
- 1.3. Die Attach
- 1.4. Substrate Attach
- 1.5. Encapsulations
- 1.6. Interconnections
- 1.7. Other Technologies
Power Module Packaging Industry Segmentation By Geography
- 1. North America
- 2. Europe
- 3. Asia
- 4. Australia and New Zealand
- 5. Latin America
- 6. Middle East and Africa
Power Module Packaging Industry REPORT HIGHLIGHTS
| Aspects | Details |
|---|---|
| Study Period | 2019-2033 |
| Base Year | 2024 |
| Estimated Year | 2025 |
| Forecast Period | 2025-2033 |
| Historical Period | 2019-2024 |
| Growth Rate | CAGR of 9.78% from 2019-2033 |
| Segmentation |
|
Table of Contents
- 1. Introduction
- 1.1. Research Scope
- 1.2. Market Segmentation
- 1.3. Research Methodology
- 1.4. Definitions and Assumptions
- 2. Executive Summary
- 2.1. Introduction
- 3. Market Dynamics
- 3.1. Introduction
- 3.2. Market Drivers
- 3.2.1. Increasing Demand from the Industrial and Consumer Electronics Segment; Rising Demand for Energy-efficient Devices
- 3.3. Market Restrains
- 3.3.1. Market Consolidation Affecting Overall Profitability
- 3.4. Market Trends
- 3.4.1. Increasing Demand from the Industrial and Consumer Electronics Segment to Drive the Market
- 4. Market Factor Analysis
- 4.1. Porters Five Forces
- 4.2. Supply/Value Chain
- 4.3. PESTEL analysis
- 4.4. Market Entropy
- 4.5. Patent/Trademark Analysis
- 5. Global Power Module Packaging Industry Analysis, Insights and Forecast, 2019-2031
- 5.1. Market Analysis, Insights and Forecast - by Technology
- 5.1.1. Substrate
- 5.1.2. Baseplate
- 5.1.3. Die Attach
- 5.1.4. Substrate Attach
- 5.1.5. Encapsulations
- 5.1.6. Interconnections
- 5.1.7. Other Technologies
- 5.2. Market Analysis, Insights and Forecast - by Region
- 5.2.1. North America
- 5.2.2. Europe
- 5.2.3. Asia
- 5.2.4. Australia and New Zealand
- 5.2.5. Latin America
- 5.2.6. Middle East and Africa
- 5.1. Market Analysis, Insights and Forecast - by Technology
- 6. North America Power Module Packaging Industry Analysis, Insights and Forecast, 2019-2031
- 6.1. Market Analysis, Insights and Forecast - by Technology
- 6.1.1. Substrate
- 6.1.2. Baseplate
- 6.1.3. Die Attach
- 6.1.4. Substrate Attach
- 6.1.5. Encapsulations
- 6.1.6. Interconnections
- 6.1.7. Other Technologies
- 6.1. Market Analysis, Insights and Forecast - by Technology
- 7. Europe Power Module Packaging Industry Analysis, Insights and Forecast, 2019-2031
- 7.1. Market Analysis, Insights and Forecast - by Technology
- 7.1.1. Substrate
- 7.1.2. Baseplate
- 7.1.3. Die Attach
- 7.1.4. Substrate Attach
- 7.1.5. Encapsulations
- 7.1.6. Interconnections
- 7.1.7. Other Technologies
- 7.1. Market Analysis, Insights and Forecast - by Technology
- 8. Asia Power Module Packaging Industry Analysis, Insights and Forecast, 2019-2031
- 8.1. Market Analysis, Insights and Forecast - by Technology
- 8.1.1. Substrate
- 8.1.2. Baseplate
- 8.1.3. Die Attach
- 8.1.4. Substrate Attach
- 8.1.5. Encapsulations
- 8.1.6. Interconnections
- 8.1.7. Other Technologies
- 8.1. Market Analysis, Insights and Forecast - by Technology
- 9. Australia and New Zealand Power Module Packaging Industry Analysis, Insights and Forecast, 2019-2031
- 9.1. Market Analysis, Insights and Forecast - by Technology
- 9.1.1. Substrate
- 9.1.2. Baseplate
- 9.1.3. Die Attach
- 9.1.4. Substrate Attach
- 9.1.5. Encapsulations
- 9.1.6. Interconnections
- 9.1.7. Other Technologies
- 9.1. Market Analysis, Insights and Forecast - by Technology
- 10. Latin America Power Module Packaging Industry Analysis, Insights and Forecast, 2019-2031
- 10.1. Market Analysis, Insights and Forecast - by Technology
- 10.1.1. Substrate
- 10.1.2. Baseplate
- 10.1.3. Die Attach
- 10.1.4. Substrate Attach
- 10.1.5. Encapsulations
- 10.1.6. Interconnections
- 10.1.7. Other Technologies
- 10.1. Market Analysis, Insights and Forecast - by Technology
- 11. Middle East and Africa Power Module Packaging Industry Analysis, Insights and Forecast, 2019-2031
- 11.1. Market Analysis, Insights and Forecast - by Technology
- 11.1.1. Substrate
- 11.1.2. Baseplate
- 11.1.3. Die Attach
- 11.1.4. Substrate Attach
- 11.1.5. Encapsulations
- 11.1.6. Interconnections
- 11.1.7. Other Technologies
- 11.1. Market Analysis, Insights and Forecast - by Technology
- 12. North America Power Module Packaging Industry Analysis, Insights and Forecast, 2019-2031
- 12.1. Market Analysis, Insights and Forecast - By Country/Sub-region
- 12.1.1 United States
- 12.1.2 Canada
- 12.1.3 Mexico
- 13. Europe Power Module Packaging Industry Analysis, Insights and Forecast, 2019-2031
- 13.1. Market Analysis, Insights and Forecast - By Country/Sub-region
- 13.1.1 Germany
- 13.1.2 United Kingdom
- 13.1.3 France
- 13.1.4 Spain
- 13.1.5 Italy
- 13.1.6 Spain
- 13.1.7 Belgium
- 13.1.8 Netherland
- 13.1.9 Nordics
- 13.1.10 Rest of Europe
- 14. Asia Pacific Power Module Packaging Industry Analysis, Insights and Forecast, 2019-2031
- 14.1. Market Analysis, Insights and Forecast - By Country/Sub-region
- 14.1.1 China
- 14.1.2 Japan
- 14.1.3 India
- 14.1.4 South Korea
- 14.1.5 Southeast Asia
- 14.1.6 Australia
- 14.1.7 Indonesia
- 14.1.8 Phillipes
- 14.1.9 Singapore
- 14.1.10 Thailandc
- 14.1.11 Rest of Asia Pacific
- 15. South America Power Module Packaging Industry Analysis, Insights and Forecast, 2019-2031
- 15.1. Market Analysis, Insights and Forecast - By Country/Sub-region
- 15.1.1 Brazil
- 15.1.2 Argentina
- 15.1.3 Peru
- 15.1.4 Chile
- 15.1.5 Colombia
- 15.1.6 Ecuador
- 15.1.7 Venezuela
- 15.1.8 Rest of South America
- 16. North America Power Module Packaging Industry Analysis, Insights and Forecast, 2019-2031
- 16.1. Market Analysis, Insights and Forecast - By Country/Sub-region
- 16.1.1 United States
- 16.1.2 Canada
- 16.1.3 Mexico
- 17. MEA Power Module Packaging Industry Analysis, Insights and Forecast, 2019-2031
- 17.1. Market Analysis, Insights and Forecast - By Country/Sub-region
- 17.1.1 United Arab Emirates
- 17.1.2 Saudi Arabia
- 17.1.3 South Africa
- 17.1.4 Rest of Middle East and Africa
- 18. Competitive Analysis
- 18.1. Global Market Share Analysis 2024
- 18.2. Company Profiles
- 18.2.1 Toshiba Corporatio
- 18.2.1.1. Overview
- 18.2.1.2. Products
- 18.2.1.3. SWOT Analysis
- 18.2.1.4. Recent Developments
- 18.2.1.5. Financials (Based on Availability)
- 18.2.2 Infineon Technologies AG
- 18.2.2.1. Overview
- 18.2.2.2. Products
- 18.2.2.3. SWOT Analysis
- 18.2.2.4. Recent Developments
- 18.2.2.5. Financials (Based on Availability)
- 18.2.3 Fuji Electric Co Ltd
- 18.2.3.1. Overview
- 18.2.3.2. Products
- 18.2.3.3. SWOT Analysis
- 18.2.3.4. Recent Developments
- 18.2.3.5. Financials (Based on Availability)
- 18.2.4 Texas Instruments Inc
- 18.2.4.1. Overview
- 18.2.4.2. Products
- 18.2.4.3. SWOT Analysis
- 18.2.4.4. Recent Developments
- 18.2.4.5. Financials (Based on Availability)
- 18.2.5 Hitachi Ltd
- 18.2.5.1. Overview
- 18.2.5.2. Products
- 18.2.5.3. SWOT Analysis
- 18.2.5.4. Recent Developments
- 18.2.5.5. Financials (Based on Availability)
- 18.2.6 Mitsubishi Electric Corporation
- 18.2.6.1. Overview
- 18.2.6.2. Products
- 18.2.6.3. SWOT Analysis
- 18.2.6.4. Recent Developments
- 18.2.6.5. Financials (Based on Availability)
- 18.2.7 Starpower Semiconductor Ltd
- 18.2.7.1. Overview
- 18.2.7.2. Products
- 18.2.7.3. SWOT Analysis
- 18.2.7.4. Recent Developments
- 18.2.7.5. Financials (Based on Availability)
- 18.2.8 STMicroelectronics NV
- 18.2.8.1. Overview
- 18.2.8.2. Products
- 18.2.8.3. SWOT Analysis
- 18.2.8.4. Recent Developments
- 18.2.8.5. Financials (Based on Availability)
- 18.2.9 Macmic Science & Technology Co Ltd
- 18.2.9.1. Overview
- 18.2.9.2. Products
- 18.2.9.3. SWOT Analysis
- 18.2.9.4. Recent Developments
- 18.2.9.5. Financials (Based on Availability)
- 18.2.10 Semikron Danfoss Holding A/S (Danfoss A/S)
- 18.2.10.1. Overview
- 18.2.10.2. Products
- 18.2.10.3. SWOT Analysis
- 18.2.10.4. Recent Developments
- 18.2.10.5. Financials (Based on Availability)
- 18.2.11 Amkor Technology Inc
- 18.2.11.1. Overview
- 18.2.11.2. Products
- 18.2.11.3. SWOT Analysis
- 18.2.11.4. Recent Developments
- 18.2.11.5. Financials (Based on Availability)
- 18.2.1 Toshiba Corporatio
List of Figures
- Figure 1: Global Power Module Packaging Industry Revenue Breakdown (Million, %) by Region 2024 & 2032
- Figure 2: North America Power Module Packaging Industry Revenue (Million), by Country 2024 & 2032
- Figure 3: North America Power Module Packaging Industry Revenue Share (%), by Country 2024 & 2032
- Figure 4: Europe Power Module Packaging Industry Revenue (Million), by Country 2024 & 2032
- Figure 5: Europe Power Module Packaging Industry Revenue Share (%), by Country 2024 & 2032
- Figure 6: Asia Pacific Power Module Packaging Industry Revenue (Million), by Country 2024 & 2032
- Figure 7: Asia Pacific Power Module Packaging Industry Revenue Share (%), by Country 2024 & 2032
- Figure 8: South America Power Module Packaging Industry Revenue (Million), by Country 2024 & 2032
- Figure 9: South America Power Module Packaging Industry Revenue Share (%), by Country 2024 & 2032
- Figure 10: North America Power Module Packaging Industry Revenue (Million), by Country 2024 & 2032
- Figure 11: North America Power Module Packaging Industry Revenue Share (%), by Country 2024 & 2032
- Figure 12: MEA Power Module Packaging Industry Revenue (Million), by Country 2024 & 2032
- Figure 13: MEA Power Module Packaging Industry Revenue Share (%), by Country 2024 & 2032
- Figure 14: North America Power Module Packaging Industry Revenue (Million), by Technology 2024 & 2032
- Figure 15: North America Power Module Packaging Industry Revenue Share (%), by Technology 2024 & 2032
- Figure 16: North America Power Module Packaging Industry Revenue (Million), by Country 2024 & 2032
- Figure 17: North America Power Module Packaging Industry Revenue Share (%), by Country 2024 & 2032
- Figure 18: Europe Power Module Packaging Industry Revenue (Million), by Technology 2024 & 2032
- Figure 19: Europe Power Module Packaging Industry Revenue Share (%), by Technology 2024 & 2032
- Figure 20: Europe Power Module Packaging Industry Revenue (Million), by Country 2024 & 2032
- Figure 21: Europe Power Module Packaging Industry Revenue Share (%), by Country 2024 & 2032
- Figure 22: Asia Power Module Packaging Industry Revenue (Million), by Technology 2024 & 2032
- Figure 23: Asia Power Module Packaging Industry Revenue Share (%), by Technology 2024 & 2032
- Figure 24: Asia Power Module Packaging Industry Revenue (Million), by Country 2024 & 2032
- Figure 25: Asia Power Module Packaging Industry Revenue Share (%), by Country 2024 & 2032
- Figure 26: Australia and New Zealand Power Module Packaging Industry Revenue (Million), by Technology 2024 & 2032
- Figure 27: Australia and New Zealand Power Module Packaging Industry Revenue Share (%), by Technology 2024 & 2032
- Figure 28: Australia and New Zealand Power Module Packaging Industry Revenue (Million), by Country 2024 & 2032
- Figure 29: Australia and New Zealand Power Module Packaging Industry Revenue Share (%), by Country 2024 & 2032
- Figure 30: Latin America Power Module Packaging Industry Revenue (Million), by Technology 2024 & 2032
- Figure 31: Latin America Power Module Packaging Industry Revenue Share (%), by Technology 2024 & 2032
- Figure 32: Latin America Power Module Packaging Industry Revenue (Million), by Country 2024 & 2032
- Figure 33: Latin America Power Module Packaging Industry Revenue Share (%), by Country 2024 & 2032
- Figure 34: Middle East and Africa Power Module Packaging Industry Revenue (Million), by Technology 2024 & 2032
- Figure 35: Middle East and Africa Power Module Packaging Industry Revenue Share (%), by Technology 2024 & 2032
- Figure 36: Middle East and Africa Power Module Packaging Industry Revenue (Million), by Country 2024 & 2032
- Figure 37: Middle East and Africa Power Module Packaging Industry Revenue Share (%), by Country 2024 & 2032
List of Tables
- Table 1: Global Power Module Packaging Industry Revenue Million Forecast, by Region 2019 & 2032
- Table 2: Global Power Module Packaging Industry Revenue Million Forecast, by Technology 2019 & 2032
- Table 3: Global Power Module Packaging Industry Revenue Million Forecast, by Region 2019 & 2032
- Table 4: Global Power Module Packaging Industry Revenue Million Forecast, by Country 2019 & 2032
- Table 5: United States Power Module Packaging Industry Revenue (Million) Forecast, by Application 2019 & 2032
- Table 6: Canada Power Module Packaging Industry Revenue (Million) Forecast, by Application 2019 & 2032
- Table 7: Mexico Power Module Packaging Industry Revenue (Million) Forecast, by Application 2019 & 2032
- Table 8: Global Power Module Packaging Industry Revenue Million Forecast, by Country 2019 & 2032
- Table 9: Germany Power Module Packaging Industry Revenue (Million) Forecast, by Application 2019 & 2032
- Table 10: United Kingdom Power Module Packaging Industry Revenue (Million) Forecast, by Application 2019 & 2032
- Table 11: France Power Module Packaging Industry Revenue (Million) Forecast, by Application 2019 & 2032
- Table 12: Spain Power Module Packaging Industry Revenue (Million) Forecast, by Application 2019 & 2032
- Table 13: Italy Power Module Packaging Industry Revenue (Million) Forecast, by Application 2019 & 2032
- Table 14: Spain Power Module Packaging Industry Revenue (Million) Forecast, by Application 2019 & 2032
- Table 15: Belgium Power Module Packaging Industry Revenue (Million) Forecast, by Application 2019 & 2032
- Table 16: Netherland Power Module Packaging Industry Revenue (Million) Forecast, by Application 2019 & 2032
- Table 17: Nordics Power Module Packaging Industry Revenue (Million) Forecast, by Application 2019 & 2032
- Table 18: Rest of Europe Power Module Packaging Industry Revenue (Million) Forecast, by Application 2019 & 2032
- Table 19: Global Power Module Packaging Industry Revenue Million Forecast, by Country 2019 & 2032
- Table 20: China Power Module Packaging Industry Revenue (Million) Forecast, by Application 2019 & 2032
- Table 21: Japan Power Module Packaging Industry Revenue (Million) Forecast, by Application 2019 & 2032
- Table 22: India Power Module Packaging Industry Revenue (Million) Forecast, by Application 2019 & 2032
- Table 23: South Korea Power Module Packaging Industry Revenue (Million) Forecast, by Application 2019 & 2032
- Table 24: Southeast Asia Power Module Packaging Industry Revenue (Million) Forecast, by Application 2019 & 2032
- Table 25: Australia Power Module Packaging Industry Revenue (Million) Forecast, by Application 2019 & 2032
- Table 26: Indonesia Power Module Packaging Industry Revenue (Million) Forecast, by Application 2019 & 2032
- Table 27: Phillipes Power Module Packaging Industry Revenue (Million) Forecast, by Application 2019 & 2032
- Table 28: Singapore Power Module Packaging Industry Revenue (Million) Forecast, by Application 2019 & 2032
- Table 29: Thailandc Power Module Packaging Industry Revenue (Million) Forecast, by Application 2019 & 2032
- Table 30: Rest of Asia Pacific Power Module Packaging Industry Revenue (Million) Forecast, by Application 2019 & 2032
- Table 31: Global Power Module Packaging Industry Revenue Million Forecast, by Country 2019 & 2032
- Table 32: Brazil Power Module Packaging Industry Revenue (Million) Forecast, by Application 2019 & 2032
- Table 33: Argentina Power Module Packaging Industry Revenue (Million) Forecast, by Application 2019 & 2032
- Table 34: Peru Power Module Packaging Industry Revenue (Million) Forecast, by Application 2019 & 2032
- Table 35: Chile Power Module Packaging Industry Revenue (Million) Forecast, by Application 2019 & 2032
- Table 36: Colombia Power Module Packaging Industry Revenue (Million) Forecast, by Application 2019 & 2032
- Table 37: Ecuador Power Module Packaging Industry Revenue (Million) Forecast, by Application 2019 & 2032
- Table 38: Venezuela Power Module Packaging Industry Revenue (Million) Forecast, by Application 2019 & 2032
- Table 39: Rest of South America Power Module Packaging Industry Revenue (Million) Forecast, by Application 2019 & 2032
- Table 40: Global Power Module Packaging Industry Revenue Million Forecast, by Country 2019 & 2032
- Table 41: United States Power Module Packaging Industry Revenue (Million) Forecast, by Application 2019 & 2032
- Table 42: Canada Power Module Packaging Industry Revenue (Million) Forecast, by Application 2019 & 2032
- Table 43: Mexico Power Module Packaging Industry Revenue (Million) Forecast, by Application 2019 & 2032
- Table 44: Global Power Module Packaging Industry Revenue Million Forecast, by Country 2019 & 2032
- Table 45: United Arab Emirates Power Module Packaging Industry Revenue (Million) Forecast, by Application 2019 & 2032
- Table 46: Saudi Arabia Power Module Packaging Industry Revenue (Million) Forecast, by Application 2019 & 2032
- Table 47: South Africa Power Module Packaging Industry Revenue (Million) Forecast, by Application 2019 & 2032
- Table 48: Rest of Middle East and Africa Power Module Packaging Industry Revenue (Million) Forecast, by Application 2019 & 2032
- Table 49: Global Power Module Packaging Industry Revenue Million Forecast, by Technology 2019 & 2032
- Table 50: Global Power Module Packaging Industry Revenue Million Forecast, by Country 2019 & 2032
- Table 51: Global Power Module Packaging Industry Revenue Million Forecast, by Technology 2019 & 2032
- Table 52: Global Power Module Packaging Industry Revenue Million Forecast, by Country 2019 & 2032
- Table 53: Global Power Module Packaging Industry Revenue Million Forecast, by Technology 2019 & 2032
- Table 54: Global Power Module Packaging Industry Revenue Million Forecast, by Country 2019 & 2032
- Table 55: Global Power Module Packaging Industry Revenue Million Forecast, by Technology 2019 & 2032
- Table 56: Global Power Module Packaging Industry Revenue Million Forecast, by Country 2019 & 2032
- Table 57: Global Power Module Packaging Industry Revenue Million Forecast, by Technology 2019 & 2032
- Table 58: Global Power Module Packaging Industry Revenue Million Forecast, by Country 2019 & 2032
- Table 59: Global Power Module Packaging Industry Revenue Million Forecast, by Technology 2019 & 2032
- Table 60: Global Power Module Packaging Industry Revenue Million Forecast, by Country 2019 & 2032
Frequently Asked Questions
1. What is the projected Compound Annual Growth Rate (CAGR) of the Power Module Packaging Industry?
The projected CAGR is approximately 9.78%.
2. Which companies are prominent players in the Power Module Packaging Industry?
Key companies in the market include Toshiba Corporatio, Infineon Technologies AG, Fuji Electric Co Ltd, Texas Instruments Inc, Hitachi Ltd, Mitsubishi Electric Corporation, Starpower Semiconductor Ltd, STMicroelectronics NV, Macmic Science & Technology Co Ltd, Semikron Danfoss Holding A/S (Danfoss A/S), Amkor Technology Inc.
3. What are the main segments of the Power Module Packaging Industry?
The market segments include Technology.
4. Can you provide details about the market size?
The market size is estimated to be USD 2.5 Million as of 2022.
5. What are some drivers contributing to market growth?
Increasing Demand from the Industrial and Consumer Electronics Segment; Rising Demand for Energy-efficient Devices.
6. What are the notable trends driving market growth?
Increasing Demand from the Industrial and Consumer Electronics Segment to Drive the Market.
7. Are there any restraints impacting market growth?
Market Consolidation Affecting Overall Profitability.
8. Can you provide examples of recent developments in the market?
December 2023 - STMicroelectronics announced that it signed a long-term silicon carbide (SiC) supply agreement with Li Auto. Under this agreement, STMicroelectronics will provide Li Auto with SiC MOSFET devices to support Li Auto’s strategy around high-voltage battery electric vehicles (BEVs) in various market segments.
9. What pricing options are available for accessing the report?
Pricing options include single-user, multi-user, and enterprise licenses priced at USD 4750, USD 5250, and USD 8750 respectively.
10. Is the market size provided in terms of value or volume?
The market size is provided in terms of value, measured in Million.
11. Are there any specific market keywords associated with the report?
Yes, the market keyword associated with the report is "Power Module Packaging Industry," which aids in identifying and referencing the specific market segment covered.
12. How do I determine which pricing option suits my needs best?
The pricing options vary based on user requirements and access needs. Individual users may opt for single-user licenses, while businesses requiring broader access may choose multi-user or enterprise licenses for cost-effective access to the report.
13. Are there any additional resources or data provided in the Power Module Packaging Industry report?
While the report offers comprehensive insights, it's advisable to review the specific contents or supplementary materials provided to ascertain if additional resources or data are available.
14. How can I stay updated on further developments or reports in the Power Module Packaging Industry?
To stay informed about further developments, trends, and reports in the Power Module Packaging Industry, consider subscribing to industry newsletters, following relevant companies and organizations, or regularly checking reputable industry news sources and publications.
Methodology
Step 1 - Identification of Relevant Samples Size from Population Database


Step 2 - Approaches for Defining Global Market Size (Value, Volume* & Price*)

Note*: In applicable scenarios
Step 3 - Data Sources
Primary Research
- Web Analytics
- Survey Reports
- Research Institute
- Latest Research Reports
- Opinion Leaders
Secondary Research
- Annual Reports
- White Paper
- Latest Press Release
- Industry Association
- Paid Database
- Investor Presentations

Step 4 - Data Triangulation
Involves using different sources of information in order to increase the validity of a study
These sources are likely to be stakeholders in a program - participants, other researchers, program staff, other community members, and so on.
Then we put all data in single framework & apply various statistical tools to find out the dynamic on the market.
During the analysis stage, feedback from the stakeholder groups would be compared to determine areas of agreement as well as areas of divergence


