
Key Insights
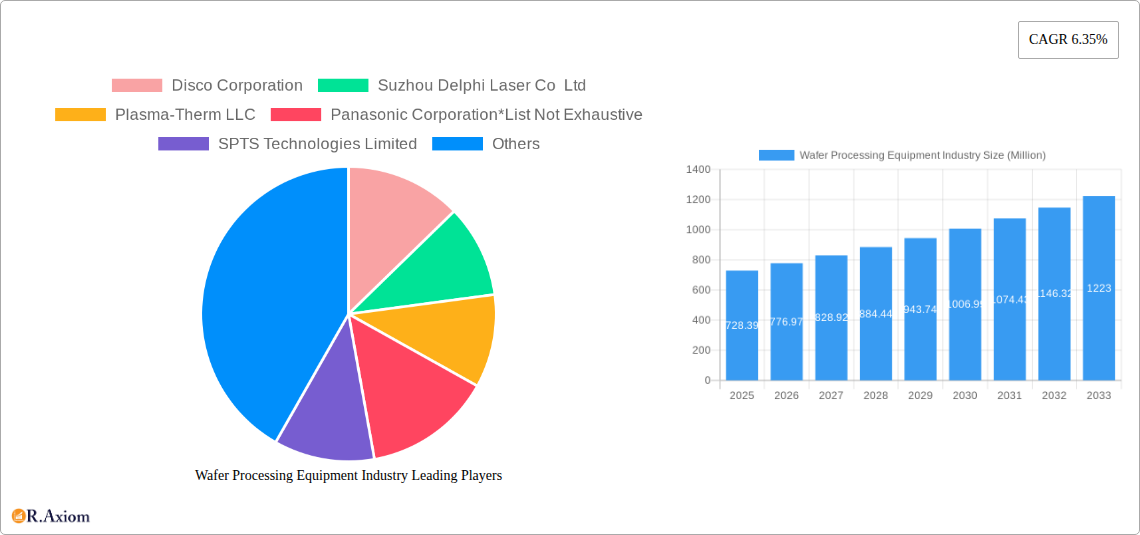
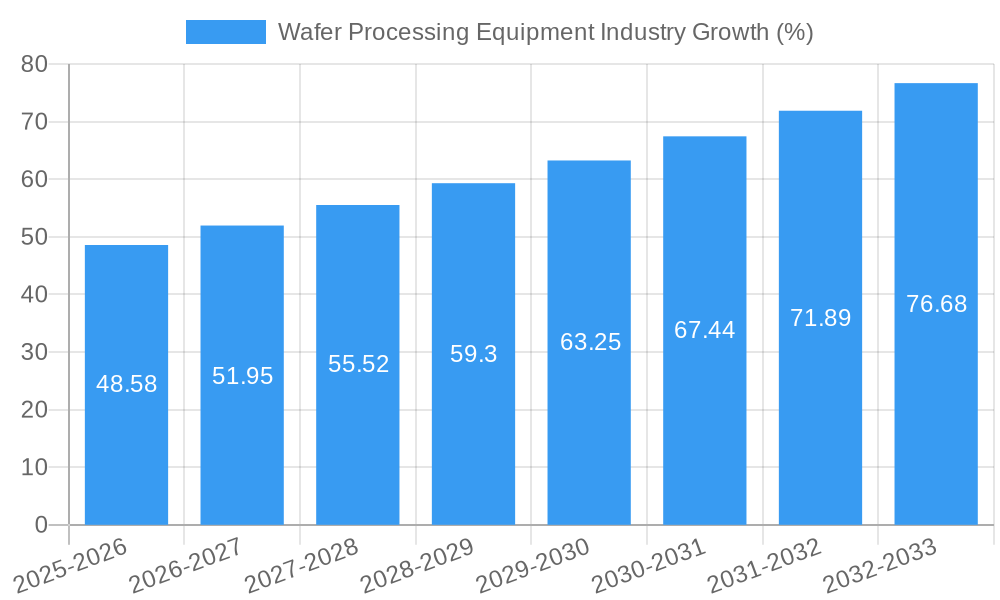
The global wafer processing equipment market, valued at $728.39 million in 2025, is projected to experience robust growth, driven by the increasing demand for advanced semiconductor devices across diverse applications. The Compound Annual Growth Rate (CAGR) of 6.35% from 2025 to 2033 indicates a significant expansion, fueled primarily by the burgeoning electronics industry, particularly in areas like 5G infrastructure, artificial intelligence (AI), and the Internet of Things (IoT). Growth is further propelled by continuous advancements in semiconductor technology, necessitating more sophisticated and precise wafer processing equipment. The market segmentation reveals significant opportunities across various applications, with memory and logic TSV (Through-Silicon Vias) representing a major segment due to their crucial role in high-performance computing. Similarly, the increasing adoption of miniaturization in devices like MEMS (Microelectromechanical Systems) and CMOS Image Sensors is driving demand for smaller wafer sizes and specialized processing equipment. While challenges exist, such as high capital expenditure and the complexities involved in handling advanced materials, the overall market outlook remains positive, driven by technological innovation and the ever-increasing reliance on semiconductor technology in modern life.
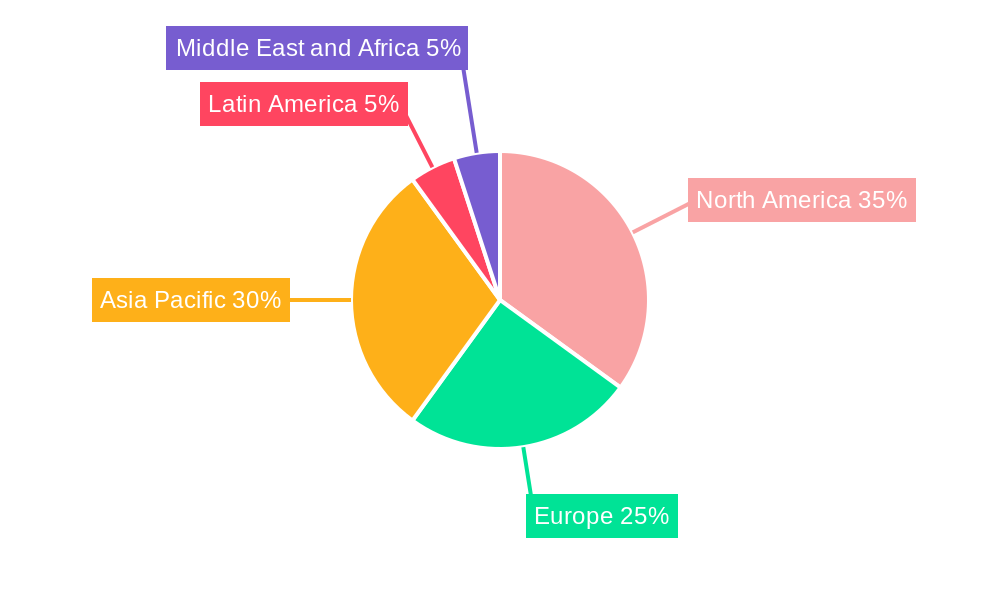
The regional distribution of the market showcases a dynamic landscape. North America, with its established semiconductor industry, is likely to hold a substantial share, while the Asia-Pacific region, particularly China and South Korea, is expected to witness significant growth due to increasing domestic manufacturing and investments in semiconductor fabrication facilities. Europe and other regions will also contribute, but at a potentially slower pace compared to the dominant players. Key players such as Disco Corporation, Suzhou Delphi Laser Co Ltd, and others are engaged in intense competition, leading to innovation and price optimization within the market. This competitive landscape is anticipated to further accelerate the market's growth and facilitate technological advancements within the wafer processing sector, resulting in improved efficiency and reduced costs over the forecast period. The continuous evolution of materials and manufacturing techniques necessitates a flexible and adaptable market, leading to ongoing innovation in wafer processing equipment.
Wafer Processing Equipment Industry: Market Analysis & Forecast 2019-2033
This comprehensive report provides a detailed analysis of the global Wafer Processing Equipment market, offering invaluable insights for industry stakeholders, investors, and strategic decision-makers. The report covers the period 2019-2033, with a focus on the forecast period 2025-2033, using 2025 as the base year. The analysis includes market sizing, segmentation, competitive landscape, and future growth projections, all based on rigorous research and data analysis. The global market value in 2024 is estimated at $xx Million, with a projected value of $xx Million by 2033.
Wafer Processing Equipment Industry Market Concentration & Innovation
The Wafer Processing Equipment market exhibits a moderately concentrated structure, with key players holding significant market share. Disco Corporation, Suzhou Delphi Laser Co Ltd, Plasma-Therm LLC, and Panasonic Corporation are among the prominent players, although the market is not dominated by a small number of companies. The industry is characterized by ongoing innovation driven by the need for higher precision, increased throughput, and reduced manufacturing costs in semiconductor production. Several factors contribute to market concentration:
- High capital expenditures: The high cost of R&D and manufacturing creates significant barriers to entry for new players.
- Technological expertise: Advanced technological capabilities are crucial for success, leading to consolidation through M&A activities.
- Strong intellectual property: Companies often rely on proprietary technologies, providing a competitive edge.
Recent M&A activities include the March 2022 acquisition of real estate by DISCO Corporation for R&D expansion, reflecting the sector's focus on technological advancement. While precise M&A deal values are unavailable for all transactions, the overall trend signifies substantial investment in innovation and expansion within the industry. Regulatory frameworks concerning technology export controls and environmental regulations influence market dynamics. Product substitutes, such as alternative materials or processes for wafer processing, remain limited due to the stringent requirements of semiconductor manufacturing. End-user trends toward miniaturization and increased performance drive demand for sophisticated wafer processing equipment.
Wafer Processing Equipment Industry Industry Trends & Insights
The Wafer Processing Equipment market is experiencing robust growth, fueled by several key trends. The increasing demand for advanced semiconductors in various applications, including 5G, AI, and IoT, is a major driver. The Compound Annual Growth Rate (CAGR) is projected to be xx% during the forecast period. Technological disruptions, such as the adoption of advanced materials and processing techniques (e.g., EUV lithography), are reshaping the industry landscape. Market penetration of advanced equipment is increasing as manufacturers strive to improve yield and reduce costs. Consumer preferences for smaller, faster, and more energy-efficient electronic devices are driving innovation and demand in the market. Competitive dynamics are intense, with companies vying for market share through product innovation, strategic partnerships, and capacity expansion. The replacement of older 8-inch wafer equipment, as exemplified by DB HiTek's planned investment exceeding KRW 115.2 billion, showcases the significant capital expenditure involved in upgrading production capabilities to meet increasing demand.
Dominant Markets & Segments in Wafer Processing Equipment Industry
The 12-inch wafer segment dominates the market in terms of wafer size, driven by the increasing production of advanced logic chips and memory devices. Within the applications segment, Memory and Logic (TSV) holds the largest share, followed by Power Devices and CMOS Image Sensors. Key drivers for these segments are:
- Memory and Logic (TSV): High demand for high-capacity memory and advanced logic chips.
- Power Devices: Growing adoption of electric vehicles and renewable energy infrastructure.
- CMOS Image Sensors: Expansion of the smartphone and automotive markets.
Geographic dominance: Currently, Asia is the leading region in terms of production and consumption of wafer processing equipment, driven by strong semiconductor manufacturing industries in countries like Taiwan, South Korea, and China. This dominance is expected to continue during the forecast period. Key drivers for regional dominance include:
- Government support: Significant government investments and incentives in the semiconductor industry.
- Established infrastructure: Well-developed infrastructure and skilled workforce.
- Proximity to key markets: Strategic location for supplying global demand.
Wafer Processing Equipment Industry Product Developments
Recent product innovations focus on enhanced precision, higher throughput, and improved process control. Companies are developing advanced thinning and dicing equipment with capabilities to handle larger and thinner wafers. These advancements contribute to higher yields and reduced manufacturing costs, catering to the growing demand for smaller and more powerful semiconductor devices. The market is witnessing advancements in laser-based technologies for dicing and thinning, offering greater precision and faster processing speeds. These improvements address market needs for efficient and cost-effective production.
Report Scope & Segmentation Analysis
This report segments the Wafer Processing Equipment market by application (Memory and Logic (TSV), MEMS Devices, Power Devices, CMOS Image Sensors, RFID), wafer size (less than 4 inch, 5 inch and 6 inch, 8 inch, 12 inch), and equipment type (Thinning Equipment, Dicing Equipment). Each segment is analyzed in terms of market size, growth projections, and competitive dynamics. The 12-inch wafer segment exhibits the highest growth, driven by high-end semiconductor manufacturing. Similarly, the Memory and Logic (TSV) application segment shows significant growth potential, owing to the expansion of the data center and high-performance computing markets. The Thinning Equipment segment is anticipated to have a higher CAGR than the Dicing Equipment segment, driven by the increasing need for thinner wafers in advanced semiconductor devices.
Key Drivers of Wafer Processing Equipment Industry Growth
The Wafer Processing Equipment market is propelled by several key factors:
- Technological advancements: Continuous innovation in semiconductor technology necessitates the development of advanced wafer processing equipment.
- Growing demand for electronics: The increasing demand for smartphones, computers, and other electronic devices fuels the demand for semiconductors and related equipment.
- Government initiatives: Government support and incentives for the semiconductor industry stimulate market growth. For instance, several countries are actively investing in domestic semiconductor manufacturing capabilities.
Challenges in the Wafer Processing Equipment Industry Sector
The industry faces several challenges:
- High capital expenditure: The substantial investment required for R&D and manufacturing poses a significant barrier to entry for new players.
- Supply chain disruptions: Geopolitical uncertainties and pandemics can impact the availability of raw materials and components. This can lead to production delays and increased costs, as demonstrated in recent years.
- Intense competition: The market is highly competitive, with established players constantly vying for market share.
Emerging Opportunities in Wafer Processing Equipment Industry
Several opportunities exist for growth:
- Expansion into new markets: Emerging markets in Asia and other regions present opportunities for growth.
- Development of advanced technologies: Innovation in areas such as AI-driven process optimization and advanced materials processing offers substantial market potential.
- Focus on sustainability: The development of energy-efficient and environmentally friendly equipment aligns with growing industry sustainability initiatives.
Leading Players in the Wafer Processing Equipment Industry Market
- Disco Corporation
- Suzhou Delphi Laser Co Ltd
- Plasma-Therm LLC
- Panasonic Corporation
- SPTS Technologies Limited
- ASM Laser Separation International (ALSI) B V
- Tokyo Seimitsu Co Ltd (Accretech)
- Advanced Dicing Technologies Ltd
- Neon Tech Co Ltd
- Han's Laser Technology Industry Group Co Ltd
Key Developments in Wafer Processing Equipment Industry Industry
- March 2022: DISCO Corporation acquired real estate for R&D expansion, signifying commitment to innovation and capacity building.
- March 2022: DB HiTek announced significant investment in new 8-inch wafer equipment and capacity expansion, indicating strong demand in the market.
Strategic Outlook for Wafer Processing Equipment Industry Market
The Wafer Processing Equipment market is poised for continued growth, driven by strong demand for advanced semiconductors, technological innovation, and supportive government policies. Companies focusing on advanced technologies, strategic partnerships, and efficient supply chains are well-positioned to benefit from the industry's future expansion. The market is expected to witness considerable growth during the forecast period, creating significant opportunities for both established players and emerging companies.
Wafer Processing Equipment Industry Segmentation
-
1. Equipment Type
- 1.1. Thinning Equipment
-
1.2. Dicing Equipment
- 1.2.1. Blade Dicing
- 1.2.2. Laser Ablation
- 1.2.3. Stealth Dicing
- 1.2.4. Plasma Dicing
-
2. Application
- 2.1. Memory and Logic (TSV)
- 2.2. MEMS Devices
- 2.3. Power Devices
- 2.4. CMOS Image Sensors
- 2.5. RFID
- 3. Wafer Thickness Trends
-
4. Wafer Size
- 4.1. Less than 4 inch
- 4.2. 5 inch and 6 inch
- 4.3. 8 inch
- 4.4. 12 inch
Wafer Processing Equipment Industry Segmentation By Geography
-
1. North America
- 1.1. United States
- 1.2. Canada
-
2. Europe
- 2.1. United Kingdom
- 2.2. Germany
- 2.3. France
- 2.4. Spain
- 2.5. Italy
- 2.6. Rest of Europe
-
3. Asia Pacific
- 3.1. China
- 3.2. Japan
- 3.3. Australia
- 3.4. India
- 3.5. Rest of Asia Pacific
-
4. Latin America
- 4.1. Mexico
- 4.2. Brazil
- 4.3. Rest of Latin America
-
5. Middle East and Africa
- 5.1. South Africa
- 5.2. Saudi Arabia
- 5.3. Rest of Middle East and Africa
Wafer Processing Equipment Industry REPORT HIGHLIGHTS
| Aspects | Details |
|---|---|
| Study Period | 2019-2033 |
| Base Year | 2024 |
| Estimated Year | 2025 |
| Forecast Period | 2025-2033 |
| Historical Period | 2019-2024 |
| Growth Rate | CAGR of 6.35% from 2019-2033 |
| Segmentation |
|
Table of Contents
- 1. Introduction
- 1.1. Research Scope
- 1.2. Market Segmentation
- 1.3. Research Methodology
- 1.4. Definitions and Assumptions
- 2. Executive Summary
- 2.1. Introduction
- 3. Market Dynamics
- 3.1. Introduction
- 3.2. Market Drivers
- 3.2.1 Increasing Demand for Smart Cards
- 3.2.2 RFID Technology
- 3.2.3 and Automotive Power ICs; Increasing Need for Miniaturization of Semiconductors
- 3.3. Market Restrains
- 3.3.1. Manufacturing Challenges
- 3.4. Market Trends
- 3.4.1. Increasing Need for Miniaturization of Semiconductors to Drive the Market
- 4. Market Factor Analysis
- 4.1. Porters Five Forces
- 4.2. Supply/Value Chain
- 4.3. PESTEL analysis
- 4.4. Market Entropy
- 4.5. Patent/Trademark Analysis
- 5. Global Wafer Processing Equipment Industry Analysis, Insights and Forecast, 2019-2031
- 5.1. Market Analysis, Insights and Forecast - by Equipment Type
- 5.1.1. Thinning Equipment
- 5.1.2. Dicing Equipment
- 5.1.2.1. Blade Dicing
- 5.1.2.2. Laser Ablation
- 5.1.2.3. Stealth Dicing
- 5.1.2.4. Plasma Dicing
- 5.2. Market Analysis, Insights and Forecast - by Application
- 5.2.1. Memory and Logic (TSV)
- 5.2.2. MEMS Devices
- 5.2.3. Power Devices
- 5.2.4. CMOS Image Sensors
- 5.2.5. RFID
- 5.3. Market Analysis, Insights and Forecast - by Wafer Thickness Trends
- 5.4. Market Analysis, Insights and Forecast - by Wafer Size
- 5.4.1. Less than 4 inch
- 5.4.2. 5 inch and 6 inch
- 5.4.3. 8 inch
- 5.4.4. 12 inch
- 5.5. Market Analysis, Insights and Forecast - by Region
- 5.5.1. North America
- 5.5.2. Europe
- 5.5.3. Asia Pacific
- 5.5.4. Latin America
- 5.5.5. Middle East and Africa
- 5.1. Market Analysis, Insights and Forecast - by Equipment Type
- 6. North America Wafer Processing Equipment Industry Analysis, Insights and Forecast, 2019-2031
- 6.1. Market Analysis, Insights and Forecast - by Equipment Type
- 6.1.1. Thinning Equipment
- 6.1.2. Dicing Equipment
- 6.1.2.1. Blade Dicing
- 6.1.2.2. Laser Ablation
- 6.1.2.3. Stealth Dicing
- 6.1.2.4. Plasma Dicing
- 6.2. Market Analysis, Insights and Forecast - by Application
- 6.2.1. Memory and Logic (TSV)
- 6.2.2. MEMS Devices
- 6.2.3. Power Devices
- 6.2.4. CMOS Image Sensors
- 6.2.5. RFID
- 6.3. Market Analysis, Insights and Forecast - by Wafer Thickness Trends
- 6.4. Market Analysis, Insights and Forecast - by Wafer Size
- 6.4.1. Less than 4 inch
- 6.4.2. 5 inch and 6 inch
- 6.4.3. 8 inch
- 6.4.4. 12 inch
- 6.1. Market Analysis, Insights and Forecast - by Equipment Type
- 7. Europe Wafer Processing Equipment Industry Analysis, Insights and Forecast, 2019-2031
- 7.1. Market Analysis, Insights and Forecast - by Equipment Type
- 7.1.1. Thinning Equipment
- 7.1.2. Dicing Equipment
- 7.1.2.1. Blade Dicing
- 7.1.2.2. Laser Ablation
- 7.1.2.3. Stealth Dicing
- 7.1.2.4. Plasma Dicing
- 7.2. Market Analysis, Insights and Forecast - by Application
- 7.2.1. Memory and Logic (TSV)
- 7.2.2. MEMS Devices
- 7.2.3. Power Devices
- 7.2.4. CMOS Image Sensors
- 7.2.5. RFID
- 7.3. Market Analysis, Insights and Forecast - by Wafer Thickness Trends
- 7.4. Market Analysis, Insights and Forecast - by Wafer Size
- 7.4.1. Less than 4 inch
- 7.4.2. 5 inch and 6 inch
- 7.4.3. 8 inch
- 7.4.4. 12 inch
- 7.1. Market Analysis, Insights and Forecast - by Equipment Type
- 8. Asia Pacific Wafer Processing Equipment Industry Analysis, Insights and Forecast, 2019-2031
- 8.1. Market Analysis, Insights and Forecast - by Equipment Type
- 8.1.1. Thinning Equipment
- 8.1.2. Dicing Equipment
- 8.1.2.1. Blade Dicing
- 8.1.2.2. Laser Ablation
- 8.1.2.3. Stealth Dicing
- 8.1.2.4. Plasma Dicing
- 8.2. Market Analysis, Insights and Forecast - by Application
- 8.2.1. Memory and Logic (TSV)
- 8.2.2. MEMS Devices
- 8.2.3. Power Devices
- 8.2.4. CMOS Image Sensors
- 8.2.5. RFID
- 8.3. Market Analysis, Insights and Forecast - by Wafer Thickness Trends
- 8.4. Market Analysis, Insights and Forecast - by Wafer Size
- 8.4.1. Less than 4 inch
- 8.4.2. 5 inch and 6 inch
- 8.4.3. 8 inch
- 8.4.4. 12 inch
- 8.1. Market Analysis, Insights and Forecast - by Equipment Type
- 9. Latin America Wafer Processing Equipment Industry Analysis, Insights and Forecast, 2019-2031
- 9.1. Market Analysis, Insights and Forecast - by Equipment Type
- 9.1.1. Thinning Equipment
- 9.1.2. Dicing Equipment
- 9.1.2.1. Blade Dicing
- 9.1.2.2. Laser Ablation
- 9.1.2.3. Stealth Dicing
- 9.1.2.4. Plasma Dicing
- 9.2. Market Analysis, Insights and Forecast - by Application
- 9.2.1. Memory and Logic (TSV)
- 9.2.2. MEMS Devices
- 9.2.3. Power Devices
- 9.2.4. CMOS Image Sensors
- 9.2.5. RFID
- 9.3. Market Analysis, Insights and Forecast - by Wafer Thickness Trends
- 9.4. Market Analysis, Insights and Forecast - by Wafer Size
- 9.4.1. Less than 4 inch
- 9.4.2. 5 inch and 6 inch
- 9.4.3. 8 inch
- 9.4.4. 12 inch
- 9.1. Market Analysis, Insights and Forecast - by Equipment Type
- 10. Middle East and Africa Wafer Processing Equipment Industry Analysis, Insights and Forecast, 2019-2031
- 10.1. Market Analysis, Insights and Forecast - by Equipment Type
- 10.1.1. Thinning Equipment
- 10.1.2. Dicing Equipment
- 10.1.2.1. Blade Dicing
- 10.1.2.2. Laser Ablation
- 10.1.2.3. Stealth Dicing
- 10.1.2.4. Plasma Dicing
- 10.2. Market Analysis, Insights and Forecast - by Application
- 10.2.1. Memory and Logic (TSV)
- 10.2.2. MEMS Devices
- 10.2.3. Power Devices
- 10.2.4. CMOS Image Sensors
- 10.2.5. RFID
- 10.3. Market Analysis, Insights and Forecast - by Wafer Thickness Trends
- 10.4. Market Analysis, Insights and Forecast - by Wafer Size
- 10.4.1. Less than 4 inch
- 10.4.2. 5 inch and 6 inch
- 10.4.3. 8 inch
- 10.4.4. 12 inch
- 10.1. Market Analysis, Insights and Forecast - by Equipment Type
- 11. North America Wafer Processing Equipment Industry Analysis, Insights and Forecast, 2019-2031
- 11.1. Market Analysis, Insights and Forecast - By Country/Sub-region
- 11.1.1 United States
- 11.1.2 Canada
- 12. Europe Wafer Processing Equipment Industry Analysis, Insights and Forecast, 2019-2031
- 12.1. Market Analysis, Insights and Forecast - By Country/Sub-region
- 12.1.1 United Kingdom
- 12.1.2 Germany
- 12.1.3 France
- 12.1.4 Spain
- 12.1.5 Italy
- 12.1.6 Rest of Europe
- 13. Asia Pacific Wafer Processing Equipment Industry Analysis, Insights and Forecast, 2019-2031
- 13.1. Market Analysis, Insights and Forecast - By Country/Sub-region
- 13.1.1 China
- 13.1.2 Japan
- 13.1.3 Australia
- 13.1.4 India
- 13.1.5 Rest of Asia Pacific
- 14. Latin America Wafer Processing Equipment Industry Analysis, Insights and Forecast, 2019-2031
- 14.1. Market Analysis, Insights and Forecast - By Country/Sub-region
- 14.1.1 Mexico
- 14.1.2 Brazil
- 14.1.3 Rest of Latin America
- 15. Middle East and Africa Wafer Processing Equipment Industry Analysis, Insights and Forecast, 2019-2031
- 15.1. Market Analysis, Insights and Forecast - By Country/Sub-region
- 15.1.1 South Africa
- 15.1.2 Saudi Arabia
- 15.1.3 Rest of Middle East and Africa
- 16. Competitive Analysis
- 16.1. Global Market Share Analysis 2024
- 16.2. Company Profiles
- 16.2.1 Disco Corporation
- 16.2.1.1. Overview
- 16.2.1.2. Products
- 16.2.1.3. SWOT Analysis
- 16.2.1.4. Recent Developments
- 16.2.1.5. Financials (Based on Availability)
- 16.2.2 Suzhou Delphi Laser Co Ltd
- 16.2.2.1. Overview
- 16.2.2.2. Products
- 16.2.2.3. SWOT Analysis
- 16.2.2.4. Recent Developments
- 16.2.2.5. Financials (Based on Availability)
- 16.2.3 Plasma-Therm LLC
- 16.2.3.1. Overview
- 16.2.3.2. Products
- 16.2.3.3. SWOT Analysis
- 16.2.3.4. Recent Developments
- 16.2.3.5. Financials (Based on Availability)
- 16.2.4 Panasonic Corporation*List Not Exhaustive
- 16.2.4.1. Overview
- 16.2.4.2. Products
- 16.2.4.3. SWOT Analysis
- 16.2.4.4. Recent Developments
- 16.2.4.5. Financials (Based on Availability)
- 16.2.5 SPTS Technologies Limited
- 16.2.5.1. Overview
- 16.2.5.2. Products
- 16.2.5.3. SWOT Analysis
- 16.2.5.4. Recent Developments
- 16.2.5.5. Financials (Based on Availability)
- 16.2.6 ASM Laser Separation International (ALSI) B V
- 16.2.6.1. Overview
- 16.2.6.2. Products
- 16.2.6.3. SWOT Analysis
- 16.2.6.4. Recent Developments
- 16.2.6.5. Financials (Based on Availability)
- 16.2.7 Tokyo Seimitsu Co Ltd (Accretech)
- 16.2.7.1. Overview
- 16.2.7.2. Products
- 16.2.7.3. SWOT Analysis
- 16.2.7.4. Recent Developments
- 16.2.7.5. Financials (Based on Availability)
- 16.2.8 Advanced Dicing Technologies Ltd
- 16.2.8.1. Overview
- 16.2.8.2. Products
- 16.2.8.3. SWOT Analysis
- 16.2.8.4. Recent Developments
- 16.2.8.5. Financials (Based on Availability)
- 16.2.9 Neon Tech Co Ltd
- 16.2.9.1. Overview
- 16.2.9.2. Products
- 16.2.9.3. SWOT Analysis
- 16.2.9.4. Recent Developments
- 16.2.9.5. Financials (Based on Availability)
- 16.2.10 Han's Laser Technology Industry Group Co Ltd
- 16.2.10.1. Overview
- 16.2.10.2. Products
- 16.2.10.3. SWOT Analysis
- 16.2.10.4. Recent Developments
- 16.2.10.5. Financials (Based on Availability)
- 16.2.1 Disco Corporation
List of Figures
- Figure 1: Global Wafer Processing Equipment Industry Revenue Breakdown (Million, %) by Region 2024 & 2032
- Figure 2: North America Wafer Processing Equipment Industry Revenue (Million), by Country 2024 & 2032
- Figure 3: North America Wafer Processing Equipment Industry Revenue Share (%), by Country 2024 & 2032
- Figure 4: Europe Wafer Processing Equipment Industry Revenue (Million), by Country 2024 & 2032
- Figure 5: Europe Wafer Processing Equipment Industry Revenue Share (%), by Country 2024 & 2032
- Figure 6: Asia Pacific Wafer Processing Equipment Industry Revenue (Million), by Country 2024 & 2032
- Figure 7: Asia Pacific Wafer Processing Equipment Industry Revenue Share (%), by Country 2024 & 2032
- Figure 8: Latin America Wafer Processing Equipment Industry Revenue (Million), by Country 2024 & 2032
- Figure 9: Latin America Wafer Processing Equipment Industry Revenue Share (%), by Country 2024 & 2032
- Figure 10: Middle East and Africa Wafer Processing Equipment Industry Revenue (Million), by Country 2024 & 2032
- Figure 11: Middle East and Africa Wafer Processing Equipment Industry Revenue Share (%), by Country 2024 & 2032
- Figure 12: North America Wafer Processing Equipment Industry Revenue (Million), by Equipment Type 2024 & 2032
- Figure 13: North America Wafer Processing Equipment Industry Revenue Share (%), by Equipment Type 2024 & 2032
- Figure 14: North America Wafer Processing Equipment Industry Revenue (Million), by Application 2024 & 2032
- Figure 15: North America Wafer Processing Equipment Industry Revenue Share (%), by Application 2024 & 2032
- Figure 16: North America Wafer Processing Equipment Industry Revenue (Million), by Wafer Thickness Trends 2024 & 2032
- Figure 17: North America Wafer Processing Equipment Industry Revenue Share (%), by Wafer Thickness Trends 2024 & 2032
- Figure 18: North America Wafer Processing Equipment Industry Revenue (Million), by Wafer Size 2024 & 2032
- Figure 19: North America Wafer Processing Equipment Industry Revenue Share (%), by Wafer Size 2024 & 2032
- Figure 20: North America Wafer Processing Equipment Industry Revenue (Million), by Country 2024 & 2032
- Figure 21: North America Wafer Processing Equipment Industry Revenue Share (%), by Country 2024 & 2032
- Figure 22: Europe Wafer Processing Equipment Industry Revenue (Million), by Equipment Type 2024 & 2032
- Figure 23: Europe Wafer Processing Equipment Industry Revenue Share (%), by Equipment Type 2024 & 2032
- Figure 24: Europe Wafer Processing Equipment Industry Revenue (Million), by Application 2024 & 2032
- Figure 25: Europe Wafer Processing Equipment Industry Revenue Share (%), by Application 2024 & 2032
- Figure 26: Europe Wafer Processing Equipment Industry Revenue (Million), by Wafer Thickness Trends 2024 & 2032
- Figure 27: Europe Wafer Processing Equipment Industry Revenue Share (%), by Wafer Thickness Trends 2024 & 2032
- Figure 28: Europe Wafer Processing Equipment Industry Revenue (Million), by Wafer Size 2024 & 2032
- Figure 29: Europe Wafer Processing Equipment Industry Revenue Share (%), by Wafer Size 2024 & 2032
- Figure 30: Europe Wafer Processing Equipment Industry Revenue (Million), by Country 2024 & 2032
- Figure 31: Europe Wafer Processing Equipment Industry Revenue Share (%), by Country 2024 & 2032
- Figure 32: Asia Pacific Wafer Processing Equipment Industry Revenue (Million), by Equipment Type 2024 & 2032
- Figure 33: Asia Pacific Wafer Processing Equipment Industry Revenue Share (%), by Equipment Type 2024 & 2032
- Figure 34: Asia Pacific Wafer Processing Equipment Industry Revenue (Million), by Application 2024 & 2032
- Figure 35: Asia Pacific Wafer Processing Equipment Industry Revenue Share (%), by Application 2024 & 2032
- Figure 36: Asia Pacific Wafer Processing Equipment Industry Revenue (Million), by Wafer Thickness Trends 2024 & 2032
- Figure 37: Asia Pacific Wafer Processing Equipment Industry Revenue Share (%), by Wafer Thickness Trends 2024 & 2032
- Figure 38: Asia Pacific Wafer Processing Equipment Industry Revenue (Million), by Wafer Size 2024 & 2032
- Figure 39: Asia Pacific Wafer Processing Equipment Industry Revenue Share (%), by Wafer Size 2024 & 2032
- Figure 40: Asia Pacific Wafer Processing Equipment Industry Revenue (Million), by Country 2024 & 2032
- Figure 41: Asia Pacific Wafer Processing Equipment Industry Revenue Share (%), by Country 2024 & 2032
- Figure 42: Latin America Wafer Processing Equipment Industry Revenue (Million), by Equipment Type 2024 & 2032
- Figure 43: Latin America Wafer Processing Equipment Industry Revenue Share (%), by Equipment Type 2024 & 2032
- Figure 44: Latin America Wafer Processing Equipment Industry Revenue (Million), by Application 2024 & 2032
- Figure 45: Latin America Wafer Processing Equipment Industry Revenue Share (%), by Application 2024 & 2032
- Figure 46: Latin America Wafer Processing Equipment Industry Revenue (Million), by Wafer Thickness Trends 2024 & 2032
- Figure 47: Latin America Wafer Processing Equipment Industry Revenue Share (%), by Wafer Thickness Trends 2024 & 2032
- Figure 48: Latin America Wafer Processing Equipment Industry Revenue (Million), by Wafer Size 2024 & 2032
- Figure 49: Latin America Wafer Processing Equipment Industry Revenue Share (%), by Wafer Size 2024 & 2032
- Figure 50: Latin America Wafer Processing Equipment Industry Revenue (Million), by Country 2024 & 2032
- Figure 51: Latin America Wafer Processing Equipment Industry Revenue Share (%), by Country 2024 & 2032
- Figure 52: Middle East and Africa Wafer Processing Equipment Industry Revenue (Million), by Equipment Type 2024 & 2032
- Figure 53: Middle East and Africa Wafer Processing Equipment Industry Revenue Share (%), by Equipment Type 2024 & 2032
- Figure 54: Middle East and Africa Wafer Processing Equipment Industry Revenue (Million), by Application 2024 & 2032
- Figure 55: Middle East and Africa Wafer Processing Equipment Industry Revenue Share (%), by Application 2024 & 2032
- Figure 56: Middle East and Africa Wafer Processing Equipment Industry Revenue (Million), by Wafer Thickness Trends 2024 & 2032
- Figure 57: Middle East and Africa Wafer Processing Equipment Industry Revenue Share (%), by Wafer Thickness Trends 2024 & 2032
- Figure 58: Middle East and Africa Wafer Processing Equipment Industry Revenue (Million), by Wafer Size 2024 & 2032
- Figure 59: Middle East and Africa Wafer Processing Equipment Industry Revenue Share (%), by Wafer Size 2024 & 2032
- Figure 60: Middle East and Africa Wafer Processing Equipment Industry Revenue (Million), by Country 2024 & 2032
- Figure 61: Middle East and Africa Wafer Processing Equipment Industry Revenue Share (%), by Country 2024 & 2032
List of Tables
- Table 1: Global Wafer Processing Equipment Industry Revenue Million Forecast, by Region 2019 & 2032
- Table 2: Global Wafer Processing Equipment Industry Revenue Million Forecast, by Equipment Type 2019 & 2032
- Table 3: Global Wafer Processing Equipment Industry Revenue Million Forecast, by Application 2019 & 2032
- Table 4: Global Wafer Processing Equipment Industry Revenue Million Forecast, by Wafer Thickness Trends 2019 & 2032
- Table 5: Global Wafer Processing Equipment Industry Revenue Million Forecast, by Wafer Size 2019 & 2032
- Table 6: Global Wafer Processing Equipment Industry Revenue Million Forecast, by Region 2019 & 2032
- Table 7: Global Wafer Processing Equipment Industry Revenue Million Forecast, by Country 2019 & 2032
- Table 8: United States Wafer Processing Equipment Industry Revenue (Million) Forecast, by Application 2019 & 2032
- Table 9: Canada Wafer Processing Equipment Industry Revenue (Million) Forecast, by Application 2019 & 2032
- Table 10: Global Wafer Processing Equipment Industry Revenue Million Forecast, by Country 2019 & 2032
- Table 11: United Kingdom Wafer Processing Equipment Industry Revenue (Million) Forecast, by Application 2019 & 2032
- Table 12: Germany Wafer Processing Equipment Industry Revenue (Million) Forecast, by Application 2019 & 2032
- Table 13: France Wafer Processing Equipment Industry Revenue (Million) Forecast, by Application 2019 & 2032
- Table 14: Spain Wafer Processing Equipment Industry Revenue (Million) Forecast, by Application 2019 & 2032
- Table 15: Italy Wafer Processing Equipment Industry Revenue (Million) Forecast, by Application 2019 & 2032
- Table 16: Rest of Europe Wafer Processing Equipment Industry Revenue (Million) Forecast, by Application 2019 & 2032
- Table 17: Global Wafer Processing Equipment Industry Revenue Million Forecast, by Country 2019 & 2032
- Table 18: China Wafer Processing Equipment Industry Revenue (Million) Forecast, by Application 2019 & 2032
- Table 19: Japan Wafer Processing Equipment Industry Revenue (Million) Forecast, by Application 2019 & 2032
- Table 20: Australia Wafer Processing Equipment Industry Revenue (Million) Forecast, by Application 2019 & 2032
- Table 21: India Wafer Processing Equipment Industry Revenue (Million) Forecast, by Application 2019 & 2032
- Table 22: Rest of Asia Pacific Wafer Processing Equipment Industry Revenue (Million) Forecast, by Application 2019 & 2032
- Table 23: Global Wafer Processing Equipment Industry Revenue Million Forecast, by Country 2019 & 2032
- Table 24: Mexico Wafer Processing Equipment Industry Revenue (Million) Forecast, by Application 2019 & 2032
- Table 25: Brazil Wafer Processing Equipment Industry Revenue (Million) Forecast, by Application 2019 & 2032
- Table 26: Rest of Latin America Wafer Processing Equipment Industry Revenue (Million) Forecast, by Application 2019 & 2032
- Table 27: Global Wafer Processing Equipment Industry Revenue Million Forecast, by Country 2019 & 2032
- Table 28: South Africa Wafer Processing Equipment Industry Revenue (Million) Forecast, by Application 2019 & 2032
- Table 29: Saudi Arabia Wafer Processing Equipment Industry Revenue (Million) Forecast, by Application 2019 & 2032
- Table 30: Rest of Middle East and Africa Wafer Processing Equipment Industry Revenue (Million) Forecast, by Application 2019 & 2032
- Table 31: Global Wafer Processing Equipment Industry Revenue Million Forecast, by Equipment Type 2019 & 2032
- Table 32: Global Wafer Processing Equipment Industry Revenue Million Forecast, by Application 2019 & 2032
- Table 33: Global Wafer Processing Equipment Industry Revenue Million Forecast, by Wafer Thickness Trends 2019 & 2032
- Table 34: Global Wafer Processing Equipment Industry Revenue Million Forecast, by Wafer Size 2019 & 2032
- Table 35: Global Wafer Processing Equipment Industry Revenue Million Forecast, by Country 2019 & 2032
- Table 36: United States Wafer Processing Equipment Industry Revenue (Million) Forecast, by Application 2019 & 2032
- Table 37: Canada Wafer Processing Equipment Industry Revenue (Million) Forecast, by Application 2019 & 2032
- Table 38: Global Wafer Processing Equipment Industry Revenue Million Forecast, by Equipment Type 2019 & 2032
- Table 39: Global Wafer Processing Equipment Industry Revenue Million Forecast, by Application 2019 & 2032
- Table 40: Global Wafer Processing Equipment Industry Revenue Million Forecast, by Wafer Thickness Trends 2019 & 2032
- Table 41: Global Wafer Processing Equipment Industry Revenue Million Forecast, by Wafer Size 2019 & 2032
- Table 42: Global Wafer Processing Equipment Industry Revenue Million Forecast, by Country 2019 & 2032
- Table 43: United Kingdom Wafer Processing Equipment Industry Revenue (Million) Forecast, by Application 2019 & 2032
- Table 44: Germany Wafer Processing Equipment Industry Revenue (Million) Forecast, by Application 2019 & 2032
- Table 45: France Wafer Processing Equipment Industry Revenue (Million) Forecast, by Application 2019 & 2032
- Table 46: Spain Wafer Processing Equipment Industry Revenue (Million) Forecast, by Application 2019 & 2032
- Table 47: Italy Wafer Processing Equipment Industry Revenue (Million) Forecast, by Application 2019 & 2032
- Table 48: Rest of Europe Wafer Processing Equipment Industry Revenue (Million) Forecast, by Application 2019 & 2032
- Table 49: Global Wafer Processing Equipment Industry Revenue Million Forecast, by Equipment Type 2019 & 2032
- Table 50: Global Wafer Processing Equipment Industry Revenue Million Forecast, by Application 2019 & 2032
- Table 51: Global Wafer Processing Equipment Industry Revenue Million Forecast, by Wafer Thickness Trends 2019 & 2032
- Table 52: Global Wafer Processing Equipment Industry Revenue Million Forecast, by Wafer Size 2019 & 2032
- Table 53: Global Wafer Processing Equipment Industry Revenue Million Forecast, by Country 2019 & 2032
- Table 54: China Wafer Processing Equipment Industry Revenue (Million) Forecast, by Application 2019 & 2032
- Table 55: Japan Wafer Processing Equipment Industry Revenue (Million) Forecast, by Application 2019 & 2032
- Table 56: Australia Wafer Processing Equipment Industry Revenue (Million) Forecast, by Application 2019 & 2032
- Table 57: India Wafer Processing Equipment Industry Revenue (Million) Forecast, by Application 2019 & 2032
- Table 58: Rest of Asia Pacific Wafer Processing Equipment Industry Revenue (Million) Forecast, by Application 2019 & 2032
- Table 59: Global Wafer Processing Equipment Industry Revenue Million Forecast, by Equipment Type 2019 & 2032
- Table 60: Global Wafer Processing Equipment Industry Revenue Million Forecast, by Application 2019 & 2032
- Table 61: Global Wafer Processing Equipment Industry Revenue Million Forecast, by Wafer Thickness Trends 2019 & 2032
- Table 62: Global Wafer Processing Equipment Industry Revenue Million Forecast, by Wafer Size 2019 & 2032
- Table 63: Global Wafer Processing Equipment Industry Revenue Million Forecast, by Country 2019 & 2032
- Table 64: Mexico Wafer Processing Equipment Industry Revenue (Million) Forecast, by Application 2019 & 2032
- Table 65: Brazil Wafer Processing Equipment Industry Revenue (Million) Forecast, by Application 2019 & 2032
- Table 66: Rest of Latin America Wafer Processing Equipment Industry Revenue (Million) Forecast, by Application 2019 & 2032
- Table 67: Global Wafer Processing Equipment Industry Revenue Million Forecast, by Equipment Type 2019 & 2032
- Table 68: Global Wafer Processing Equipment Industry Revenue Million Forecast, by Application 2019 & 2032
- Table 69: Global Wafer Processing Equipment Industry Revenue Million Forecast, by Wafer Thickness Trends 2019 & 2032
- Table 70: Global Wafer Processing Equipment Industry Revenue Million Forecast, by Wafer Size 2019 & 2032
- Table 71: Global Wafer Processing Equipment Industry Revenue Million Forecast, by Country 2019 & 2032
- Table 72: South Africa Wafer Processing Equipment Industry Revenue (Million) Forecast, by Application 2019 & 2032
- Table 73: Saudi Arabia Wafer Processing Equipment Industry Revenue (Million) Forecast, by Application 2019 & 2032
- Table 74: Rest of Middle East and Africa Wafer Processing Equipment Industry Revenue (Million) Forecast, by Application 2019 & 2032
Frequently Asked Questions
1. What is the projected Compound Annual Growth Rate (CAGR) of the Wafer Processing Equipment Industry?
The projected CAGR is approximately 6.35%.
2. Which companies are prominent players in the Wafer Processing Equipment Industry?
Key companies in the market include Disco Corporation, Suzhou Delphi Laser Co Ltd, Plasma-Therm LLC, Panasonic Corporation*List Not Exhaustive, SPTS Technologies Limited, ASM Laser Separation International (ALSI) B V, Tokyo Seimitsu Co Ltd (Accretech), Advanced Dicing Technologies Ltd, Neon Tech Co Ltd, Han's Laser Technology Industry Group Co Ltd.
3. What are the main segments of the Wafer Processing Equipment Industry?
The market segments include Equipment Type, Application, Wafer Thickness Trends, Wafer Size.
4. Can you provide details about the market size?
The market size is estimated to be USD 728.39 Million as of 2022.
5. What are some drivers contributing to market growth?
Increasing Demand for Smart Cards. RFID Technology. and Automotive Power ICs; Increasing Need for Miniaturization of Semiconductors.
6. What are the notable trends driving market growth?
Increasing Need for Miniaturization of Semiconductors to Drive the Market.
7. Are there any restraints impacting market growth?
Manufacturing Challenges.
8. Can you provide examples of recent developments in the market?
March 2022 - DISCO Corporation has announced the acquisition of real estate in Higashikojiya, Ota-ku, Tokyo. This acquisition of real estate will help the company in its Research and Development growth by using it as an R&D center from April 2022. It will further help the company by supporting the high demand for the semiconductors market in the future.
9. What pricing options are available for accessing the report?
Pricing options include single-user, multi-user, and enterprise licenses priced at USD 4750, USD 5250, and USD 8750 respectively.
10. Is the market size provided in terms of value or volume?
The market size is provided in terms of value, measured in Million.
11. Are there any specific market keywords associated with the report?
Yes, the market keyword associated with the report is "Wafer Processing Equipment Industry," which aids in identifying and referencing the specific market segment covered.
12. How do I determine which pricing option suits my needs best?
The pricing options vary based on user requirements and access needs. Individual users may opt for single-user licenses, while businesses requiring broader access may choose multi-user or enterprise licenses for cost-effective access to the report.
13. Are there any additional resources or data provided in the Wafer Processing Equipment Industry report?
While the report offers comprehensive insights, it's advisable to review the specific contents or supplementary materials provided to ascertain if additional resources or data are available.
14. How can I stay updated on further developments or reports in the Wafer Processing Equipment Industry?
To stay informed about further developments, trends, and reports in the Wafer Processing Equipment Industry, consider subscribing to industry newsletters, following relevant companies and organizations, or regularly checking reputable industry news sources and publications.
Methodology
Step 1 - Identification of Relevant Samples Size from Population Database


Step 2 - Approaches for Defining Global Market Size (Value, Volume* & Price*)

Note*: In applicable scenarios
Step 3 - Data Sources
Primary Research
- Web Analytics
- Survey Reports
- Research Institute
- Latest Research Reports
- Opinion Leaders
Secondary Research
- Annual Reports
- White Paper
- Latest Press Release
- Industry Association
- Paid Database
- Investor Presentations

Step 4 - Data Triangulation
Involves using different sources of information in order to increase the validity of a study
These sources are likely to be stakeholders in a program - participants, other researchers, program staff, other community members, and so on.
Then we put all data in single framework & apply various statistical tools to find out the dynamic on the market.
During the analysis stage, feedback from the stakeholder groups would be compared to determine areas of agreement as well as areas of divergence


