Unlocking Insights for Refurbished Computers And Laptops Market Growth Strategies

Refurbished Computers And Laptops Market by Production Analysis, by Consumption Analysis, by Import Market Analysis (Value & Volume), by Export Market Analysis (Value & Volume), by Price Trend Analysis, by North America, by Europe, by Asia, by Australia and New Zealand, by Latin America, by Middle East and Africa Forecast 2025-2033

Jul 3 2025
Base Year: 2024

234 Pages
Main Logo

Unlocking Insights for Refurbished Computers And Laptops Market Growth Strategies


Home
Industries
Technology, Media and Telecom
sponsor image
sponsor image
sponsor image
sponsor image
sponsor image
sponsor image
sponsor image
sponsor image
sponsor image
sponsor image
sponsor image
sponsor image
sponsor image
sponsor image
sponsor image
sponsor image
sponsor image
sponsor image
sponsor image
sponsor image

Tailored for you

  • In-depth Analysis Tailored to Specified Regions or Segments
  • Company Profiles Customized to User Preferences
  • Comprehensive Insights Focused on Specific Segments or Regions
  • Customized Evaluation of Competitive Landscape to Meet Your Needs
  • Tailored Customization to Address Other Specific Requirements
Ask for customization


Key Insights

The refurbished computers and laptops market is experiencing robust growth, driven by increasing environmental consciousness, budget constraints among consumers, and the growing demand for affordable technology in emerging economies. A compound annual growth rate (CAGR) of 10.24% from 2019 to 2024 suggests a significant market expansion. This growth is fueled by several key factors. Firstly, the rising awareness of e-waste and the environmental impact of discarding perfectly functional electronics is pushing consumers towards more sustainable options. Secondly, the economic downturn has led many individuals and businesses to seek cost-effective alternatives to new devices, making refurbished options increasingly attractive. Thirdly, the increasing penetration of technology in developing countries creates a large market for affordable, yet reliable, computing solutions. Segment-wise, the consumer electronics segment is expected to dominate, followed by the food and beverage industry (for POS systems), and the business and education sectors which are increasingly adopting refurbished equipment to reduce IT expenses.

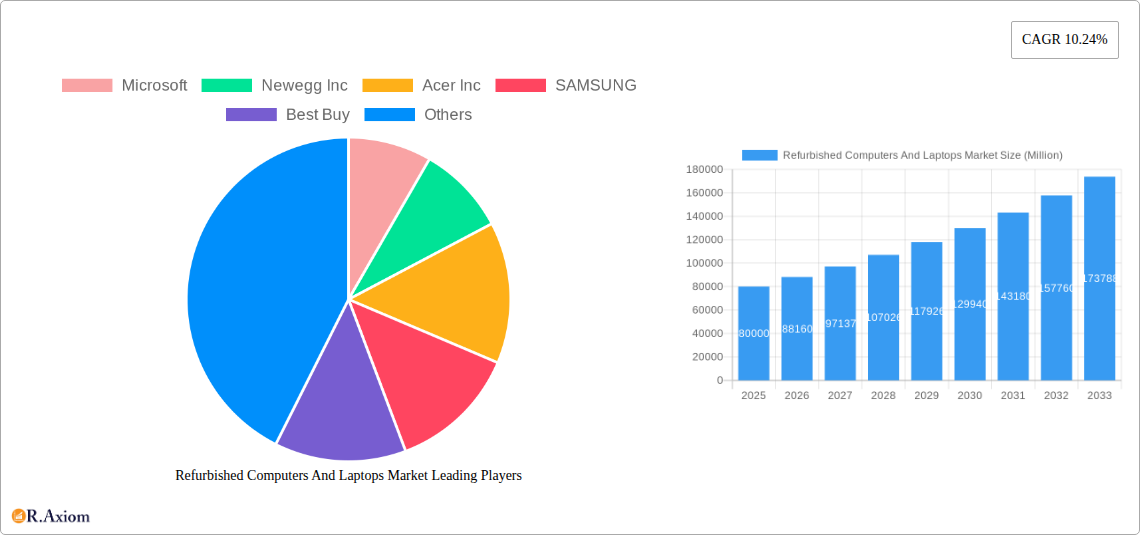
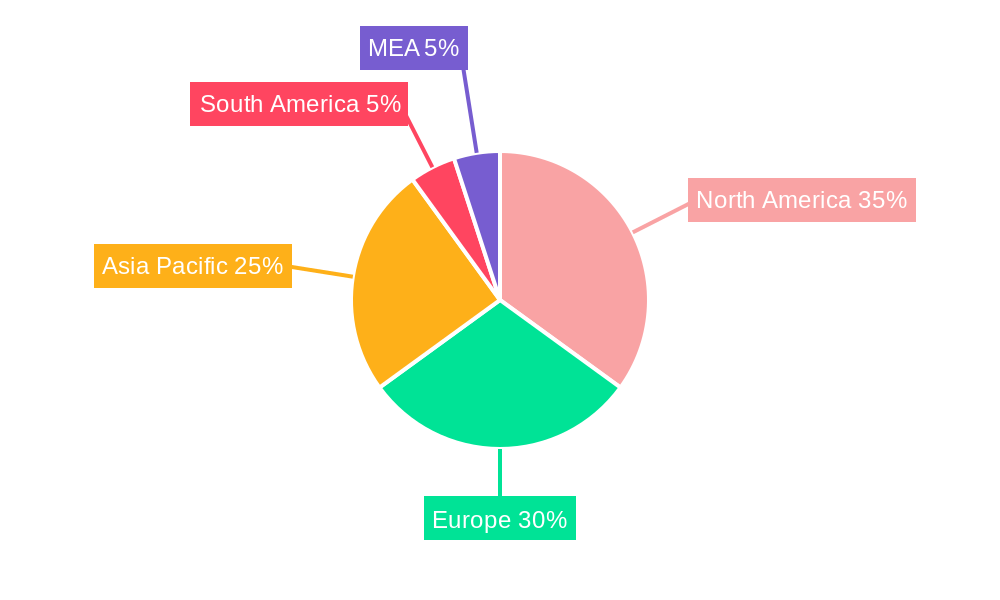
The market is segmented geographically, with North America and Europe currently holding significant shares. However, rapid growth is expected in Asia-Pacific regions like India and Southeast Asia due to the expanding middle class and increasing internet penetration. Competition in this market is fierce, with major players like Microsoft, Dell, Lenovo, and Apple, alongside specialized refurbished retailers such as Newegg and Best Buy, vying for market share. Despite the growth, the market faces challenges. Concerns about product quality and warranty issues can deter potential buyers, while the fluctuating prices of used components can impact profitability. To overcome these obstacles, companies are focusing on stringent quality checks, extended warranties, and transparent pricing strategies to build consumer confidence and enhance market growth. We estimate the market size to be approximately $80 billion in 2025, with a projected increase in the forecast period (2025-2033) based on the given CAGR. The ongoing technological advancements will continue to shape the demand for both refurbished and new devices, resulting in an evolving competitive landscape.

Refurbished Computers And Laptops Market Research Report - Market Size, Growth & Forecast

Refurbished Computers and Laptops Market: A Comprehensive Report (2019-2033)

This comprehensive report provides a detailed analysis of the refurbished computers and laptops market, covering the period from 2019 to 2033. It offers invaluable insights for industry stakeholders, including manufacturers, retailers, investors, and researchers, seeking to understand the market dynamics, growth opportunities, and competitive landscape. The report leverages extensive market research and data analysis to provide actionable strategies for success in this rapidly evolving sector.

Refurbished Computers And Laptops Market Market Concentration & Innovation

The refurbished computers and laptops market exhibits a moderately concentrated structure, with a few major players holding significant market share. However, the market is also characterized by a large number of smaller players, particularly in the online retail segment. Key players such as Microsoft, Newegg Inc, Acer Inc, SAMSUNG, Best Buy, HP Development Company L P, Dell Inc, Budli Internet Private Limited, Amazon Renewed, Lenovo Group Ltd, and Apple Inc compete on factors like pricing, product quality, warranty offerings, and brand reputation.

Innovation in the refurbished market primarily focuses on extending product lifecycles through improved refurbishment processes, enhanced quality control, and the incorporation of upgraded components. Sustainability concerns are driving the demand for refurbished devices, leading to increased investment in responsible recycling and refurbishment practices. Regulatory frameworks regarding e-waste management are increasingly influencing market operations. The rise of subscription services for refurbished devices presents a new avenue for market growth.

Mergers and acquisitions (M&A) activity within the refurbished market is moderate. While large-scale acquisitions are less frequent, smaller players are consolidating to expand their reach and enhance their product offerings. The average M&A deal value in the past five years was approximately xx Million, with a noticeable increase in activity over the last two years. The market share of the top five players is approximately 60%, indicating a competitive yet consolidated market structure. This leaves room for smaller players to niche themselves based on specialization (e.g., specific device types or target audiences).

Refurbished Computers And Laptops Market Industry Trends & Insights

The refurbished computers and laptops market is experiencing robust growth, driven by a confluence of factors. The increasing affordability of refurbished devices compared to their new counterparts is a major driver, making them attractive to budget-conscious consumers and businesses. The growing awareness of the environmental impact of electronic waste is also fostering demand for sustainable alternatives like refurbished products. Furthermore, technological advancements in refurbishment techniques have significantly improved the quality and performance of refurbished devices, eroding the perception of lower quality often associated with these products.

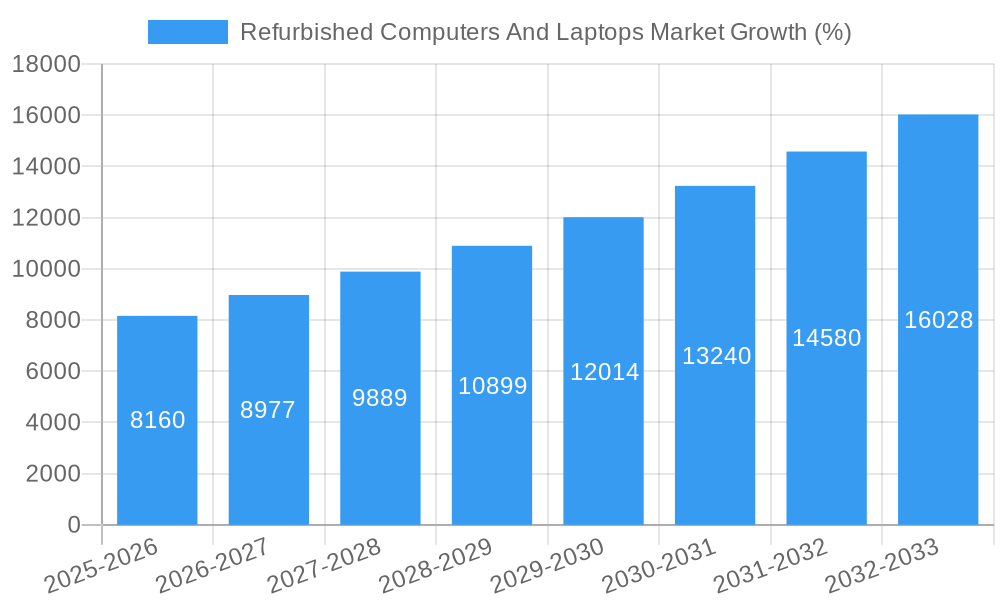
Consumer preferences are shifting towards greater value for money, especially in times of economic uncertainty. This trend strongly favors the refurbished market. Technological disruptions, such as advancements in battery technology and component miniaturization, have facilitated more efficient refurbishment processes. The market is witnessing a surge in demand for specific applications such as education and remote work. The competitive dynamics are influenced by pricing strategies, brand loyalty, and the availability of warranties and after-sales services. The Compound Annual Growth Rate (CAGR) for the refurbished computer and laptop market is projected to be xx% during the forecast period (2025-2033), with market penetration increasing from xx% in 2025 to xx% in 2033.

Refurbished Computers And Laptops Market Growth

Dominant Markets & Segments in Refurbished Computers And Laptops Market

The Consumer Electronics segment currently dominates the refurbished computers and laptops market, accounting for approximately xx Million in revenue in 2025. This dominance is driven by several factors:

  • High Demand: The consumer electronics sector consistently demonstrates high demand for computing devices, fueling a significant market for refurbished options.
  • Technological Advancements: Rapid technological advancements in consumer electronics lead to quicker product cycles, resulting in a larger volume of used devices available for refurbishment.
  • Price Sensitivity: Consumers in the consumer electronics market are generally more price-sensitive, making refurbished products particularly appealing.

Other significant segments include:

  • Other Applications: This segment is experiencing considerable growth fueled by increased demand in diverse sectors such as education, healthcare, and small businesses.
  • Fashion and Apparel: Though a smaller segment, refurbished laptops are increasingly used for design, inventory management, and e-commerce operations.

The North American region currently holds the largest market share, followed by Europe and Asia. Key drivers in these regions include robust e-commerce infrastructure, consumer awareness of sustainability, and favorable regulatory environments.

Refurbished Computers And Laptops Market Product Developments

Recent product innovations focus on extending the lifespan of refurbished devices through the implementation of advanced diagnostics, repair, and component upgrades. Improvements in battery technology and data security measures are enhancing the appeal of refurbished products. This has led to the emergence of specialized refurbished devices tailored to specific applications, including educational settings and corporate environments.

Report Scope & Segmentation Analysis

This report segments the refurbished computers and laptops market based on application: Food, Beverage, Soft Drinks and Other Beverages; Consumer Electronics; Fashion and Apparel; Beauty and Personal Care; Furniture and Home; and Other Applications. Each segment's growth is analyzed individually, considering factors like market size, competitive dynamics, and future growth projections. For example, the Consumer Electronics segment is projected to maintain its market leadership, driven by consistently high demand and increasing consumer acceptance of refurbished products. Conversely, other segments, such as Furniture and Home, show slower growth but offer niche opportunities.

Key Drivers of Refurbished Computers And Laptops Market Growth

Several key factors are driving the growth of the refurbished computers and laptops market:

  • Cost Savings: Refurbished devices offer significant cost savings compared to new ones, making them accessible to a broader consumer base.
  • Environmental Sustainability: Growing environmental awareness encourages consumers and businesses to adopt more sustainable practices, such as purchasing refurbished electronics.
  • Technological Advancements: Improvements in refurbishment techniques have enhanced the quality and reliability of refurbished devices.
  • Government Initiatives: Government policies and regulations promoting e-waste recycling and responsible disposal indirectly support the refurbished market.

Challenges in the Refurbished Computers And Laptops Market Sector

Despite strong growth prospects, the refurbished computers and laptops market faces challenges:

  • Quality Concerns: Maintaining consistent quality across refurbished devices is crucial to consumer trust.
  • Supply Chain Issues: Securing a reliable supply of used devices for refurbishment can be challenging.
  • Data Security: Ensuring data security on refurbished devices is a critical concern for consumers and businesses. Any perceived data breach significantly impacts consumer trust and adoption.

Emerging Opportunities in Refurbished Computers And Laptops Market

Several emerging opportunities exist in the refurbished computers and laptops market:

  • Subscription Models: Offering refurbished devices through subscription services can create recurring revenue streams.
  • Expansion into New Markets: Untapped markets, particularly in developing economies, present significant growth potential.
  • Specialized Refurbishment Services: Focusing on niche applications, such as education or healthcare, can create specialized market segments.

Leading Players in the Refurbished Computers And Laptops Market Market

  • Microsoft
  • Newegg Inc
  • Acer Inc
  • SAMSUNG
  • Best Buy
  • HP Development Company L P
  • Dell Inc
  • Budli Internet Private Limited
  • Amazon Renewed
  • Lenovo Group Ltd
  • Apple Inc

Key Developments in Refurbished Computers And Laptops Market Industry

  • May 2023: Li-Cycle Holdings Corp. and Shift2 donated 60 refurbished laptops to graduating seniors, highlighting the market's role in social responsibility and educational access.
  • June 2023: AT&T's initiative to provide free refurbished laptops to Vanderburgh County students and families demonstrates the market's contribution to bridging the digital divide.

Strategic Outlook for Refurbished Computers And Laptops Market Market

The refurbished computers and laptops market is poised for continued strong growth, driven by increasing demand, technological advancements, and a growing focus on sustainability. Expanding into new market segments, developing innovative business models, and addressing quality and data security concerns will be crucial for success. The market's future is bright, with considerable potential for both established players and new entrants.

Refurbished Computers And Laptops Market Segmentation

  • 1. Production Analysis
  • 2. Consumption Analysis
  • 3. Import Market Analysis (Value & Volume)
  • 4. Export Market Analysis (Value & Volume)
  • 5. Price Trend Analysis

Refurbished Computers And Laptops Market Segmentation By Geography

  • 1. North America
  • 2. Europe
  • 3. Asia
  • 4. Australia and New Zealand
  • 5. Latin America
  • 6. Middle East and Africa
Refurbished Computers And Laptops Market Regional Share


Refurbished Computers And Laptops Market REPORT HIGHLIGHTS

AspectsDetails
Study Period 2019-2033
Base Year 2024
Estimated Year 2025
Forecast Period2025-2033
Historical Period2019-2024
Growth RateCAGR of 10.24% from 2019-2033
Segmentation
    • By Production Analysis
    • By Consumption Analysis
    • By Import Market Analysis (Value & Volume)
    • By Export Market Analysis (Value & Volume)
    • By Price Trend Analysis
  • By Geography
    • North America
    • Europe
    • Asia
    • Australia and New Zealand
    • Latin America
    • Middle East and Africa


Table of Contents

  1. 1. Introduction
    • 1.1. Research Scope
    • 1.2. Market Segmentation
    • 1.3. Research Methodology
    • 1.4. Definitions and Assumptions
  2. 2. Executive Summary
    • 2.1. Introduction
  3. 3. Market Dynamics
    • 3.1. Introduction
      • 3.2. Market Drivers
        • 3.2.1. Cost Savings and Affordability of the Refurbished Devices; Growing awareness about E waste and Environmental Consciousness
      • 3.3. Market Restrains
        • 3.3.1. Lack of Awareness About Intellectual Property Outsourcing
      • 3.4. Market Trends
        • 3.4.1. Growing awareness about E waste and Environmental Consciousness
  4. 4. Market Factor Analysis
    • 4.1. Porters Five Forces
    • 4.2. Supply/Value Chain
    • 4.3. PESTEL analysis
    • 4.4. Market Entropy
    • 4.5. Patent/Trademark Analysis
  5. 5. Global Refurbished Computers And Laptops Market Analysis, Insights and Forecast, 2019-2031
    • 5.1. Market Analysis, Insights and Forecast - by Production Analysis
      • 5.2. Market Analysis, Insights and Forecast - by Consumption Analysis
        • 5.3. Market Analysis, Insights and Forecast - by Import Market Analysis (Value & Volume)
          • 5.4. Market Analysis, Insights and Forecast - by Export Market Analysis (Value & Volume)
            • 5.5. Market Analysis, Insights and Forecast - by Price Trend Analysis
              • 5.6. Market Analysis, Insights and Forecast - by Region
                • 5.6.1. North America
                • 5.6.2. Europe
                • 5.6.3. Asia
                • 5.6.4. Australia and New Zealand
                • 5.6.5. Latin America
                • 5.6.6. Middle East and Africa
            • 6. North America Refurbished Computers And Laptops Market Analysis, Insights and Forecast, 2019-2031
              • 6.1. Market Analysis, Insights and Forecast - by Production Analysis
                • 6.2. Market Analysis, Insights and Forecast - by Consumption Analysis
                  • 6.3. Market Analysis, Insights and Forecast - by Import Market Analysis (Value & Volume)
                    • 6.4. Market Analysis, Insights and Forecast - by Export Market Analysis (Value & Volume)
                      • 6.5. Market Analysis, Insights and Forecast - by Price Trend Analysis
                      • 7. Europe Refurbished Computers And Laptops Market Analysis, Insights and Forecast, 2019-2031
                        • 7.1. Market Analysis, Insights and Forecast - by Production Analysis
                          • 7.2. Market Analysis, Insights and Forecast - by Consumption Analysis
                            • 7.3. Market Analysis, Insights and Forecast - by Import Market Analysis (Value & Volume)
                              • 7.4. Market Analysis, Insights and Forecast - by Export Market Analysis (Value & Volume)
                                • 7.5. Market Analysis, Insights and Forecast - by Price Trend Analysis
                                • 8. Asia Refurbished Computers And Laptops Market Analysis, Insights and Forecast, 2019-2031
                                  • 8.1. Market Analysis, Insights and Forecast - by Production Analysis
                                    • 8.2. Market Analysis, Insights and Forecast - by Consumption Analysis
                                      • 8.3. Market Analysis, Insights and Forecast - by Import Market Analysis (Value & Volume)
                                        • 8.4. Market Analysis, Insights and Forecast - by Export Market Analysis (Value & Volume)
                                          • 8.5. Market Analysis, Insights and Forecast - by Price Trend Analysis
                                          • 9. Australia and New Zealand Refurbished Computers And Laptops Market Analysis, Insights and Forecast, 2019-2031
                                            • 9.1. Market Analysis, Insights and Forecast - by Production Analysis
                                              • 9.2. Market Analysis, Insights and Forecast - by Consumption Analysis
                                                • 9.3. Market Analysis, Insights and Forecast - by Import Market Analysis (Value & Volume)
                                                  • 9.4. Market Analysis, Insights and Forecast - by Export Market Analysis (Value & Volume)
                                                    • 9.5. Market Analysis, Insights and Forecast - by Price Trend Analysis
                                                    • 10. Latin America Refurbished Computers And Laptops Market Analysis, Insights and Forecast, 2019-2031
                                                      • 10.1. Market Analysis, Insights and Forecast - by Production Analysis
                                                        • 10.2. Market Analysis, Insights and Forecast - by Consumption Analysis
                                                          • 10.3. Market Analysis, Insights and Forecast - by Import Market Analysis (Value & Volume)
                                                            • 10.4. Market Analysis, Insights and Forecast - by Export Market Analysis (Value & Volume)
                                                              • 10.5. Market Analysis, Insights and Forecast - by Price Trend Analysis
                                                              • 11. Middle East and Africa Refurbished Computers And Laptops Market Analysis, Insights and Forecast, 2019-2031
                                                                • 11.1. Market Analysis, Insights and Forecast - by Production Analysis
                                                                  • 11.2. Market Analysis, Insights and Forecast - by Consumption Analysis
                                                                    • 11.3. Market Analysis, Insights and Forecast - by Import Market Analysis (Value & Volume)
                                                                      • 11.4. Market Analysis, Insights and Forecast - by Export Market Analysis (Value & Volume)
                                                                        • 11.5. Market Analysis, Insights and Forecast - by Price Trend Analysis
                                                                        • 12. North America Refurbished Computers And Laptops Market Analysis, Insights and Forecast, 2019-2031
                                                                            • 12.1. Market Analysis, Insights and Forecast - By Country/Sub-region
                                                                              • 12.1.1 United States
                                                                              • 12.1.2 Canada
                                                                              • 12.1.3 Mexico
                                                                        • 13. Europe Refurbished Computers And Laptops Market Analysis, Insights and Forecast, 2019-2031
                                                                            • 13.1. Market Analysis, Insights and Forecast - By Country/Sub-region
                                                                              • 13.1.1 Germany
                                                                              • 13.1.2 United Kingdom
                                                                              • 13.1.3 France
                                                                              • 13.1.4 Spain
                                                                              • 13.1.5 Italy
                                                                              • 13.1.6 Spain
                                                                              • 13.1.7 Belgium
                                                                              • 13.1.8 Netherland
                                                                              • 13.1.9 Nordics
                                                                              • 13.1.10 Rest of Europe
                                                                        • 14. Asia Pacific Refurbished Computers And Laptops Market Analysis, Insights and Forecast, 2019-2031
                                                                            • 14.1. Market Analysis, Insights and Forecast - By Country/Sub-region
                                                                              • 14.1.1 China
                                                                              • 14.1.2 Japan
                                                                              • 14.1.3 India
                                                                              • 14.1.4 South Korea
                                                                              • 14.1.5 Southeast Asia
                                                                              • 14.1.6 Australia
                                                                              • 14.1.7 Indonesia
                                                                              • 14.1.8 Phillipes
                                                                              • 14.1.9 Singapore
                                                                              • 14.1.10 Thailandc
                                                                              • 14.1.11 Rest of Asia Pacific
                                                                        • 15. South America Refurbished Computers And Laptops Market Analysis, Insights and Forecast, 2019-2031
                                                                            • 15.1. Market Analysis, Insights and Forecast - By Country/Sub-region
                                                                              • 15.1.1 Brazil
                                                                              • 15.1.2 Argentina
                                                                              • 15.1.3 Peru
                                                                              • 15.1.4 Chile
                                                                              • 15.1.5 Colombia
                                                                              • 15.1.6 Ecuador
                                                                              • 15.1.7 Venezuela
                                                                              • 15.1.8 Rest of South America
                                                                        • 16. MEA Refurbished Computers And Laptops Market Analysis, Insights and Forecast, 2019-2031
                                                                            • 16.1. Market Analysis, Insights and Forecast - By Country/Sub-region
                                                                              • 16.1.1 United Arab Emirates
                                                                              • 16.1.2 Saudi Arabia
                                                                              • 16.1.3 South Africa
                                                                              • 16.1.4 Rest of Middle East and Africa
                                                                        • 17. Competitive Analysis
                                                                          • 17.1. Global Market Share Analysis 2024
                                                                            • 17.2. Company Profiles
                                                                              • 17.2.1 Microsoft
                                                                                • 17.2.1.1. Overview
                                                                                • 17.2.1.2. Products
                                                                                • 17.2.1.3. SWOT Analysis
                                                                                • 17.2.1.4. Recent Developments
                                                                                • 17.2.1.5. Financials (Based on Availability)
                                                                              • 17.2.2 Newegg Inc
                                                                                • 17.2.2.1. Overview
                                                                                • 17.2.2.2. Products
                                                                                • 17.2.2.3. SWOT Analysis
                                                                                • 17.2.2.4. Recent Developments
                                                                                • 17.2.2.5. Financials (Based on Availability)
                                                                              • 17.2.3 Acer Inc
                                                                                • 17.2.3.1. Overview
                                                                                • 17.2.3.2. Products
                                                                                • 17.2.3.3. SWOT Analysis
                                                                                • 17.2.3.4. Recent Developments
                                                                                • 17.2.3.5. Financials (Based on Availability)
                                                                              • 17.2.4 SAMSUNG
                                                                                • 17.2.4.1. Overview
                                                                                • 17.2.4.2. Products
                                                                                • 17.2.4.3. SWOT Analysis
                                                                                • 17.2.4.4. Recent Developments
                                                                                • 17.2.4.5. Financials (Based on Availability)
                                                                              • 17.2.5 Best Buy
                                                                                • 17.2.5.1. Overview
                                                                                • 17.2.5.2. Products
                                                                                • 17.2.5.3. SWOT Analysis
                                                                                • 17.2.5.4. Recent Developments
                                                                                • 17.2.5.5. Financials (Based on Availability)
                                                                              • 17.2.6 HP Development Company L P
                                                                                • 17.2.6.1. Overview
                                                                                • 17.2.6.2. Products
                                                                                • 17.2.6.3. SWOT Analysis
                                                                                • 17.2.6.4. Recent Developments
                                                                                • 17.2.6.5. Financials (Based on Availability)
                                                                              • 17.2.7 Dell Inc
                                                                                • 17.2.7.1. Overview
                                                                                • 17.2.7.2. Products
                                                                                • 17.2.7.3. SWOT Analysis
                                                                                • 17.2.7.4. Recent Developments
                                                                                • 17.2.7.5. Financials (Based on Availability)
                                                                              • 17.2.8 Budli Internet Private Limited
                                                                                • 17.2.8.1. Overview
                                                                                • 17.2.8.2. Products
                                                                                • 17.2.8.3. SWOT Analysis
                                                                                • 17.2.8.4. Recent Developments
                                                                                • 17.2.8.5. Financials (Based on Availability)
                                                                              • 17.2.9 Amazon Renewed
                                                                                • 17.2.9.1. Overview
                                                                                • 17.2.9.2. Products
                                                                                • 17.2.9.3. SWOT Analysis
                                                                                • 17.2.9.4. Recent Developments
                                                                                • 17.2.9.5. Financials (Based on Availability)
                                                                              • 17.2.10 Lenovo Group Ltd
                                                                                • 17.2.10.1. Overview
                                                                                • 17.2.10.2. Products
                                                                                • 17.2.10.3. SWOT Analysis
                                                                                • 17.2.10.4. Recent Developments
                                                                                • 17.2.10.5. Financials (Based on Availability)
                                                                              • 17.2.11 Apple Inc
                                                                                • 17.2.11.1. Overview
                                                                                • 17.2.11.2. Products
                                                                                • 17.2.11.3. SWOT Analysis
                                                                                • 17.2.11.4. Recent Developments
                                                                                • 17.2.11.5. Financials (Based on Availability)

                                                                        List of Figures

                                                                        1. Figure 1: Global Refurbished Computers And Laptops Market Revenue Breakdown (Million, %) by Region 2024 & 2032
                                                                        2. Figure 2: Global Refurbished Computers And Laptops Market Volume Breakdown (K Unit, %) by Region 2024 & 2032
                                                                        3. Figure 3: North America Refurbished Computers And Laptops Market Revenue (Million), by Country 2024 & 2032
                                                                        4. Figure 4: North America Refurbished Computers And Laptops Market Volume (K Unit), by Country 2024 & 2032
                                                                        5. Figure 5: North America Refurbished Computers And Laptops Market Revenue Share (%), by Country 2024 & 2032
                                                                        6. Figure 6: North America Refurbished Computers And Laptops Market Volume Share (%), by Country 2024 & 2032
                                                                        7. Figure 7: Europe Refurbished Computers And Laptops Market Revenue (Million), by Country 2024 & 2032
                                                                        8. Figure 8: Europe Refurbished Computers And Laptops Market Volume (K Unit), by Country 2024 & 2032
                                                                        9. Figure 9: Europe Refurbished Computers And Laptops Market Revenue Share (%), by Country 2024 & 2032
                                                                        10. Figure 10: Europe Refurbished Computers And Laptops Market Volume Share (%), by Country 2024 & 2032
                                                                        11. Figure 11: Asia Pacific Refurbished Computers And Laptops Market Revenue (Million), by Country 2024 & 2032
                                                                        12. Figure 12: Asia Pacific Refurbished Computers And Laptops Market Volume (K Unit), by Country 2024 & 2032
                                                                        13. Figure 13: Asia Pacific Refurbished Computers And Laptops Market Revenue Share (%), by Country 2024 & 2032
                                                                        14. Figure 14: Asia Pacific Refurbished Computers And Laptops Market Volume Share (%), by Country 2024 & 2032
                                                                        15. Figure 15: South America Refurbished Computers And Laptops Market Revenue (Million), by Country 2024 & 2032
                                                                        16. Figure 16: South America Refurbished Computers And Laptops Market Volume (K Unit), by Country 2024 & 2032
                                                                        17. Figure 17: South America Refurbished Computers And Laptops Market Revenue Share (%), by Country 2024 & 2032
                                                                        18. Figure 18: South America Refurbished Computers And Laptops Market Volume Share (%), by Country 2024 & 2032
                                                                        19. Figure 19: MEA Refurbished Computers And Laptops Market Revenue (Million), by Country 2024 & 2032
                                                                        20. Figure 20: MEA Refurbished Computers And Laptops Market Volume (K Unit), by Country 2024 & 2032
                                                                        21. Figure 21: MEA Refurbished Computers And Laptops Market Revenue Share (%), by Country 2024 & 2032
                                                                        22. Figure 22: MEA Refurbished Computers And Laptops Market Volume Share (%), by Country 2024 & 2032
                                                                        23. Figure 23: North America Refurbished Computers And Laptops Market Revenue (Million), by Production Analysis 2024 & 2032
                                                                        24. Figure 24: North America Refurbished Computers And Laptops Market Volume (K Unit), by Production Analysis 2024 & 2032
                                                                        25. Figure 25: North America Refurbished Computers And Laptops Market Revenue Share (%), by Production Analysis 2024 & 2032
                                                                        26. Figure 26: North America Refurbished Computers And Laptops Market Volume Share (%), by Production Analysis 2024 & 2032
                                                                        27. Figure 27: North America Refurbished Computers And Laptops Market Revenue (Million), by Consumption Analysis 2024 & 2032
                                                                        28. Figure 28: North America Refurbished Computers And Laptops Market Volume (K Unit), by Consumption Analysis 2024 & 2032
                                                                        29. Figure 29: North America Refurbished Computers And Laptops Market Revenue Share (%), by Consumption Analysis 2024 & 2032
                                                                        30. Figure 30: North America Refurbished Computers And Laptops Market Volume Share (%), by Consumption Analysis 2024 & 2032
                                                                        31. Figure 31: North America Refurbished Computers And Laptops Market Revenue (Million), by Import Market Analysis (Value & Volume) 2024 & 2032
                                                                        32. Figure 32: North America Refurbished Computers And Laptops Market Volume (K Unit), by Import Market Analysis (Value & Volume) 2024 & 2032
                                                                        33. Figure 33: North America Refurbished Computers And Laptops Market Revenue Share (%), by Import Market Analysis (Value & Volume) 2024 & 2032
                                                                        34. Figure 34: North America Refurbished Computers And Laptops Market Volume Share (%), by Import Market Analysis (Value & Volume) 2024 & 2032
                                                                        35. Figure 35: North America Refurbished Computers And Laptops Market Revenue (Million), by Export Market Analysis (Value & Volume) 2024 & 2032
                                                                        36. Figure 36: North America Refurbished Computers And Laptops Market Volume (K Unit), by Export Market Analysis (Value & Volume) 2024 & 2032
                                                                        37. Figure 37: North America Refurbished Computers And Laptops Market Revenue Share (%), by Export Market Analysis (Value & Volume) 2024 & 2032
                                                                        38. Figure 38: North America Refurbished Computers And Laptops Market Volume Share (%), by Export Market Analysis (Value & Volume) 2024 & 2032
                                                                        39. Figure 39: North America Refurbished Computers And Laptops Market Revenue (Million), by Price Trend Analysis 2024 & 2032
                                                                        40. Figure 40: North America Refurbished Computers And Laptops Market Volume (K Unit), by Price Trend Analysis 2024 & 2032
                                                                        41. Figure 41: North America Refurbished Computers And Laptops Market Revenue Share (%), by Price Trend Analysis 2024 & 2032
                                                                        42. Figure 42: North America Refurbished Computers And Laptops Market Volume Share (%), by Price Trend Analysis 2024 & 2032
                                                                        43. Figure 43: North America Refurbished Computers And Laptops Market Revenue (Million), by Country 2024 & 2032
                                                                        44. Figure 44: North America Refurbished Computers And Laptops Market Volume (K Unit), by Country 2024 & 2032
                                                                        45. Figure 45: North America Refurbished Computers And Laptops Market Revenue Share (%), by Country 2024 & 2032
                                                                        46. Figure 46: North America Refurbished Computers And Laptops Market Volume Share (%), by Country 2024 & 2032
                                                                        47. Figure 47: Europe Refurbished Computers And Laptops Market Revenue (Million), by Production Analysis 2024 & 2032
                                                                        48. Figure 48: Europe Refurbished Computers And Laptops Market Volume (K Unit), by Production Analysis 2024 & 2032
                                                                        49. Figure 49: Europe Refurbished Computers And Laptops Market Revenue Share (%), by Production Analysis 2024 & 2032
                                                                        50. Figure 50: Europe Refurbished Computers And Laptops Market Volume Share (%), by Production Analysis 2024 & 2032
                                                                        51. Figure 51: Europe Refurbished Computers And Laptops Market Revenue (Million), by Consumption Analysis 2024 & 2032
                                                                        52. Figure 52: Europe Refurbished Computers And Laptops Market Volume (K Unit), by Consumption Analysis 2024 & 2032
                                                                        53. Figure 53: Europe Refurbished Computers And Laptops Market Revenue Share (%), by Consumption Analysis 2024 & 2032
                                                                        54. Figure 54: Europe Refurbished Computers And Laptops Market Volume Share (%), by Consumption Analysis 2024 & 2032
                                                                        55. Figure 55: Europe Refurbished Computers And Laptops Market Revenue (Million), by Import Market Analysis (Value & Volume) 2024 & 2032
                                                                        56. Figure 56: Europe Refurbished Computers And Laptops Market Volume (K Unit), by Import Market Analysis (Value & Volume) 2024 & 2032
                                                                        57. Figure 57: Europe Refurbished Computers And Laptops Market Revenue Share (%), by Import Market Analysis (Value & Volume) 2024 & 2032
                                                                        58. Figure 58: Europe Refurbished Computers And Laptops Market Volume Share (%), by Import Market Analysis (Value & Volume) 2024 & 2032
                                                                        59. Figure 59: Europe Refurbished Computers And Laptops Market Revenue (Million), by Export Market Analysis (Value & Volume) 2024 & 2032
                                                                        60. Figure 60: Europe Refurbished Computers And Laptops Market Volume (K Unit), by Export Market Analysis (Value & Volume) 2024 & 2032
                                                                        61. Figure 61: Europe Refurbished Computers And Laptops Market Revenue Share (%), by Export Market Analysis (Value & Volume) 2024 & 2032
                                                                        62. Figure 62: Europe Refurbished Computers And Laptops Market Volume Share (%), by Export Market Analysis (Value & Volume) 2024 & 2032
                                                                        63. Figure 63: Europe Refurbished Computers And Laptops Market Revenue (Million), by Price Trend Analysis 2024 & 2032
                                                                        64. Figure 64: Europe Refurbished Computers And Laptops Market Volume (K Unit), by Price Trend Analysis 2024 & 2032
                                                                        65. Figure 65: Europe Refurbished Computers And Laptops Market Revenue Share (%), by Price Trend Analysis 2024 & 2032
                                                                        66. Figure 66: Europe Refurbished Computers And Laptops Market Volume Share (%), by Price Trend Analysis 2024 & 2032
                                                                        67. Figure 67: Europe Refurbished Computers And Laptops Market Revenue (Million), by Country 2024 & 2032
                                                                        68. Figure 68: Europe Refurbished Computers And Laptops Market Volume (K Unit), by Country 2024 & 2032
                                                                        69. Figure 69: Europe Refurbished Computers And Laptops Market Revenue Share (%), by Country 2024 & 2032
                                                                        70. Figure 70: Europe Refurbished Computers And Laptops Market Volume Share (%), by Country 2024 & 2032
                                                                        71. Figure 71: Asia Refurbished Computers And Laptops Market Revenue (Million), by Production Analysis 2024 & 2032
                                                                        72. Figure 72: Asia Refurbished Computers And Laptops Market Volume (K Unit), by Production Analysis 2024 & 2032
                                                                        73. Figure 73: Asia Refurbished Computers And Laptops Market Revenue Share (%), by Production Analysis 2024 & 2032
                                                                        74. Figure 74: Asia Refurbished Computers And Laptops Market Volume Share (%), by Production Analysis 2024 & 2032
                                                                        75. Figure 75: Asia Refurbished Computers And Laptops Market Revenue (Million), by Consumption Analysis 2024 & 2032
                                                                        76. Figure 76: Asia Refurbished Computers And Laptops Market Volume (K Unit), by Consumption Analysis 2024 & 2032
                                                                        77. Figure 77: Asia Refurbished Computers And Laptops Market Revenue Share (%), by Consumption Analysis 2024 & 2032
                                                                        78. Figure 78: Asia Refurbished Computers And Laptops Market Volume Share (%), by Consumption Analysis 2024 & 2032
                                                                        79. Figure 79: Asia Refurbished Computers And Laptops Market Revenue (Million), by Import Market Analysis (Value & Volume) 2024 & 2032
                                                                        80. Figure 80: Asia Refurbished Computers And Laptops Market Volume (K Unit), by Import Market Analysis (Value & Volume) 2024 & 2032
                                                                        81. Figure 81: Asia Refurbished Computers And Laptops Market Revenue Share (%), by Import Market Analysis (Value & Volume) 2024 & 2032
                                                                        82. Figure 82: Asia Refurbished Computers And Laptops Market Volume Share (%), by Import Market Analysis (Value & Volume) 2024 & 2032
                                                                        83. Figure 83: Asia Refurbished Computers And Laptops Market Revenue (Million), by Export Market Analysis (Value & Volume) 2024 & 2032
                                                                        84. Figure 84: Asia Refurbished Computers And Laptops Market Volume (K Unit), by Export Market Analysis (Value & Volume) 2024 & 2032
                                                                        85. Figure 85: Asia Refurbished Computers And Laptops Market Revenue Share (%), by Export Market Analysis (Value & Volume) 2024 & 2032
                                                                        86. Figure 86: Asia Refurbished Computers And Laptops Market Volume Share (%), by Export Market Analysis (Value & Volume) 2024 & 2032
                                                                        87. Figure 87: Asia Refurbished Computers And Laptops Market Revenue (Million), by Price Trend Analysis 2024 & 2032
                                                                        88. Figure 88: Asia Refurbished Computers And Laptops Market Volume (K Unit), by Price Trend Analysis 2024 & 2032
                                                                        89. Figure 89: Asia Refurbished Computers And Laptops Market Revenue Share (%), by Price Trend Analysis 2024 & 2032
                                                                        90. Figure 90: Asia Refurbished Computers And Laptops Market Volume Share (%), by Price Trend Analysis 2024 & 2032
                                                                        91. Figure 91: Asia Refurbished Computers And Laptops Market Revenue (Million), by Country 2024 & 2032
                                                                        92. Figure 92: Asia Refurbished Computers And Laptops Market Volume (K Unit), by Country 2024 & 2032
                                                                        93. Figure 93: Asia Refurbished Computers And Laptops Market Revenue Share (%), by Country 2024 & 2032
                                                                        94. Figure 94: Asia Refurbished Computers And Laptops Market Volume Share (%), by Country 2024 & 2032
                                                                        95. Figure 95: Australia and New Zealand Refurbished Computers And Laptops Market Revenue (Million), by Production Analysis 2024 & 2032
                                                                        96. Figure 96: Australia and New Zealand Refurbished Computers And Laptops Market Volume (K Unit), by Production Analysis 2024 & 2032
                                                                        97. Figure 97: Australia and New Zealand Refurbished Computers And Laptops Market Revenue Share (%), by Production Analysis 2024 & 2032
                                                                        98. Figure 98: Australia and New Zealand Refurbished Computers And Laptops Market Volume Share (%), by Production Analysis 2024 & 2032
                                                                        99. Figure 99: Australia and New Zealand Refurbished Computers And Laptops Market Revenue (Million), by Consumption Analysis 2024 & 2032
                                                                        100. Figure 100: Australia and New Zealand Refurbished Computers And Laptops Market Volume (K Unit), by Consumption Analysis 2024 & 2032
                                                                        101. Figure 101: Australia and New Zealand Refurbished Computers And Laptops Market Revenue Share (%), by Consumption Analysis 2024 & 2032
                                                                        102. Figure 102: Australia and New Zealand Refurbished Computers And Laptops Market Volume Share (%), by Consumption Analysis 2024 & 2032
                                                                        103. Figure 103: Australia and New Zealand Refurbished Computers And Laptops Market Revenue (Million), by Import Market Analysis (Value & Volume) 2024 & 2032
                                                                        104. Figure 104: Australia and New Zealand Refurbished Computers And Laptops Market Volume (K Unit), by Import Market Analysis (Value & Volume) 2024 & 2032
                                                                        105. Figure 105: Australia and New Zealand Refurbished Computers And Laptops Market Revenue Share (%), by Import Market Analysis (Value & Volume) 2024 & 2032
                                                                        106. Figure 106: Australia and New Zealand Refurbished Computers And Laptops Market Volume Share (%), by Import Market Analysis (Value & Volume) 2024 & 2032
                                                                        107. Figure 107: Australia and New Zealand Refurbished Computers And Laptops Market Revenue (Million), by Export Market Analysis (Value & Volume) 2024 & 2032
                                                                        108. Figure 108: Australia and New Zealand Refurbished Computers And Laptops Market Volume (K Unit), by Export Market Analysis (Value & Volume) 2024 & 2032
                                                                        109. Figure 109: Australia and New Zealand Refurbished Computers And Laptops Market Revenue Share (%), by Export Market Analysis (Value & Volume) 2024 & 2032
                                                                        110. Figure 110: Australia and New Zealand Refurbished Computers And Laptops Market Volume Share (%), by Export Market Analysis (Value & Volume) 2024 & 2032
                                                                        111. Figure 111: Australia and New Zealand Refurbished Computers And Laptops Market Revenue (Million), by Price Trend Analysis 2024 & 2032
                                                                        112. Figure 112: Australia and New Zealand Refurbished Computers And Laptops Market Volume (K Unit), by Price Trend Analysis 2024 & 2032
                                                                        113. Figure 113: Australia and New Zealand Refurbished Computers And Laptops Market Revenue Share (%), by Price Trend Analysis 2024 & 2032
                                                                        114. Figure 114: Australia and New Zealand Refurbished Computers And Laptops Market Volume Share (%), by Price Trend Analysis 2024 & 2032
                                                                        115. Figure 115: Australia and New Zealand Refurbished Computers And Laptops Market Revenue (Million), by Country 2024 & 2032
                                                                        116. Figure 116: Australia and New Zealand Refurbished Computers And Laptops Market Volume (K Unit), by Country 2024 & 2032
                                                                        117. Figure 117: Australia and New Zealand Refurbished Computers And Laptops Market Revenue Share (%), by Country 2024 & 2032
                                                                        118. Figure 118: Australia and New Zealand Refurbished Computers And Laptops Market Volume Share (%), by Country 2024 & 2032
                                                                        119. Figure 119: Latin America Refurbished Computers And Laptops Market Revenue (Million), by Production Analysis 2024 & 2032
                                                                        120. Figure 120: Latin America Refurbished Computers And Laptops Market Volume (K Unit), by Production Analysis 2024 & 2032
                                                                        121. Figure 121: Latin America Refurbished Computers And Laptops Market Revenue Share (%), by Production Analysis 2024 & 2032
                                                                        122. Figure 122: Latin America Refurbished Computers And Laptops Market Volume Share (%), by Production Analysis 2024 & 2032
                                                                        123. Figure 123: Latin America Refurbished Computers And Laptops Market Revenue (Million), by Consumption Analysis 2024 & 2032
                                                                        124. Figure 124: Latin America Refurbished Computers And Laptops Market Volume (K Unit), by Consumption Analysis 2024 & 2032
                                                                        125. Figure 125: Latin America Refurbished Computers And Laptops Market Revenue Share (%), by Consumption Analysis 2024 & 2032
                                                                        126. Figure 126: Latin America Refurbished Computers And Laptops Market Volume Share (%), by Consumption Analysis 2024 & 2032
                                                                        127. Figure 127: Latin America Refurbished Computers And Laptops Market Revenue (Million), by Import Market Analysis (Value & Volume) 2024 & 2032
                                                                        128. Figure 128: Latin America Refurbished Computers And Laptops Market Volume (K Unit), by Import Market Analysis (Value & Volume) 2024 & 2032
                                                                        129. Figure 129: Latin America Refurbished Computers And Laptops Market Revenue Share (%), by Import Market Analysis (Value & Volume) 2024 & 2032
                                                                        130. Figure 130: Latin America Refurbished Computers And Laptops Market Volume Share (%), by Import Market Analysis (Value & Volume) 2024 & 2032
                                                                        131. Figure 131: Latin America Refurbished Computers And Laptops Market Revenue (Million), by Export Market Analysis (Value & Volume) 2024 & 2032
                                                                        132. Figure 132: Latin America Refurbished Computers And Laptops Market Volume (K Unit), by Export Market Analysis (Value & Volume) 2024 & 2032
                                                                        133. Figure 133: Latin America Refurbished Computers And Laptops Market Revenue Share (%), by Export Market Analysis (Value & Volume) 2024 & 2032
                                                                        134. Figure 134: Latin America Refurbished Computers And Laptops Market Volume Share (%), by Export Market Analysis (Value & Volume) 2024 & 2032
                                                                        135. Figure 135: Latin America Refurbished Computers And Laptops Market Revenue (Million), by Price Trend Analysis 2024 & 2032
                                                                        136. Figure 136: Latin America Refurbished Computers And Laptops Market Volume (K Unit), by Price Trend Analysis 2024 & 2032
                                                                        137. Figure 137: Latin America Refurbished Computers And Laptops Market Revenue Share (%), by Price Trend Analysis 2024 & 2032
                                                                        138. Figure 138: Latin America Refurbished Computers And Laptops Market Volume Share (%), by Price Trend Analysis 2024 & 2032
                                                                        139. Figure 139: Latin America Refurbished Computers And Laptops Market Revenue (Million), by Country 2024 & 2032
                                                                        140. Figure 140: Latin America Refurbished Computers And Laptops Market Volume (K Unit), by Country 2024 & 2032
                                                                        141. Figure 141: Latin America Refurbished Computers And Laptops Market Revenue Share (%), by Country 2024 & 2032
                                                                        142. Figure 142: Latin America Refurbished Computers And Laptops Market Volume Share (%), by Country 2024 & 2032
                                                                        143. Figure 143: Middle East and Africa Refurbished Computers And Laptops Market Revenue (Million), by Production Analysis 2024 & 2032
                                                                        144. Figure 144: Middle East and Africa Refurbished Computers And Laptops Market Volume (K Unit), by Production Analysis 2024 & 2032
                                                                        145. Figure 145: Middle East and Africa Refurbished Computers And Laptops Market Revenue Share (%), by Production Analysis 2024 & 2032
                                                                        146. Figure 146: Middle East and Africa Refurbished Computers And Laptops Market Volume Share (%), by Production Analysis 2024 & 2032
                                                                        147. Figure 147: Middle East and Africa Refurbished Computers And Laptops Market Revenue (Million), by Consumption Analysis 2024 & 2032
                                                                        148. Figure 148: Middle East and Africa Refurbished Computers And Laptops Market Volume (K Unit), by Consumption Analysis 2024 & 2032
                                                                        149. Figure 149: Middle East and Africa Refurbished Computers And Laptops Market Revenue Share (%), by Consumption Analysis 2024 & 2032
                                                                        150. Figure 150: Middle East and Africa Refurbished Computers And Laptops Market Volume Share (%), by Consumption Analysis 2024 & 2032
                                                                        151. Figure 151: Middle East and Africa Refurbished Computers And Laptops Market Revenue (Million), by Import Market Analysis (Value & Volume) 2024 & 2032
                                                                        152. Figure 152: Middle East and Africa Refurbished Computers And Laptops Market Volume (K Unit), by Import Market Analysis (Value & Volume) 2024 & 2032
                                                                        153. Figure 153: Middle East and Africa Refurbished Computers And Laptops Market Revenue Share (%), by Import Market Analysis (Value & Volume) 2024 & 2032
                                                                        154. Figure 154: Middle East and Africa Refurbished Computers And Laptops Market Volume Share (%), by Import Market Analysis (Value & Volume) 2024 & 2032
                                                                        155. Figure 155: Middle East and Africa Refurbished Computers And Laptops Market Revenue (Million), by Export Market Analysis (Value & Volume) 2024 & 2032
                                                                        156. Figure 156: Middle East and Africa Refurbished Computers And Laptops Market Volume (K Unit), by Export Market Analysis (Value & Volume) 2024 & 2032
                                                                        157. Figure 157: Middle East and Africa Refurbished Computers And Laptops Market Revenue Share (%), by Export Market Analysis (Value & Volume) 2024 & 2032
                                                                        158. Figure 158: Middle East and Africa Refurbished Computers And Laptops Market Volume Share (%), by Export Market Analysis (Value & Volume) 2024 & 2032
                                                                        159. Figure 159: Middle East and Africa Refurbished Computers And Laptops Market Revenue (Million), by Price Trend Analysis 2024 & 2032
                                                                        160. Figure 160: Middle East and Africa Refurbished Computers And Laptops Market Volume (K Unit), by Price Trend Analysis 2024 & 2032
                                                                        161. Figure 161: Middle East and Africa Refurbished Computers And Laptops Market Revenue Share (%), by Price Trend Analysis 2024 & 2032
                                                                        162. Figure 162: Middle East and Africa Refurbished Computers And Laptops Market Volume Share (%), by Price Trend Analysis 2024 & 2032
                                                                        163. Figure 163: Middle East and Africa Refurbished Computers And Laptops Market Revenue (Million), by Country 2024 & 2032
                                                                        164. Figure 164: Middle East and Africa Refurbished Computers And Laptops Market Volume (K Unit), by Country 2024 & 2032
                                                                        165. Figure 165: Middle East and Africa Refurbished Computers And Laptops Market Revenue Share (%), by Country 2024 & 2032
                                                                        166. Figure 166: Middle East and Africa Refurbished Computers And Laptops Market Volume Share (%), by Country 2024 & 2032

                                                                        List of Tables

                                                                        1. Table 1: Global Refurbished Computers And Laptops Market Revenue Million Forecast, by Region 2019 & 2032
                                                                        2. Table 2: Global Refurbished Computers And Laptops Market Volume K Unit Forecast, by Region 2019 & 2032
                                                                        3. Table 3: Global Refurbished Computers And Laptops Market Revenue Million Forecast, by Production Analysis 2019 & 2032
                                                                        4. Table 4: Global Refurbished Computers And Laptops Market Volume K Unit Forecast, by Production Analysis 2019 & 2032
                                                                        5. Table 5: Global Refurbished Computers And Laptops Market Revenue Million Forecast, by Consumption Analysis 2019 & 2032
                                                                        6. Table 6: Global Refurbished Computers And Laptops Market Volume K Unit Forecast, by Consumption Analysis 2019 & 2032
                                                                        7. Table 7: Global Refurbished Computers And Laptops Market Revenue Million Forecast, by Import Market Analysis (Value & Volume) 2019 & 2032
                                                                        8. Table 8: Global Refurbished Computers And Laptops Market Volume K Unit Forecast, by Import Market Analysis (Value & Volume) 2019 & 2032
                                                                        9. Table 9: Global Refurbished Computers And Laptops Market Revenue Million Forecast, by Export Market Analysis (Value & Volume) 2019 & 2032
                                                                        10. Table 10: Global Refurbished Computers And Laptops Market Volume K Unit Forecast, by Export Market Analysis (Value & Volume) 2019 & 2032
                                                                        11. Table 11: Global Refurbished Computers And Laptops Market Revenue Million Forecast, by Price Trend Analysis 2019 & 2032
                                                                        12. Table 12: Global Refurbished Computers And Laptops Market Volume K Unit Forecast, by Price Trend Analysis 2019 & 2032
                                                                        13. Table 13: Global Refurbished Computers And Laptops Market Revenue Million Forecast, by Region 2019 & 2032
                                                                        14. Table 14: Global Refurbished Computers And Laptops Market Volume K Unit Forecast, by Region 2019 & 2032
                                                                        15. Table 15: Global Refurbished Computers And Laptops Market Revenue Million Forecast, by Country 2019 & 2032
                                                                        16. Table 16: Global Refurbished Computers And Laptops Market Volume K Unit Forecast, by Country 2019 & 2032
                                                                        17. Table 17: United States Refurbished Computers And Laptops Market Revenue (Million) Forecast, by Application 2019 & 2032
                                                                        18. Table 18: United States Refurbished Computers And Laptops Market Volume (K Unit) Forecast, by Application 2019 & 2032
                                                                        19. Table 19: Canada Refurbished Computers And Laptops Market Revenue (Million) Forecast, by Application 2019 & 2032
                                                                        20. Table 20: Canada Refurbished Computers And Laptops Market Volume (K Unit) Forecast, by Application 2019 & 2032
                                                                        21. Table 21: Mexico Refurbished Computers And Laptops Market Revenue (Million) Forecast, by Application 2019 & 2032
                                                                        22. Table 22: Mexico Refurbished Computers And Laptops Market Volume (K Unit) Forecast, by Application 2019 & 2032
                                                                        23. Table 23: Global Refurbished Computers And Laptops Market Revenue Million Forecast, by Country 2019 & 2032
                                                                        24. Table 24: Global Refurbished Computers And Laptops Market Volume K Unit Forecast, by Country 2019 & 2032
                                                                        25. Table 25: Germany Refurbished Computers And Laptops Market Revenue (Million) Forecast, by Application 2019 & 2032
                                                                        26. Table 26: Germany Refurbished Computers And Laptops Market Volume (K Unit) Forecast, by Application 2019 & 2032
                                                                        27. Table 27: United Kingdom Refurbished Computers And Laptops Market Revenue (Million) Forecast, by Application 2019 & 2032
                                                                        28. Table 28: United Kingdom Refurbished Computers And Laptops Market Volume (K Unit) Forecast, by Application 2019 & 2032
                                                                        29. Table 29: France Refurbished Computers And Laptops Market Revenue (Million) Forecast, by Application 2019 & 2032
                                                                        30. Table 30: France Refurbished Computers And Laptops Market Volume (K Unit) Forecast, by Application 2019 & 2032
                                                                        31. Table 31: Spain Refurbished Computers And Laptops Market Revenue (Million) Forecast, by Application 2019 & 2032
                                                                        32. Table 32: Spain Refurbished Computers And Laptops Market Volume (K Unit) Forecast, by Application 2019 & 2032
                                                                        33. Table 33: Italy Refurbished Computers And Laptops Market Revenue (Million) Forecast, by Application 2019 & 2032
                                                                        34. Table 34: Italy Refurbished Computers And Laptops Market Volume (K Unit) Forecast, by Application 2019 & 2032
                                                                        35. Table 35: Spain Refurbished Computers And Laptops Market Revenue (Million) Forecast, by Application 2019 & 2032
                                                                        36. Table 36: Spain Refurbished Computers And Laptops Market Volume (K Unit) Forecast, by Application 2019 & 2032
                                                                        37. Table 37: Belgium Refurbished Computers And Laptops Market Revenue (Million) Forecast, by Application 2019 & 2032
                                                                        38. Table 38: Belgium Refurbished Computers And Laptops Market Volume (K Unit) Forecast, by Application 2019 & 2032
                                                                        39. Table 39: Netherland Refurbished Computers And Laptops Market Revenue (Million) Forecast, by Application 2019 & 2032
                                                                        40. Table 40: Netherland Refurbished Computers And Laptops Market Volume (K Unit) Forecast, by Application 2019 & 2032
                                                                        41. Table 41: Nordics Refurbished Computers And Laptops Market Revenue (Million) Forecast, by Application 2019 & 2032
                                                                        42. Table 42: Nordics Refurbished Computers And Laptops Market Volume (K Unit) Forecast, by Application 2019 & 2032
                                                                        43. Table 43: Rest of Europe Refurbished Computers And Laptops Market Revenue (Million) Forecast, by Application 2019 & 2032
                                                                        44. Table 44: Rest of Europe Refurbished Computers And Laptops Market Volume (K Unit) Forecast, by Application 2019 & 2032
                                                                        45. Table 45: Global Refurbished Computers And Laptops Market Revenue Million Forecast, by Country 2019 & 2032
                                                                        46. Table 46: Global Refurbished Computers And Laptops Market Volume K Unit Forecast, by Country 2019 & 2032
                                                                        47. Table 47: China Refurbished Computers And Laptops Market Revenue (Million) Forecast, by Application 2019 & 2032
                                                                        48. Table 48: China Refurbished Computers And Laptops Market Volume (K Unit) Forecast, by Application 2019 & 2032
                                                                        49. Table 49: Japan Refurbished Computers And Laptops Market Revenue (Million) Forecast, by Application 2019 & 2032
                                                                        50. Table 50: Japan Refurbished Computers And Laptops Market Volume (K Unit) Forecast, by Application 2019 & 2032
                                                                        51. Table 51: India Refurbished Computers And Laptops Market Revenue (Million) Forecast, by Application 2019 & 2032
                                                                        52. Table 52: India Refurbished Computers And Laptops Market Volume (K Unit) Forecast, by Application 2019 & 2032
                                                                        53. Table 53: South Korea Refurbished Computers And Laptops Market Revenue (Million) Forecast, by Application 2019 & 2032
                                                                        54. Table 54: South Korea Refurbished Computers And Laptops Market Volume (K Unit) Forecast, by Application 2019 & 2032
                                                                        55. Table 55: Southeast Asia Refurbished Computers And Laptops Market Revenue (Million) Forecast, by Application 2019 & 2032
                                                                        56. Table 56: Southeast Asia Refurbished Computers And Laptops Market Volume (K Unit) Forecast, by Application 2019 & 2032
                                                                        57. Table 57: Australia Refurbished Computers And Laptops Market Revenue (Million) Forecast, by Application 2019 & 2032
                                                                        58. Table 58: Australia Refurbished Computers And Laptops Market Volume (K Unit) Forecast, by Application 2019 & 2032
                                                                        59. Table 59: Indonesia Refurbished Computers And Laptops Market Revenue (Million) Forecast, by Application 2019 & 2032
                                                                        60. Table 60: Indonesia Refurbished Computers And Laptops Market Volume (K Unit) Forecast, by Application 2019 & 2032
                                                                        61. Table 61: Phillipes Refurbished Computers And Laptops Market Revenue (Million) Forecast, by Application 2019 & 2032
                                                                        62. Table 62: Phillipes Refurbished Computers And Laptops Market Volume (K Unit) Forecast, by Application 2019 & 2032
                                                                        63. Table 63: Singapore Refurbished Computers And Laptops Market Revenue (Million) Forecast, by Application 2019 & 2032
                                                                        64. Table 64: Singapore Refurbished Computers And Laptops Market Volume (K Unit) Forecast, by Application 2019 & 2032
                                                                        65. Table 65: Thailandc Refurbished Computers And Laptops Market Revenue (Million) Forecast, by Application 2019 & 2032
                                                                        66. Table 66: Thailandc Refurbished Computers And Laptops Market Volume (K Unit) Forecast, by Application 2019 & 2032
                                                                        67. Table 67: Rest of Asia Pacific Refurbished Computers And Laptops Market Revenue (Million) Forecast, by Application 2019 & 2032
                                                                        68. Table 68: Rest of Asia Pacific Refurbished Computers And Laptops Market Volume (K Unit) Forecast, by Application 2019 & 2032
                                                                        69. Table 69: Global Refurbished Computers And Laptops Market Revenue Million Forecast, by Country 2019 & 2032
                                                                        70. Table 70: Global Refurbished Computers And Laptops Market Volume K Unit Forecast, by Country 2019 & 2032
                                                                        71. Table 71: Brazil Refurbished Computers And Laptops Market Revenue (Million) Forecast, by Application 2019 & 2032
                                                                        72. Table 72: Brazil Refurbished Computers And Laptops Market Volume (K Unit) Forecast, by Application 2019 & 2032
                                                                        73. Table 73: Argentina Refurbished Computers And Laptops Market Revenue (Million) Forecast, by Application 2019 & 2032
                                                                        74. Table 74: Argentina Refurbished Computers And Laptops Market Volume (K Unit) Forecast, by Application 2019 & 2032
                                                                        75. Table 75: Peru Refurbished Computers And Laptops Market Revenue (Million) Forecast, by Application 2019 & 2032
                                                                        76. Table 76: Peru Refurbished Computers And Laptops Market Volume (K Unit) Forecast, by Application 2019 & 2032
                                                                        77. Table 77: Chile Refurbished Computers And Laptops Market Revenue (Million) Forecast, by Application 2019 & 2032
                                                                        78. Table 78: Chile Refurbished Computers And Laptops Market Volume (K Unit) Forecast, by Application 2019 & 2032
                                                                        79. Table 79: Colombia Refurbished Computers And Laptops Market Revenue (Million) Forecast, by Application 2019 & 2032
                                                                        80. Table 80: Colombia Refurbished Computers And Laptops Market Volume (K Unit) Forecast, by Application 2019 & 2032
                                                                        81. Table 81: Ecuador Refurbished Computers And Laptops Market Revenue (Million) Forecast, by Application 2019 & 2032
                                                                        82. Table 82: Ecuador Refurbished Computers And Laptops Market Volume (K Unit) Forecast, by Application 2019 & 2032
                                                                        83. Table 83: Venezuela Refurbished Computers And Laptops Market Revenue (Million) Forecast, by Application 2019 & 2032
                                                                        84. Table 84: Venezuela Refurbished Computers And Laptops Market Volume (K Unit) Forecast, by Application 2019 & 2032
                                                                        85. Table 85: Rest of South America Refurbished Computers And Laptops Market Revenue (Million) Forecast, by Application 2019 & 2032
                                                                        86. Table 86: Rest of South America Refurbished Computers And Laptops Market Volume (K Unit) Forecast, by Application 2019 & 2032
                                                                        87. Table 87: Global Refurbished Computers And Laptops Market Revenue Million Forecast, by Country 2019 & 2032
                                                                        88. Table 88: Global Refurbished Computers And Laptops Market Volume K Unit Forecast, by Country 2019 & 2032
                                                                        89. Table 89: United Arab Emirates Refurbished Computers And Laptops Market Revenue (Million) Forecast, by Application 2019 & 2032
                                                                        90. Table 90: United Arab Emirates Refurbished Computers And Laptops Market Volume (K Unit) Forecast, by Application 2019 & 2032
                                                                        91. Table 91: Saudi Arabia Refurbished Computers And Laptops Market Revenue (Million) Forecast, by Application 2019 & 2032
                                                                        92. Table 92: Saudi Arabia Refurbished Computers And Laptops Market Volume (K Unit) Forecast, by Application 2019 & 2032
                                                                        93. Table 93: South Africa Refurbished Computers And Laptops Market Revenue (Million) Forecast, by Application 2019 & 2032
                                                                        94. Table 94: South Africa Refurbished Computers And Laptops Market Volume (K Unit) Forecast, by Application 2019 & 2032
                                                                        95. Table 95: Rest of Middle East and Africa Refurbished Computers And Laptops Market Revenue (Million) Forecast, by Application 2019 & 2032
                                                                        96. Table 96: Rest of Middle East and Africa Refurbished Computers And Laptops Market Volume (K Unit) Forecast, by Application 2019 & 2032
                                                                        97. Table 97: Global Refurbished Computers And Laptops Market Revenue Million Forecast, by Production Analysis 2019 & 2032
                                                                        98. Table 98: Global Refurbished Computers And Laptops Market Volume K Unit Forecast, by Production Analysis 2019 & 2032
                                                                        99. Table 99: Global Refurbished Computers And Laptops Market Revenue Million Forecast, by Consumption Analysis 2019 & 2032
                                                                        100. Table 100: Global Refurbished Computers And Laptops Market Volume K Unit Forecast, by Consumption Analysis 2019 & 2032
                                                                        101. Table 101: Global Refurbished Computers And Laptops Market Revenue Million Forecast, by Import Market Analysis (Value & Volume) 2019 & 2032
                                                                        102. Table 102: Global Refurbished Computers And Laptops Market Volume K Unit Forecast, by Import Market Analysis (Value & Volume) 2019 & 2032
                                                                        103. Table 103: Global Refurbished Computers And Laptops Market Revenue Million Forecast, by Export Market Analysis (Value & Volume) 2019 & 2032
                                                                        104. Table 104: Global Refurbished Computers And Laptops Market Volume K Unit Forecast, by Export Market Analysis (Value & Volume) 2019 & 2032
                                                                        105. Table 105: Global Refurbished Computers And Laptops Market Revenue Million Forecast, by Price Trend Analysis 2019 & 2032
                                                                        106. Table 106: Global Refurbished Computers And Laptops Market Volume K Unit Forecast, by Price Trend Analysis 2019 & 2032
                                                                        107. Table 107: Global Refurbished Computers And Laptops Market Revenue Million Forecast, by Country 2019 & 2032
                                                                        108. Table 108: Global Refurbished Computers And Laptops Market Volume K Unit Forecast, by Country 2019 & 2032
                                                                        109. Table 109: Global Refurbished Computers And Laptops Market Revenue Million Forecast, by Production Analysis 2019 & 2032
                                                                        110. Table 110: Global Refurbished Computers And Laptops Market Volume K Unit Forecast, by Production Analysis 2019 & 2032
                                                                        111. Table 111: Global Refurbished Computers And Laptops Market Revenue Million Forecast, by Consumption Analysis 2019 & 2032
                                                                        112. Table 112: Global Refurbished Computers And Laptops Market Volume K Unit Forecast, by Consumption Analysis 2019 & 2032
                                                                        113. Table 113: Global Refurbished Computers And Laptops Market Revenue Million Forecast, by Import Market Analysis (Value & Volume) 2019 & 2032
                                                                        114. Table 114: Global Refurbished Computers And Laptops Market Volume K Unit Forecast, by Import Market Analysis (Value & Volume) 2019 & 2032
                                                                        115. Table 115: Global Refurbished Computers And Laptops Market Revenue Million Forecast, by Export Market Analysis (Value & Volume) 2019 & 2032
                                                                        116. Table 116: Global Refurbished Computers And Laptops Market Volume K Unit Forecast, by Export Market Analysis (Value & Volume) 2019 & 2032
                                                                        117. Table 117: Global Refurbished Computers And Laptops Market Revenue Million Forecast, by Price Trend Analysis 2019 & 2032
                                                                        118. Table 118: Global Refurbished Computers And Laptops Market Volume K Unit Forecast, by Price Trend Analysis 2019 & 2032
                                                                        119. Table 119: Global Refurbished Computers And Laptops Market Revenue Million Forecast, by Country 2019 & 2032
                                                                        120. Table 120: Global Refurbished Computers And Laptops Market Volume K Unit Forecast, by Country 2019 & 2032
                                                                        121. Table 121: Global Refurbished Computers And Laptops Market Revenue Million Forecast, by Production Analysis 2019 & 2032
                                                                        122. Table 122: Global Refurbished Computers And Laptops Market Volume K Unit Forecast, by Production Analysis 2019 & 2032
                                                                        123. Table 123: Global Refurbished Computers And Laptops Market Revenue Million Forecast, by Consumption Analysis 2019 & 2032
                                                                        124. Table 124: Global Refurbished Computers And Laptops Market Volume K Unit Forecast, by Consumption Analysis 2019 & 2032
                                                                        125. Table 125: Global Refurbished Computers And Laptops Market Revenue Million Forecast, by Import Market Analysis (Value & Volume) 2019 & 2032
                                                                        126. Table 126: Global Refurbished Computers And Laptops Market Volume K Unit Forecast, by Import Market Analysis (Value & Volume) 2019 & 2032
                                                                        127. Table 127: Global Refurbished Computers And Laptops Market Revenue Million Forecast, by Export Market Analysis (Value & Volume) 2019 & 2032
                                                                        128. Table 128: Global Refurbished Computers And Laptops Market Volume K Unit Forecast, by Export Market Analysis (Value & Volume) 2019 & 2032
                                                                        129. Table 129: Global Refurbished Computers And Laptops Market Revenue Million Forecast, by Price Trend Analysis 2019 & 2032
                                                                        130. Table 130: Global Refurbished Computers And Laptops Market Volume K Unit Forecast, by Price Trend Analysis 2019 & 2032
                                                                        131. Table 131: Global Refurbished Computers And Laptops Market Revenue Million Forecast, by Country 2019 & 2032
                                                                        132. Table 132: Global Refurbished Computers And Laptops Market Volume K Unit Forecast, by Country 2019 & 2032
                                                                        133. Table 133: Global Refurbished Computers And Laptops Market Revenue Million Forecast, by Production Analysis 2019 & 2032
                                                                        134. Table 134: Global Refurbished Computers And Laptops Market Volume K Unit Forecast, by Production Analysis 2019 & 2032
                                                                        135. Table 135: Global Refurbished Computers And Laptops Market Revenue Million Forecast, by Consumption Analysis 2019 & 2032
                                                                        136. Table 136: Global Refurbished Computers And Laptops Market Volume K Unit Forecast, by Consumption Analysis 2019 & 2032
                                                                        137. Table 137: Global Refurbished Computers And Laptops Market Revenue Million Forecast, by Import Market Analysis (Value & Volume) 2019 & 2032
                                                                        138. Table 138: Global Refurbished Computers And Laptops Market Volume K Unit Forecast, by Import Market Analysis (Value & Volume) 2019 & 2032
                                                                        139. Table 139: Global Refurbished Computers And Laptops Market Revenue Million Forecast, by Export Market Analysis (Value & Volume) 2019 & 2032
                                                                        140. Table 140: Global Refurbished Computers And Laptops Market Volume K Unit Forecast, by Export Market Analysis (Value & Volume) 2019 & 2032
                                                                        141. Table 141: Global Refurbished Computers And Laptops Market Revenue Million Forecast, by Price Trend Analysis 2019 & 2032
                                                                        142. Table 142: Global Refurbished Computers And Laptops Market Volume K Unit Forecast, by Price Trend Analysis 2019 & 2032
                                                                        143. Table 143: Global Refurbished Computers And Laptops Market Revenue Million Forecast, by Country 2019 & 2032
                                                                        144. Table 144: Global Refurbished Computers And Laptops Market Volume K Unit Forecast, by Country 2019 & 2032
                                                                        145. Table 145: Global Refurbished Computers And Laptops Market Revenue Million Forecast, by Production Analysis 2019 & 2032
                                                                        146. Table 146: Global Refurbished Computers And Laptops Market Volume K Unit Forecast, by Production Analysis 2019 & 2032
                                                                        147. Table 147: Global Refurbished Computers And Laptops Market Revenue Million Forecast, by Consumption Analysis 2019 & 2032
                                                                        148. Table 148: Global Refurbished Computers And Laptops Market Volume K Unit Forecast, by Consumption Analysis 2019 & 2032
                                                                        149. Table 149: Global Refurbished Computers And Laptops Market Revenue Million Forecast, by Import Market Analysis (Value & Volume) 2019 & 2032
                                                                        150. Table 150: Global Refurbished Computers And Laptops Market Volume K Unit Forecast, by Import Market Analysis (Value & Volume) 2019 & 2032
                                                                        151. Table 151: Global Refurbished Computers And Laptops Market Revenue Million Forecast, by Export Market Analysis (Value & Volume) 2019 & 2032
                                                                        152. Table 152: Global Refurbished Computers And Laptops Market Volume K Unit Forecast, by Export Market Analysis (Value & Volume) 2019 & 2032
                                                                        153. Table 153: Global Refurbished Computers And Laptops Market Revenue Million Forecast, by Price Trend Analysis 2019 & 2032
                                                                        154. Table 154: Global Refurbished Computers And Laptops Market Volume K Unit Forecast, by Price Trend Analysis 2019 & 2032
                                                                        155. Table 155: Global Refurbished Computers And Laptops Market Revenue Million Forecast, by Country 2019 & 2032
                                                                        156. Table 156: Global Refurbished Computers And Laptops Market Volume K Unit Forecast, by Country 2019 & 2032
                                                                        157. Table 157: Global Refurbished Computers And Laptops Market Revenue Million Forecast, by Production Analysis 2019 & 2032
                                                                        158. Table 158: Global Refurbished Computers And Laptops Market Volume K Unit Forecast, by Production Analysis 2019 & 2032
                                                                        159. Table 159: Global Refurbished Computers And Laptops Market Revenue Million Forecast, by Consumption Analysis 2019 & 2032
                                                                        160. Table 160: Global Refurbished Computers And Laptops Market Volume K Unit Forecast, by Consumption Analysis 2019 & 2032
                                                                        161. Table 161: Global Refurbished Computers And Laptops Market Revenue Million Forecast, by Import Market Analysis (Value & Volume) 2019 & 2032
                                                                        162. Table 162: Global Refurbished Computers And Laptops Market Volume K Unit Forecast, by Import Market Analysis (Value & Volume) 2019 & 2032
                                                                        163. Table 163: Global Refurbished Computers And Laptops Market Revenue Million Forecast, by Export Market Analysis (Value & Volume) 2019 & 2032
                                                                        164. Table 164: Global Refurbished Computers And Laptops Market Volume K Unit Forecast, by Export Market Analysis (Value & Volume) 2019 & 2032
                                                                        165. Table 165: Global Refurbished Computers And Laptops Market Revenue Million Forecast, by Price Trend Analysis 2019 & 2032
                                                                        166. Table 166: Global Refurbished Computers And Laptops Market Volume K Unit Forecast, by Price Trend Analysis 2019 & 2032
                                                                        167. Table 167: Global Refurbished Computers And Laptops Market Revenue Million Forecast, by Country 2019 & 2032
                                                                        168. Table 168: Global Refurbished Computers And Laptops Market Volume K Unit Forecast, by Country 2019 & 2032


                                                                        Frequently Asked Questions

                                                                        1. What is the projected Compound Annual Growth Rate (CAGR) of the Refurbished Computers And Laptops Market?

                                                                        The projected CAGR is approximately 10.24%.

                                                                        2. Which companies are prominent players in the Refurbished Computers And Laptops Market?

                                                                        Key companies in the market include Microsoft, Newegg Inc, Acer Inc, SAMSUNG, Best Buy, HP Development Company L P, Dell Inc, Budli Internet Private Limited, Amazon Renewed, Lenovo Group Ltd, Apple Inc.

                                                                        3. What are the main segments of the Refurbished Computers And Laptops Market?

                                                                        The market segments include Production Analysis, Consumption Analysis, Import Market Analysis (Value & Volume), Export Market Analysis (Value & Volume), Price Trend Analysis.

                                                                        4. Can you provide details about the market size?

                                                                        The market size is estimated to be USD XX Million as of 2022.

                                                                        5. What are some drivers contributing to market growth?

                                                                        Cost Savings and Affordability of the Refurbished Devices; Growing awareness about E waste and Environmental Consciousness.

                                                                        6. What are the notable trends driving market growth?

                                                                        Growing awareness about E waste and Environmental Consciousness.

                                                                        7. Are there any restraints impacting market growth?

                                                                        Lack of Awareness About Intellectual Property Outsourcing.

                                                                        8. Can you provide examples of recent developments in the market?

                                                                        May 2023: In a collaborative effort, Li-Cycle Holdings Corp. and Shift2 joined forces to generously donate 60 refurbished laptops to the graduating seniors of Edison Career and Technology High School. Li-Cycle is a pioneering leader in lithium-ion battery reserve recovery and holds a prominent position as the leading lithium-ion battery recycling company in North America. These refurbished devices have been distributed to students who have either completed a college application, submitted a financial aid request, or actively pursued employment in related fields.

                                                                        9. What pricing options are available for accessing the report?

                                                                        Pricing options include single-user, multi-user, and enterprise licenses priced at USD 4750, USD 5250, and USD 8750 respectively.

                                                                        10. Is the market size provided in terms of value or volume?

                                                                        The market size is provided in terms of value, measured in Million and volume, measured in K Unit.

                                                                        11. Are there any specific market keywords associated with the report?

                                                                        Yes, the market keyword associated with the report is "Refurbished Computers And Laptops Market," which aids in identifying and referencing the specific market segment covered.

                                                                        12. How do I determine which pricing option suits my needs best?

                                                                        The pricing options vary based on user requirements and access needs. Individual users may opt for single-user licenses, while businesses requiring broader access may choose multi-user or enterprise licenses for cost-effective access to the report.

                                                                        13. Are there any additional resources or data provided in the Refurbished Computers And Laptops Market report?

                                                                        While the report offers comprehensive insights, it's advisable to review the specific contents or supplementary materials provided to ascertain if additional resources or data are available.

                                                                        14. How can I stay updated on further developments or reports in the Refurbished Computers And Laptops Market?

                                                                        To stay informed about further developments, trends, and reports in the Refurbished Computers And Laptops Market, consider subscribing to industry newsletters, following relevant companies and organizations, or regularly checking reputable industry news sources and publications.


                                                                        Methodology

                                                                        Step 1 - Identification of Relevant Samples Size from Population Database

                                                                        Step Chart
                                                                        Bar Chart
                                                                        Method Chart

                                                                        Step 2 - Approaches for Defining Global Market Size (Value, Volume* & Price*)

                                                                        Approach Chart
                                                                        Top-down and bottom-up approaches are used to validate the global market size and estimate the market size for manufactures, regional segments, product, and application.

                                                                        Note*: In applicable scenarios

                                                                        Step 3 - Data Sources

                                                                        Primary Research

                                                                        • Web Analytics
                                                                        • Survey Reports
                                                                        • Research Institute
                                                                        • Latest Research Reports
                                                                        • Opinion Leaders

                                                                        Secondary Research

                                                                        • Annual Reports
                                                                        • White Paper
                                                                        • Latest Press Release
                                                                        • Industry Association
                                                                        • Paid Database
                                                                        • Investor Presentations
                                                                        Analyst Chart

                                                                        Step 4 - Data Triangulation

                                                                        Involves using different sources of information in order to increase the validity of a study

                                                                        These sources are likely to be stakeholders in a program - participants, other researchers, program staff, other community members, and so on.

                                                                        Then we put all data in single framework & apply various statistical tools to find out the dynamic on the market.

                                                                        During the analysis stage, feedback from the stakeholder groups would be compared to determine areas of agreement as well as areas of divergence

                                                                        Additionally, after gathering mixed and scattered data from a wide range of sources, data is triangulated and correlated to come up with estimated figures which are further validated through primary mediums or industry experts, opinion leaders.

                                                                        About Research Axiom

                                                                        Research Axiom delivers in-depth market research, industry analysis, and consulting for pharmaceuticals, automotive, IT, and consumer goods. Our reports provide the clarity you need to make informed decisions and drive innovation.

                                                                        Our team combines primary research, advanced analytics, and sector expertise to deliver actionable intelligence. We offer syndicated reports, custom research, and consulting services tailored to your business needs.

                                                                        At Research Axiom, we are committed to quality, transparency, and client satisfaction. Every report is rigorously validated to ensure accuracy and relevance. Our global perspective and local expertise help you understand both the big picture and the finer details of your market.

                                                                        Stay informed with Research Axiom. Subscribe to our newsletter for the latest updates and research highlights, and follow us on social media for real-time insights. Research Axiom – Turning Data into Business Advantage.

                                                                        artwork spiralartwork spiralRelated Reports
                                                                        artwork underline

                                                                        Exploring Consumer Shifts in Valves Market Market 2025-2033

                                                                        The global valves market is booming, projected to reach [estimated 2033 market size] by 2033, with a CAGR of 6.25%. This comprehensive analysis explores market drivers, trends, restraints, segmentation (by type & end-user), key players (Flowserve, Alfa Laval, Emerson), and regional growth projections. Discover key insights for industry professionals and investors.

                                                                        August 2025
                                                                        Base Year: 2024
                                                                        No Of Pages: 234
                                                                        Price: $4750

                                                                        Video Wall Industry in Focus: Growth Trajectories and Strategic Insights 2025-2033

                                                                        Discover the booming video wall market! Our analysis reveals an 11% CAGR, driven by retail, transportation, and corporate adoption. Explore market size, key players (Samsung, LG, ViewSonic), and regional trends in this comprehensive report. Learn about LED vs. LCD technology and future growth projections.

                                                                        August 2025
                                                                        Base Year: 2024
                                                                        No Of Pages: 234
                                                                        Price: $4750

                                                                        Asia Pacific Data Center Industry Market Report: Strategic Insights

                                                                        The Asia-Pacific data center market is booming, with a projected CAGR of 21.06% through 2033. Discover key drivers, trends, and leading companies shaping this dynamic industry, including insights into regional market share and growth projections. Explore the impact of cloud adoption, 5G, and edge computing on data center expansion in China, India, Japan, and Australia.

                                                                        August 2025
                                                                        Base Year: 2024
                                                                        No Of Pages: 197
                                                                        Price: $3800

                                                                        Hazardous Area Equipment Market 2025-2033 Trends: Unveiling Growth Opportunities and Competitor Dynamics

                                                                        The Hazardous Area Equipment market is booming, projected to reach $19.66 billion by 2033, driven by stringent safety regulations and rising industrial automation. This comprehensive analysis explores market size, growth drivers, regional trends, key players (like ABB, Siemens, Rockwell Automation), and future prospects for explosion-proof and intrinsically safe equipment.

                                                                        August 2025
                                                                        Base Year: 2024
                                                                        No Of Pages: 234
                                                                        Price: $4750

                                                                        Strategic Insights for Sensors in Oil and Gas Market Market Expansion

                                                                        The global Sensors in Oil and Gas market is booming, projected to reach $9.97B in 2025 with a 6.03% CAGR through 2033. Driven by automation, safety regulations, and technological advancements, this report analyzes market trends, key players (Honeywell, ABB, Siemens), and regional growth across North America, Europe, and Asia Pacific. Explore the opportunities in gas, temperature, and other sensor types.

                                                                        August 2025
                                                                        Base Year: 2024
                                                                        No Of Pages: 234
                                                                        Price: $4750

                                                                        Asia-Pacific Video Surveillance Storage Market Trends and Opportunities for Growth

                                                                        The Asia-Pacific video surveillance storage market is booming, projected to reach \$3.95 billion by 2025 with a 6.61% CAGR. Driven by smart city initiatives and cybersecurity concerns, this report analyzes market trends, key players (Hikvision, Huawei, Seagate), and regional growth forecasts through 2033.

                                                                        August 2025
                                                                        Base Year: 2024
                                                                        No Of Pages: 197
                                                                        Price: $3800

                                                                        Industrial Control Systems Industry Industry’s Future Growth Prospects

                                                                        The Industrial Control Systems (ICS) market is booming, projected to reach $377 million by 2033 with an 8.9% CAGR. Discover key trends, regional breakdowns, and leading companies driving this growth in SCADA, DCS, PLC, and other automation solutions across oil & gas, manufacturing, and more.

                                                                        August 2025
                                                                        Base Year: 2024
                                                                        No Of Pages: 234
                                                                        Price: $4750

                                                                        Comprehensive Overview of Information Security Consultant Industry Trends: 2025-2033

                                                                        The Information Security Consultant market is booming, projected to reach [estimated 2033 market size based on CAGR] by 2033, fueled by rising cyber threats and data privacy regulations. This comprehensive market analysis explores key drivers, trends, restraints, and regional insights, highlighting leading companies and lucrative opportunities in cloud security, threat intelligence, and AI-driven solutions.

                                                                        August 2025
                                                                        Base Year: 2024
                                                                        No Of Pages: 234
                                                                        Price: $4750

                                                                        Italy Data Center Cooling Market Market Dynamics and Growth Analysis

                                                                        Discover the booming Italy data center cooling market! This in-depth analysis reveals a CAGR of 10.90% through 2033, driven by cloud computing, big data, and increased digitalization. Explore market trends, key players (Johnson Controls, Asetek, Schneider Electric), and segment analysis, including air-based, liquid-based, and evaporative cooling.

                                                                        August 2025
                                                                        Base Year: 2024
                                                                        No Of Pages: 197
                                                                        Price: $3800

                                                                        Future-Ready Strategies for Observability Market Market Growth

                                                                        The Observability Market is booming, projected to reach $2.51B in 2025 and grow at a CAGR of 9.73% through 2033. Discover key drivers, trends, and challenges shaping this dynamic market, along with leading vendors and regional insights. Learn more about cloud-native, AI-powered observability solutions.

                                                                        August 2025
                                                                        Base Year: 2024
                                                                        No Of Pages: 234
                                                                        Price: $4750

                                                                        Deep Dive into Subscriber Data Analysis Market: Comprehensive Growth Analysis 2025-2033

                                                                        The Subscriber Data Management (SDM) market is booming, with a CAGR exceeding 14% through 2033. Discover key trends, drivers, and regional insights in this comprehensive market analysis, featuring leading companies like Ericsson and Huawei. Learn about cloud adoption, market segmentation, and future growth projections.

                                                                        August 2025
                                                                        Base Year: 2024
                                                                        No Of Pages: 234
                                                                        Price: $4750

                                                                        Strategic Vision for North America Strategic Consulting Industry Market Expansion

                                                                        Discover the booming North American strategic consulting market. This in-depth analysis reveals a CAGR of 7.20%, driven by digital transformation and regulatory changes. Explore key players, market trends, and future projections for 2025-2033.

                                                                        August 2025
                                                                        Base Year: 2024
                                                                        No Of Pages: 210
                                                                        Price: $4750

                                                                        Unlocking Insights for APAC Machine Vision Systems Market Growth Strategies

                                                                        The APAC machine vision systems market is booming, projected to reach $Y billion by 2033 with a 9.5% CAGR. Driven by automation & Industry 4.0, key segments include PC-based systems, smart cameras, and applications in electronics, food & beverage. Discover key trends, market size, and leading companies in this explosive growth sector.

                                                                        August 2025
                                                                        Base Year: 2024
                                                                        No Of Pages: 210
                                                                        Price: $4750

                                                                        Liquid Lens Modules Market Market Analysis and Forecasts

                                                                        Discover the booming Liquid Lens Modules market forecast to 2033! This comprehensive analysis reveals key growth drivers, market segmentation by component & application, leading companies, and regional trends. Learn about the opportunities and challenges shaping this dynamic sector in automotive, medical imaging, and more.

                                                                        August 2025
                                                                        Base Year: 2024
                                                                        No Of Pages: 234
                                                                        Price: $4750

                                                                        Portugal POS Terminals Market Market Disruption: Competitor Insights and Trends 2025-2033

                                                                        Discover the booming Portugal POS Terminals market! Explore its €150M (2025) valuation, 10.90% CAGR, key drivers, and leading players like NCR & Verifone. This in-depth analysis reveals market trends and forecasts to 2033, covering segments like mobile POS and retail, hospitality, and healthcare applications.

                                                                        August 2025
                                                                        Base Year: 2024
                                                                        No Of Pages: 197
                                                                        Price: $3800

                                                                        Future Prospects for AG Analytics Market Growth

                                                                        Discover the booming Ag Analytics market! Explore its 14.40% CAGR, key drivers, emerging trends, and regional insights. Learn about leading companies and investment opportunities in this rapidly growing sector of precision agriculture. Get the data-driven analysis you need to understand this transformative market.

                                                                        August 2025
                                                                        Base Year: 2024
                                                                        No Of Pages: 234
                                                                        Price: $4750

                                                                        Comprehensive Insights into Japan Smart Home Market: Trends and Growth Projections 2025-2033

                                                                        Discover the booming Japan Smart Home market! Explore its ¥1.012 trillion (2025) valuation, 14.10% CAGR, key drivers, and leading companies like Schneider Electric & Panasonic. Get insights into market trends, regional breakdowns, and future growth projections until 2033.

                                                                        August 2025
                                                                        Base Year: 2024
                                                                        No Of Pages: 197
                                                                        Price: $3800

                                                                        Benelux Cybersecurity Market XX CAGR Growth to Drive Market Size to XXX Million by 2033

                                                                        Discover the booming Benelux cybersecurity market! This in-depth analysis reveals a €4.04 billion market in 2025, projected to grow at a 7.90% CAGR through 2033. Explore key drivers, trends, and leading companies shaping this dynamic landscape. Learn about market segmentation, regional breakdowns, and future growth opportunities.

                                                                        August 2025
                                                                        Base Year: 2024
                                                                        No Of Pages: 197
                                                                        Price: $3800

                                                                        Fixed Wireless Access Market Insights: Market Size Analysis to 2033

                                                                        The Fixed Wireless Access (FWA) market is booming, projected to reach $XX million by 2025 and grow at a CAGR of 10.17% until 2033. This report analyzes market drivers, trends, restraints, segmentation (hardware, services, residential, commercial, industrial), key players (AT&T, Ericsson, Samsung, Verizon), and regional growth. Discover the opportunities in this rapidly expanding sector.

                                                                        August 2025
                                                                        Base Year: 2024
                                                                        No Of Pages: 234
                                                                        Price: $4750

                                                                        Frequency Control Circuits Market 2025-2033 Overview: Trends, Dynamics, and Growth Opportunities

                                                                        The Frequency Control Circuits Market is booming, projected to reach $10.85 billion by 2033, driven by automotive, IoT, and 5G growth. Explore market trends, key players (Texas Instruments, Murata), and regional analysis in this comprehensive report.

                                                                        August 2025
                                                                        Base Year: 2024
                                                                        No Of Pages: 234
                                                                        Price: $4750
                                                                        • Home
                                                                        • About Us
                                                                        • Industries
                                                                          • Aerospace & Defense
                                                                          • Agriculture
                                                                          • Animal Nutrition & Wellness
                                                                          • Automotive
                                                                          • Chemicals & Materials
                                                                          • Consumer Goods and Services
                                                                          • Energy & Power
                                                                          • Financial Services and Investment Intelligence
                                                                          • Food & Beverage
                                                                          • Home and Property Improvement
                                                                          • Hospitality and Tourism
                                                                          • Logistics
                                                                          • Manufacturing Products and Services
                                                                          • Packaging
                                                                          • Professional and Commercial Services
                                                                          • Real Estate and Construction
                                                                          • Retail
                                                                          • Technology, Media and Telecom
                                                                          • Healthcare
                                                                        • Services
                                                                        • Contact
                                                                        Main Logo
                                                                        • Home
                                                                        • About Us
                                                                        • Industries
                                                                          • Aerospace & Defense
                                                                          • Agriculture
                                                                          • Animal Nutrition & Wellness
                                                                          • Automotive
                                                                          • Chemicals & Materials
                                                                          • Consumer Goods and Services
                                                                          • Energy & Power
                                                                          • Financial Services and Investment Intelligence
                                                                          • Food & Beverage
                                                                          • Home and Property Improvement
                                                                          • Hospitality and Tourism
                                                                          • Logistics
                                                                          • Manufacturing Products and Services
                                                                          • Packaging
                                                                          • Professional and Commercial Services
                                                                          • Real Estate and Construction
                                                                          • Retail
                                                                          • Technology, Media and Telecom
                                                                          • Healthcare
                                                                        • Services
                                                                        • Contact
                                                                        +17162654855
                                                                        [email protected]

                                                                        +17162654855

                                                                        [email protected]

                                                                        Business Address

                                                                        Head Office

                                                                        Office no. A 5010, fifth floor, Solitaire Business Hub, Near Phoenix mall, Pune, Maharashtra 411014

                                                                        Contact Information

                                                                        Craig Francis

                                                                        Business Development Head

                                                                        +17162654855

                                                                        [email protected]

                                                                        Connect With Us

                                                                        Secure Payment Partners

                                                                        payment image
                                                                        RetailLogisticsPackagingAutomotiveHealthcareAgricultureEnergy & PowerFood & BeverageAerospace & DefenseChemicals & MaterialsHospitality and TourismAnimal Nutrition & WellnessConsumer Goods and ServicesReal Estate and ConstructionHome and Property ImprovementTechnology, Media and TelecomManufacturing Products and ServicesFinancial Services and Investment Intelligence

                                                                        © 2025 All rights reserved


                                                                        Privacy Policy
                                                                        Terms and Conditions
                                                                        FAQ