
Key Insights
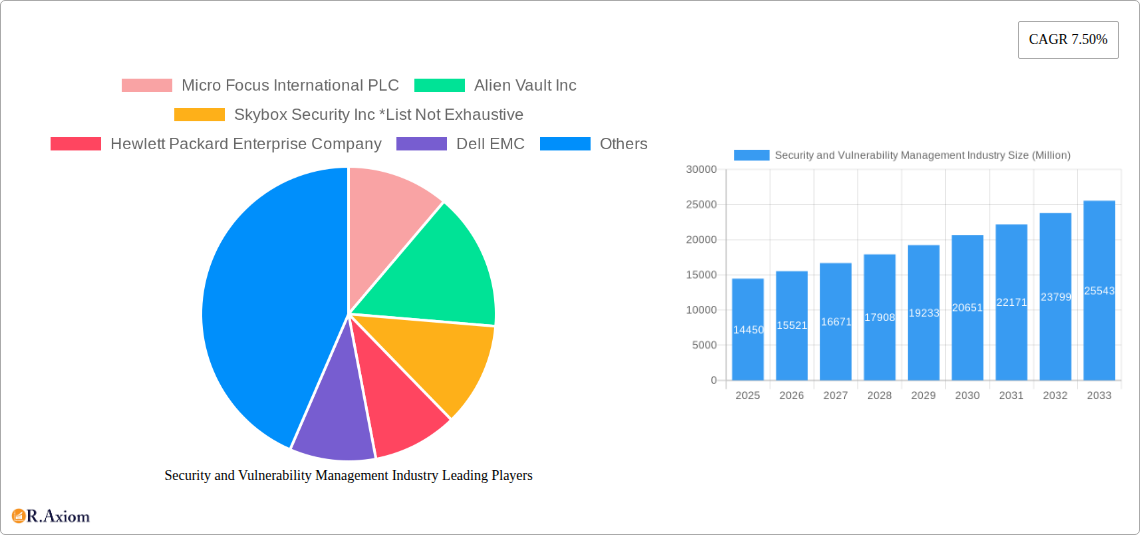
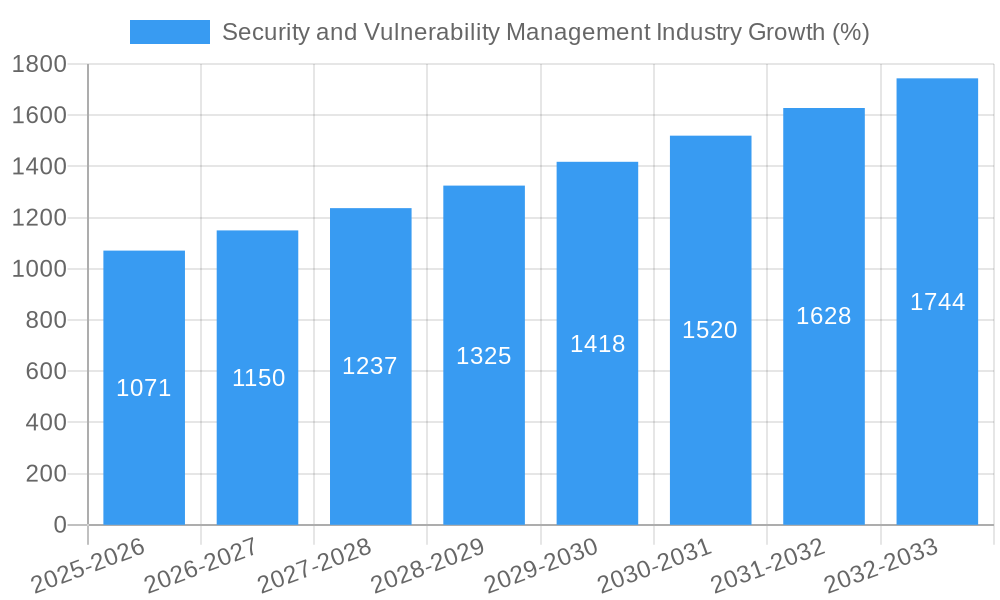
The Security and Vulnerability Management (SVM) market is experiencing robust growth, projected to reach $14.45 billion in 2025 and maintain a 7.50% Compound Annual Growth Rate (CAGR) through 2033. This expansion is fueled by several key factors. The increasing sophistication and frequency of cyberattacks targeting businesses of all sizes, from small and medium enterprises (SMEs) to large corporations across diverse sectors like BFSI, healthcare, and manufacturing, necessitate robust SVM solutions. The rising adoption of cloud computing and the Internet of Things (IoT) further expands the attack surface, driving demand for comprehensive vulnerability management platforms. Furthermore, stringent government regulations and industry compliance standards, such as GDPR and HIPAA, are compelling organizations to prioritize security and invest in advanced SVM technologies. Competitive pressures and the need to protect valuable intellectual property and customer data also contribute significantly to market growth.
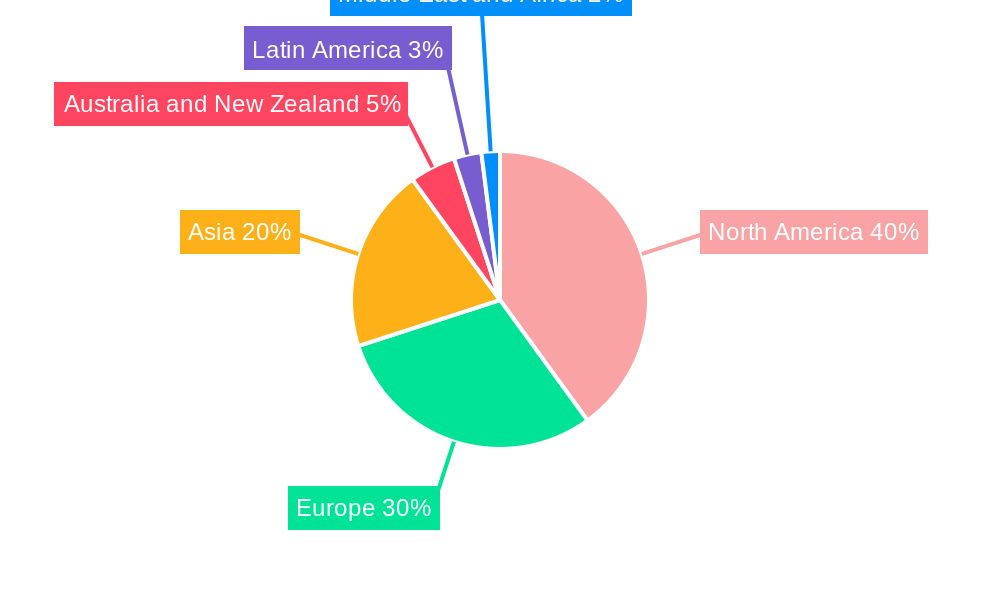
The SVM market is segmented by organization size (SMEs and large enterprises) and end-user vertical (Aerospace, Defense, and Intelligence; BFSI; Healthcare; Manufacturing; Retail; IT and Telecommunications; and Other). Large enterprises currently dominate the market due to their greater resources and higher risk profiles. However, increasing cyber threats to SMEs are fostering significant growth within this segment. Geographically, North America and Europe are expected to maintain substantial market shares, driven by early adoption of advanced technologies and stringent regulatory environments. However, Asia, particularly regions with rapidly developing digital infrastructure and economies, shows promising potential for future growth. Key players like Micro Focus, AlienVault, Skybox Security, Hewlett Packard Enterprise, Dell EMC, McAfee, Fujitsu, Rapid7, Qualys, Broadcom (Symantec), and Tripwire are actively shaping the competitive landscape through innovation, acquisitions, and strategic partnerships. Future market growth will likely be driven by advancements in artificial intelligence (AI) and machine learning (ML) for threat detection and response, as well as the integration of SVM solutions with broader cybersecurity ecosystems.
Security and Vulnerability Management Industry Market Report: 2019-2033
This comprehensive report provides a detailed analysis of the Security and Vulnerability Management industry, encompassing market size, segmentation, growth drivers, challenges, and key players. The study period covers 2019-2033, with 2025 as the base and estimated year. The forecast period is 2025-2033, and the historical period is 2019-2024. The report projects a market value exceeding $XX Million by 2033, exhibiting a CAGR of XX% during the forecast period.
Security and Vulnerability Management Industry Market Concentration & Innovation
The Security and Vulnerability Management market exhibits a moderately concentrated landscape, with several major players holding significant market share. Companies like Micro Focus International PLC, Alien Vault Inc, Skybox Security Inc, Hewlett Packard Enterprise Company, Dell EMC, McAfee Inc, Fujitsu Limited, Rapid7 Inc, Qualys Inc, Broadcom Inc (Symantec Corporation), and Tripwire Inc contribute significantly to the overall revenue. However, the market also features numerous smaller players and startups driving innovation.
Market share estimates for 2025 indicate that the top 5 players account for approximately XX% of the global market, while the remaining share is distributed among numerous smaller firms. M&A activity has been significant, with deal values exceeding $XX Million in the past five years, primarily driven by strategic acquisitions aimed at expanding product portfolios and enhancing technological capabilities. Innovation is fueled by continuous advancements in AI, machine learning, and cloud computing, which are enhancing vulnerability detection, threat response, and security automation. Regulatory frameworks like GDPR and CCPA are driving adoption, while the emergence of sophisticated cyberattacks and data breaches necessitates robust security solutions. Product substitutes are limited, mainly focused on open-source tools, but enterprise-grade solutions remain dominant. End-user trends reflect a growing preference for integrated security platforms and managed security services.
Security and Vulnerability Management Industry Industry Trends & Insights
The Security and Vulnerability Management market is experiencing robust growth, driven by several factors. The increasing adoption of cloud computing and IoT devices has expanded the attack surface, necessitating sophisticated security solutions. The rising frequency and severity of cyberattacks, coupled with stringent data privacy regulations, have compelled organizations to invest heavily in vulnerability management. This trend is further amplified by the growing awareness of the financial and reputational damage associated with security breaches. The market is witnessing a shift toward proactive security measures, with a focus on predictive analytics and automated threat response.
Technological disruptions such as AI, machine learning, and blockchain are revolutionizing the landscape, enabling more efficient vulnerability detection and mitigation. Consumer preferences are shifting toward integrated solutions that streamline security operations and provide comprehensive visibility across various platforms. Competitive dynamics are intense, with companies continuously innovating and expanding their product offerings to gain a competitive edge. The market is expected to grow at a CAGR of XX% between 2025 and 2033, with market penetration expected to reach XX% by 2033 in key sectors.
Dominant Markets & Segments in Security and Vulnerability Management Industry
The North American region currently holds the largest market share, driven by strong technological infrastructure, high adoption of advanced security solutions, and robust regulatory frameworks. Within the segmented analysis:
By Size of the Organization: Large enterprises represent the dominant segment, owing to their higher IT budgets and complex IT infrastructures. However, the SME segment is also demonstrating significant growth due to increasing cyber threats and cost-effective cloud-based solutions.
By End-user Vertical: The BFSI and healthcare sectors are prominent segments, driven by strict regulatory compliance requirements and the sensitive nature of their data. The aerospace, defense, and intelligence sectors also constitute significant markets due to the critical nature of their operations. Other end-user verticals, such as Manufacturing, Retail and IT & Telecommunication are also showing healthy growth due to increased digitization and connected devices.
Key Drivers:
- Economic policies supporting digital transformation and cybersecurity investments.
- Robust IT infrastructure facilitating the adoption of advanced security solutions.
- Stringent data privacy regulations mandating enhanced security measures.
Security and Vulnerability Management Industry Product Developments
Recent product innovations emphasize AI-powered vulnerability management, automated threat response, and integrated security platforms. Companies are focusing on developing solutions that provide comprehensive visibility across hybrid and multi-cloud environments. The key competitive advantages include ease of use, scalability, and seamless integration with existing IT infrastructure. The market is seeing a trend towards cloud-based and SaaS offerings, which offer greater flexibility and cost-effectiveness.
Report Scope & Segmentation Analysis
This report segments the Security and Vulnerability Management market by:
By Size of the Organization: Small and Medium Enterprises (SMEs) and Large Enterprises. The large enterprise segment exhibits higher growth due to complex infrastructures and increased budgets. SMEs are showing increased adoption due to cloud-based solutions.
By End-user Vertical: Aerospace, Defense, and Intelligence; BFSI; Healthcare; Manufacturing; Retail; IT and Telecommunication; and Other End-user Industries. Each vertical exhibits unique security needs and regulations, impacting market growth and competitive dynamics. Projected growth varies across these segments, with BFSI and Healthcare expected to maintain higher growth rates compared to others.
Key Drivers of Security and Vulnerability Management Industry Growth
Several factors contribute to the industry's growth. Technological advancements, particularly AI and machine learning, are enhancing vulnerability detection and threat response capabilities. The increasing prevalence of cyberattacks and data breaches necessitates robust security solutions. Stringent data privacy regulations, such as GDPR and CCPA, are mandating enhanced security measures across various industries. Furthermore, the growing adoption of cloud computing and IoT devices expands the attack surface, further boosting demand for security solutions.
Challenges in the Security and Vulnerability Management Industry Sector
The industry faces challenges such as the complexity of managing security across hybrid and multi-cloud environments. The evolving nature of cyber threats and the skills gap in cybersecurity professionals pose significant hurdles. Supply chain vulnerabilities can compromise security, requiring comprehensive risk management strategies. Intense competition among vendors puts pressure on pricing and margins. The estimated financial impact of these challenges is $XX Million annually.
Emerging Opportunities in Security and Vulnerability Management Industry
Emerging opportunities include the growing adoption of AI-powered security solutions, the expansion of the IoT security market, and the development of advanced threat intelligence capabilities. The increasing demand for managed security services (MSS) presents significant growth potential. The integration of security into DevOps and DevSecOps methodologies provides opportunities for vendors focused on automation and integration. New markets in developing economies present significant potential.
Leading Players in the Security and Vulnerability Management Industry Market
- Micro Focus International PLC
- Alien Vault Inc
- Skybox Security Inc
- Hewlett Packard Enterprise Company
- Dell EMC
- McAfee Inc
- Fujitsu Limited
- Rapid7 Inc
- Qualys Inc
- Broadcom Inc (Symantec Corporation)
- Tripwire Inc
Key Developments in Security and Vulnerability Management Industry Industry
June 2024: CrowdStrike's partnership with HPE and NVIDIA integrates cybersecurity and IT operations, accelerating AI innovation. This signifies a shift towards integrated security platforms.
September 2023: IBM enhances its Cloud Security and Compliance Center, strengthening hybrid multi-cloud security and compliance management, responding to evolving supply chain threats and global regulations. This reflects increased focus on risk management and compliance.
Strategic Outlook for Security and Vulnerability Management Industry Market
The Security and Vulnerability Management market is poised for continued strong growth driven by escalating cyber threats, increasing regulatory pressure, and the adoption of advanced technologies. The market will witness increased consolidation through M&A activity, with companies focusing on expanding their product portfolios and capabilities. The focus will be on solutions that seamlessly integrate with existing IT infrastructure, offer enhanced automation, and provide comprehensive visibility across hybrid and multi-cloud environments. The market holds significant potential for innovation and growth in the coming decade.
Security and Vulnerability Management Industry Segmentation
-
1. Size of the Organization
- 1.1. Small and Medium Enterprises
- 1.2. Large Enterprises
-
2. End-user Vertical
- 2.1. Aerospace, Defense, and Intelligence
- 2.2. BFSI
- 2.3. Healthcare
- 2.4. Manufacturing
- 2.5. Retail
- 2.6. IT and Telecommunication
- 2.7. Other End-user Industries
Security and Vulnerability Management Industry Segmentation By Geography
- 1. North America
- 2. Europe
- 3. Asia
- 4. Australia and New Zealand
- 5. Latin America
- 6. Middle East and Africa
Security and Vulnerability Management Industry REPORT HIGHLIGHTS
| Aspects | Details |
|---|---|
| Study Period | 2019-2033 |
| Base Year | 2024 |
| Estimated Year | 2025 |
| Forecast Period | 2025-2033 |
| Historical Period | 2019-2024 |
| Growth Rate | CAGR of 7.50% from 2019-2033 |
| Segmentation |
|
Table of Contents
- 1. Introduction
- 1.1. Research Scope
- 1.2. Market Segmentation
- 1.3. Research Methodology
- 1.4. Definitions and Assumptions
- 2. Executive Summary
- 2.1. Introduction
- 3. Market Dynamics
- 3.1. Introduction
- 3.2. Market Drivers
- 3.2.1. Increasing Number of Cyber Attacks; Growing Adoption of Cloud Computing by Enterprises
- 3.3. Market Restrains
- 3.3.1. Lack of Awareness Toward SVM Solutions; Scalability and Deployment Costs
- 3.4. Market Trends
- 3.4.1. BFSI Segment is Expected to Hold the Major Market Share
- 4. Market Factor Analysis
- 4.1. Porters Five Forces
- 4.2. Supply/Value Chain
- 4.3. PESTEL analysis
- 4.4. Market Entropy
- 4.5. Patent/Trademark Analysis
- 5. Global Security and Vulnerability Management Industry Analysis, Insights and Forecast, 2019-2031
- 5.1. Market Analysis, Insights and Forecast - by Size of the Organization
- 5.1.1. Small and Medium Enterprises
- 5.1.2. Large Enterprises
- 5.2. Market Analysis, Insights and Forecast - by End-user Vertical
- 5.2.1. Aerospace, Defense, and Intelligence
- 5.2.2. BFSI
- 5.2.3. Healthcare
- 5.2.4. Manufacturing
- 5.2.5. Retail
- 5.2.6. IT and Telecommunication
- 5.2.7. Other End-user Industries
- 5.3. Market Analysis, Insights and Forecast - by Region
- 5.3.1. North America
- 5.3.2. Europe
- 5.3.3. Asia
- 5.3.4. Australia and New Zealand
- 5.3.5. Latin America
- 5.3.6. Middle East and Africa
- 5.1. Market Analysis, Insights and Forecast - by Size of the Organization
- 6. North America Security and Vulnerability Management Industry Analysis, Insights and Forecast, 2019-2031
- 6.1. Market Analysis, Insights and Forecast - by Size of the Organization
- 6.1.1. Small and Medium Enterprises
- 6.1.2. Large Enterprises
- 6.2. Market Analysis, Insights and Forecast - by End-user Vertical
- 6.2.1. Aerospace, Defense, and Intelligence
- 6.2.2. BFSI
- 6.2.3. Healthcare
- 6.2.4. Manufacturing
- 6.2.5. Retail
- 6.2.6. IT and Telecommunication
- 6.2.7. Other End-user Industries
- 6.1. Market Analysis, Insights and Forecast - by Size of the Organization
- 7. Europe Security and Vulnerability Management Industry Analysis, Insights and Forecast, 2019-2031
- 7.1. Market Analysis, Insights and Forecast - by Size of the Organization
- 7.1.1. Small and Medium Enterprises
- 7.1.2. Large Enterprises
- 7.2. Market Analysis, Insights and Forecast - by End-user Vertical
- 7.2.1. Aerospace, Defense, and Intelligence
- 7.2.2. BFSI
- 7.2.3. Healthcare
- 7.2.4. Manufacturing
- 7.2.5. Retail
- 7.2.6. IT and Telecommunication
- 7.2.7. Other End-user Industries
- 7.1. Market Analysis, Insights and Forecast - by Size of the Organization
- 8. Asia Security and Vulnerability Management Industry Analysis, Insights and Forecast, 2019-2031
- 8.1. Market Analysis, Insights and Forecast - by Size of the Organization
- 8.1.1. Small and Medium Enterprises
- 8.1.2. Large Enterprises
- 8.2. Market Analysis, Insights and Forecast - by End-user Vertical
- 8.2.1. Aerospace, Defense, and Intelligence
- 8.2.2. BFSI
- 8.2.3. Healthcare
- 8.2.4. Manufacturing
- 8.2.5. Retail
- 8.2.6. IT and Telecommunication
- 8.2.7. Other End-user Industries
- 8.1. Market Analysis, Insights and Forecast - by Size of the Organization
- 9. Australia and New Zealand Security and Vulnerability Management Industry Analysis, Insights and Forecast, 2019-2031
- 9.1. Market Analysis, Insights and Forecast - by Size of the Organization
- 9.1.1. Small and Medium Enterprises
- 9.1.2. Large Enterprises
- 9.2. Market Analysis, Insights and Forecast - by End-user Vertical
- 9.2.1. Aerospace, Defense, and Intelligence
- 9.2.2. BFSI
- 9.2.3. Healthcare
- 9.2.4. Manufacturing
- 9.2.5. Retail
- 9.2.6. IT and Telecommunication
- 9.2.7. Other End-user Industries
- 9.1. Market Analysis, Insights and Forecast - by Size of the Organization
- 10. Latin America Security and Vulnerability Management Industry Analysis, Insights and Forecast, 2019-2031
- 10.1. Market Analysis, Insights and Forecast - by Size of the Organization
- 10.1.1. Small and Medium Enterprises
- 10.1.2. Large Enterprises
- 10.2. Market Analysis, Insights and Forecast - by End-user Vertical
- 10.2.1. Aerospace, Defense, and Intelligence
- 10.2.2. BFSI
- 10.2.3. Healthcare
- 10.2.4. Manufacturing
- 10.2.5. Retail
- 10.2.6. IT and Telecommunication
- 10.2.7. Other End-user Industries
- 10.1. Market Analysis, Insights and Forecast - by Size of the Organization
- 11. Middle East and Africa Security and Vulnerability Management Industry Analysis, Insights and Forecast, 2019-2031
- 11.1. Market Analysis, Insights and Forecast - by Size of the Organization
- 11.1.1. Small and Medium Enterprises
- 11.1.2. Large Enterprises
- 11.2. Market Analysis, Insights and Forecast - by End-user Vertical
- 11.2.1. Aerospace, Defense, and Intelligence
- 11.2.2. BFSI
- 11.2.3. Healthcare
- 11.2.4. Manufacturing
- 11.2.5. Retail
- 11.2.6. IT and Telecommunication
- 11.2.7. Other End-user Industries
- 11.1. Market Analysis, Insights and Forecast - by Size of the Organization
- 12. North America Security and Vulnerability Management Industry Analysis, Insights and Forecast, 2019-2031
- 12.1. Market Analysis, Insights and Forecast - By Country/Sub-region
- 12.1.1.
- 13. Europe Security and Vulnerability Management Industry Analysis, Insights and Forecast, 2019-2031
- 13.1. Market Analysis, Insights and Forecast - By Country/Sub-region
- 13.1.1.
- 14. Asia Security and Vulnerability Management Industry Analysis, Insights and Forecast, 2019-2031
- 14.1. Market Analysis, Insights and Forecast - By Country/Sub-region
- 14.1.1.
- 15. Australia and New Zealand Security and Vulnerability Management Industry Analysis, Insights and Forecast, 2019-2031
- 15.1. Market Analysis, Insights and Forecast - By Country/Sub-region
- 15.1.1.
- 16. Latin America Security and Vulnerability Management Industry Analysis, Insights and Forecast, 2019-2031
- 16.1. Market Analysis, Insights and Forecast - By Country/Sub-region
- 16.1.1.
- 17. Middle East and Africa Security and Vulnerability Management Industry Analysis, Insights and Forecast, 2019-2031
- 17.1. Market Analysis, Insights and Forecast - By Country/Sub-region
- 17.1.1.
- 18. Competitive Analysis
- 18.1. Global Market Share Analysis 2024
- 18.2. Company Profiles
- 18.2.1 Micro Focus International PLC
- 18.2.1.1. Overview
- 18.2.1.2. Products
- 18.2.1.3. SWOT Analysis
- 18.2.1.4. Recent Developments
- 18.2.1.5. Financials (Based on Availability)
- 18.2.2 Alien Vault Inc
- 18.2.2.1. Overview
- 18.2.2.2. Products
- 18.2.2.3. SWOT Analysis
- 18.2.2.4. Recent Developments
- 18.2.2.5. Financials (Based on Availability)
- 18.2.3 Skybox Security Inc *List Not Exhaustive
- 18.2.3.1. Overview
- 18.2.3.2. Products
- 18.2.3.3. SWOT Analysis
- 18.2.3.4. Recent Developments
- 18.2.3.5. Financials (Based on Availability)
- 18.2.4 Hewlett Packard Enterprise Company
- 18.2.4.1. Overview
- 18.2.4.2. Products
- 18.2.4.3. SWOT Analysis
- 18.2.4.4. Recent Developments
- 18.2.4.5. Financials (Based on Availability)
- 18.2.5 Dell EMC
- 18.2.5.1. Overview
- 18.2.5.2. Products
- 18.2.5.3. SWOT Analysis
- 18.2.5.4. Recent Developments
- 18.2.5.5. Financials (Based on Availability)
- 18.2.6 McAfee Inc
- 18.2.6.1. Overview
- 18.2.6.2. Products
- 18.2.6.3. SWOT Analysis
- 18.2.6.4. Recent Developments
- 18.2.6.5. Financials (Based on Availability)
- 18.2.7 Fujitsu Limited
- 18.2.7.1. Overview
- 18.2.7.2. Products
- 18.2.7.3. SWOT Analysis
- 18.2.7.4. Recent Developments
- 18.2.7.5. Financials (Based on Availability)
- 18.2.8 Rapid7 Inc
- 18.2.8.1. Overview
- 18.2.8.2. Products
- 18.2.8.3. SWOT Analysis
- 18.2.8.4. Recent Developments
- 18.2.8.5. Financials (Based on Availability)
- 18.2.9 Qualys Inc
- 18.2.9.1. Overview
- 18.2.9.2. Products
- 18.2.9.3. SWOT Analysis
- 18.2.9.4. Recent Developments
- 18.2.9.5. Financials (Based on Availability)
- 18.2.10 Broadcom Inc (Symantec Corporation)
- 18.2.10.1. Overview
- 18.2.10.2. Products
- 18.2.10.3. SWOT Analysis
- 18.2.10.4. Recent Developments
- 18.2.10.5. Financials (Based on Availability)
- 18.2.11 Tripwire Inc
- 18.2.11.1. Overview
- 18.2.11.2. Products
- 18.2.11.3. SWOT Analysis
- 18.2.11.4. Recent Developments
- 18.2.11.5. Financials (Based on Availability)
- 18.2.1 Micro Focus International PLC
List of Figures
- Figure 1: Global Security and Vulnerability Management Industry Revenue Breakdown (Million, %) by Region 2024 & 2032
- Figure 2: North America Security and Vulnerability Management Industry Revenue (Million), by Country 2024 & 2032
- Figure 3: North America Security and Vulnerability Management Industry Revenue Share (%), by Country 2024 & 2032
- Figure 4: Europe Security and Vulnerability Management Industry Revenue (Million), by Country 2024 & 2032
- Figure 5: Europe Security and Vulnerability Management Industry Revenue Share (%), by Country 2024 & 2032
- Figure 6: Asia Security and Vulnerability Management Industry Revenue (Million), by Country 2024 & 2032
- Figure 7: Asia Security and Vulnerability Management Industry Revenue Share (%), by Country 2024 & 2032
- Figure 8: Australia and New Zealand Security and Vulnerability Management Industry Revenue (Million), by Country 2024 & 2032
- Figure 9: Australia and New Zealand Security and Vulnerability Management Industry Revenue Share (%), by Country 2024 & 2032
- Figure 10: Latin America Security and Vulnerability Management Industry Revenue (Million), by Country 2024 & 2032
- Figure 11: Latin America Security and Vulnerability Management Industry Revenue Share (%), by Country 2024 & 2032
- Figure 12: Middle East and Africa Security and Vulnerability Management Industry Revenue (Million), by Country 2024 & 2032
- Figure 13: Middle East and Africa Security and Vulnerability Management Industry Revenue Share (%), by Country 2024 & 2032
- Figure 14: North America Security and Vulnerability Management Industry Revenue (Million), by Size of the Organization 2024 & 2032
- Figure 15: North America Security and Vulnerability Management Industry Revenue Share (%), by Size of the Organization 2024 & 2032
- Figure 16: North America Security and Vulnerability Management Industry Revenue (Million), by End-user Vertical 2024 & 2032
- Figure 17: North America Security and Vulnerability Management Industry Revenue Share (%), by End-user Vertical 2024 & 2032
- Figure 18: North America Security and Vulnerability Management Industry Revenue (Million), by Country 2024 & 2032
- Figure 19: North America Security and Vulnerability Management Industry Revenue Share (%), by Country 2024 & 2032
- Figure 20: Europe Security and Vulnerability Management Industry Revenue (Million), by Size of the Organization 2024 & 2032
- Figure 21: Europe Security and Vulnerability Management Industry Revenue Share (%), by Size of the Organization 2024 & 2032
- Figure 22: Europe Security and Vulnerability Management Industry Revenue (Million), by End-user Vertical 2024 & 2032
- Figure 23: Europe Security and Vulnerability Management Industry Revenue Share (%), by End-user Vertical 2024 & 2032
- Figure 24: Europe Security and Vulnerability Management Industry Revenue (Million), by Country 2024 & 2032
- Figure 25: Europe Security and Vulnerability Management Industry Revenue Share (%), by Country 2024 & 2032
- Figure 26: Asia Security and Vulnerability Management Industry Revenue (Million), by Size of the Organization 2024 & 2032
- Figure 27: Asia Security and Vulnerability Management Industry Revenue Share (%), by Size of the Organization 2024 & 2032
- Figure 28: Asia Security and Vulnerability Management Industry Revenue (Million), by End-user Vertical 2024 & 2032
- Figure 29: Asia Security and Vulnerability Management Industry Revenue Share (%), by End-user Vertical 2024 & 2032
- Figure 30: Asia Security and Vulnerability Management Industry Revenue (Million), by Country 2024 & 2032
- Figure 31: Asia Security and Vulnerability Management Industry Revenue Share (%), by Country 2024 & 2032
- Figure 32: Australia and New Zealand Security and Vulnerability Management Industry Revenue (Million), by Size of the Organization 2024 & 2032
- Figure 33: Australia and New Zealand Security and Vulnerability Management Industry Revenue Share (%), by Size of the Organization 2024 & 2032
- Figure 34: Australia and New Zealand Security and Vulnerability Management Industry Revenue (Million), by End-user Vertical 2024 & 2032
- Figure 35: Australia and New Zealand Security and Vulnerability Management Industry Revenue Share (%), by End-user Vertical 2024 & 2032
- Figure 36: Australia and New Zealand Security and Vulnerability Management Industry Revenue (Million), by Country 2024 & 2032
- Figure 37: Australia and New Zealand Security and Vulnerability Management Industry Revenue Share (%), by Country 2024 & 2032
- Figure 38: Latin America Security and Vulnerability Management Industry Revenue (Million), by Size of the Organization 2024 & 2032
- Figure 39: Latin America Security and Vulnerability Management Industry Revenue Share (%), by Size of the Organization 2024 & 2032
- Figure 40: Latin America Security and Vulnerability Management Industry Revenue (Million), by End-user Vertical 2024 & 2032
- Figure 41: Latin America Security and Vulnerability Management Industry Revenue Share (%), by End-user Vertical 2024 & 2032
- Figure 42: Latin America Security and Vulnerability Management Industry Revenue (Million), by Country 2024 & 2032
- Figure 43: Latin America Security and Vulnerability Management Industry Revenue Share (%), by Country 2024 & 2032
- Figure 44: Middle East and Africa Security and Vulnerability Management Industry Revenue (Million), by Size of the Organization 2024 & 2032
- Figure 45: Middle East and Africa Security and Vulnerability Management Industry Revenue Share (%), by Size of the Organization 2024 & 2032
- Figure 46: Middle East and Africa Security and Vulnerability Management Industry Revenue (Million), by End-user Vertical 2024 & 2032
- Figure 47: Middle East and Africa Security and Vulnerability Management Industry Revenue Share (%), by End-user Vertical 2024 & 2032
- Figure 48: Middle East and Africa Security and Vulnerability Management Industry Revenue (Million), by Country 2024 & 2032
- Figure 49: Middle East and Africa Security and Vulnerability Management Industry Revenue Share (%), by Country 2024 & 2032
List of Tables
- Table 1: Global Security and Vulnerability Management Industry Revenue Million Forecast, by Region 2019 & 2032
- Table 2: Global Security and Vulnerability Management Industry Revenue Million Forecast, by Size of the Organization 2019 & 2032
- Table 3: Global Security and Vulnerability Management Industry Revenue Million Forecast, by End-user Vertical 2019 & 2032
- Table 4: Global Security and Vulnerability Management Industry Revenue Million Forecast, by Region 2019 & 2032
- Table 5: Global Security and Vulnerability Management Industry Revenue Million Forecast, by Country 2019 & 2032
- Table 6: Security and Vulnerability Management Industry Revenue (Million) Forecast, by Application 2019 & 2032
- Table 7: Global Security and Vulnerability Management Industry Revenue Million Forecast, by Country 2019 & 2032
- Table 8: Security and Vulnerability Management Industry Revenue (Million) Forecast, by Application 2019 & 2032
- Table 9: Global Security and Vulnerability Management Industry Revenue Million Forecast, by Country 2019 & 2032
- Table 10: Security and Vulnerability Management Industry Revenue (Million) Forecast, by Application 2019 & 2032
- Table 11: Global Security and Vulnerability Management Industry Revenue Million Forecast, by Country 2019 & 2032
- Table 12: Security and Vulnerability Management Industry Revenue (Million) Forecast, by Application 2019 & 2032
- Table 13: Global Security and Vulnerability Management Industry Revenue Million Forecast, by Country 2019 & 2032
- Table 14: Security and Vulnerability Management Industry Revenue (Million) Forecast, by Application 2019 & 2032
- Table 15: Global Security and Vulnerability Management Industry Revenue Million Forecast, by Country 2019 & 2032
- Table 16: Security and Vulnerability Management Industry Revenue (Million) Forecast, by Application 2019 & 2032
- Table 17: Global Security and Vulnerability Management Industry Revenue Million Forecast, by Size of the Organization 2019 & 2032
- Table 18: Global Security and Vulnerability Management Industry Revenue Million Forecast, by End-user Vertical 2019 & 2032
- Table 19: Global Security and Vulnerability Management Industry Revenue Million Forecast, by Country 2019 & 2032
- Table 20: Global Security and Vulnerability Management Industry Revenue Million Forecast, by Size of the Organization 2019 & 2032
- Table 21: Global Security and Vulnerability Management Industry Revenue Million Forecast, by End-user Vertical 2019 & 2032
- Table 22: Global Security and Vulnerability Management Industry Revenue Million Forecast, by Country 2019 & 2032
- Table 23: Global Security and Vulnerability Management Industry Revenue Million Forecast, by Size of the Organization 2019 & 2032
- Table 24: Global Security and Vulnerability Management Industry Revenue Million Forecast, by End-user Vertical 2019 & 2032
- Table 25: Global Security and Vulnerability Management Industry Revenue Million Forecast, by Country 2019 & 2032
- Table 26: Global Security and Vulnerability Management Industry Revenue Million Forecast, by Size of the Organization 2019 & 2032
- Table 27: Global Security and Vulnerability Management Industry Revenue Million Forecast, by End-user Vertical 2019 & 2032
- Table 28: Global Security and Vulnerability Management Industry Revenue Million Forecast, by Country 2019 & 2032
- Table 29: Global Security and Vulnerability Management Industry Revenue Million Forecast, by Size of the Organization 2019 & 2032
- Table 30: Global Security and Vulnerability Management Industry Revenue Million Forecast, by End-user Vertical 2019 & 2032
- Table 31: Global Security and Vulnerability Management Industry Revenue Million Forecast, by Country 2019 & 2032
- Table 32: Global Security and Vulnerability Management Industry Revenue Million Forecast, by Size of the Organization 2019 & 2032
- Table 33: Global Security and Vulnerability Management Industry Revenue Million Forecast, by End-user Vertical 2019 & 2032
- Table 34: Global Security and Vulnerability Management Industry Revenue Million Forecast, by Country 2019 & 2032
Frequently Asked Questions
1. What is the projected Compound Annual Growth Rate (CAGR) of the Security and Vulnerability Management Industry?
The projected CAGR is approximately 7.50%.
2. Which companies are prominent players in the Security and Vulnerability Management Industry?
Key companies in the market include Micro Focus International PLC, Alien Vault Inc, Skybox Security Inc *List Not Exhaustive, Hewlett Packard Enterprise Company, Dell EMC, McAfee Inc, Fujitsu Limited, Rapid7 Inc, Qualys Inc, Broadcom Inc (Symantec Corporation), Tripwire Inc.
3. What are the main segments of the Security and Vulnerability Management Industry?
The market segments include Size of the Organization, End-user Vertical.
4. Can you provide details about the market size?
The market size is estimated to be USD 14.45 Million as of 2022.
5. What are some drivers contributing to market growth?
Increasing Number of Cyber Attacks; Growing Adoption of Cloud Computing by Enterprises.
6. What are the notable trends driving market growth?
BFSI Segment is Expected to Hold the Major Market Share.
7. Are there any restraints impacting market growth?
Lack of Awareness Toward SVM Solutions; Scalability and Deployment Costs.
8. Can you provide examples of recent developments in the market?
June 2024 - CrowdStrike has announced a strategic partnership with HPE innovation, including large language models (LLMs), accelerated by NVIDIA, With the integration of the CrowdStrike Falcon Cyber security platform and HPE GreenLake cloud and OpsRamp AIOps, organizations can seamlessly unify IT operations and cybersecurity in a single, unified process to securely accelerate AI innovation.
9. What pricing options are available for accessing the report?
Pricing options include single-user, multi-user, and enterprise licenses priced at USD 4750, USD 5250, and USD 8750 respectively.
10. Is the market size provided in terms of value or volume?
The market size is provided in terms of value, measured in Million.
11. Are there any specific market keywords associated with the report?
Yes, the market keyword associated with the report is "Security and Vulnerability Management Industry," which aids in identifying and referencing the specific market segment covered.
12. How do I determine which pricing option suits my needs best?
The pricing options vary based on user requirements and access needs. Individual users may opt for single-user licenses, while businesses requiring broader access may choose multi-user or enterprise licenses for cost-effective access to the report.
13. Are there any additional resources or data provided in the Security and Vulnerability Management Industry report?
While the report offers comprehensive insights, it's advisable to review the specific contents or supplementary materials provided to ascertain if additional resources or data are available.
14. How can I stay updated on further developments or reports in the Security and Vulnerability Management Industry?
To stay informed about further developments, trends, and reports in the Security and Vulnerability Management Industry, consider subscribing to industry newsletters, following relevant companies and organizations, or regularly checking reputable industry news sources and publications.
Methodology
Step 1 - Identification of Relevant Samples Size from Population Database


Step 2 - Approaches for Defining Global Market Size (Value, Volume* & Price*)

Note*: In applicable scenarios
Step 3 - Data Sources
Primary Research
- Web Analytics
- Survey Reports
- Research Institute
- Latest Research Reports
- Opinion Leaders
Secondary Research
- Annual Reports
- White Paper
- Latest Press Release
- Industry Association
- Paid Database
- Investor Presentations

Step 4 - Data Triangulation
Involves using different sources of information in order to increase the validity of a study
These sources are likely to be stakeholders in a program - participants, other researchers, program staff, other community members, and so on.
Then we put all data in single framework & apply various statistical tools to find out the dynamic on the market.
During the analysis stage, feedback from the stakeholder groups would be compared to determine areas of agreement as well as areas of divergence


