
Key Insights
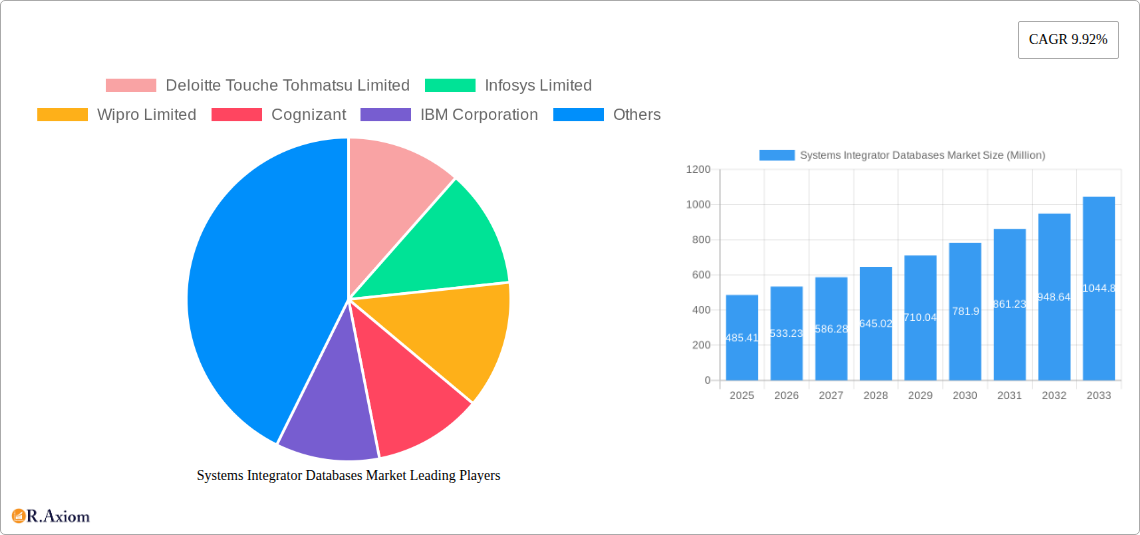
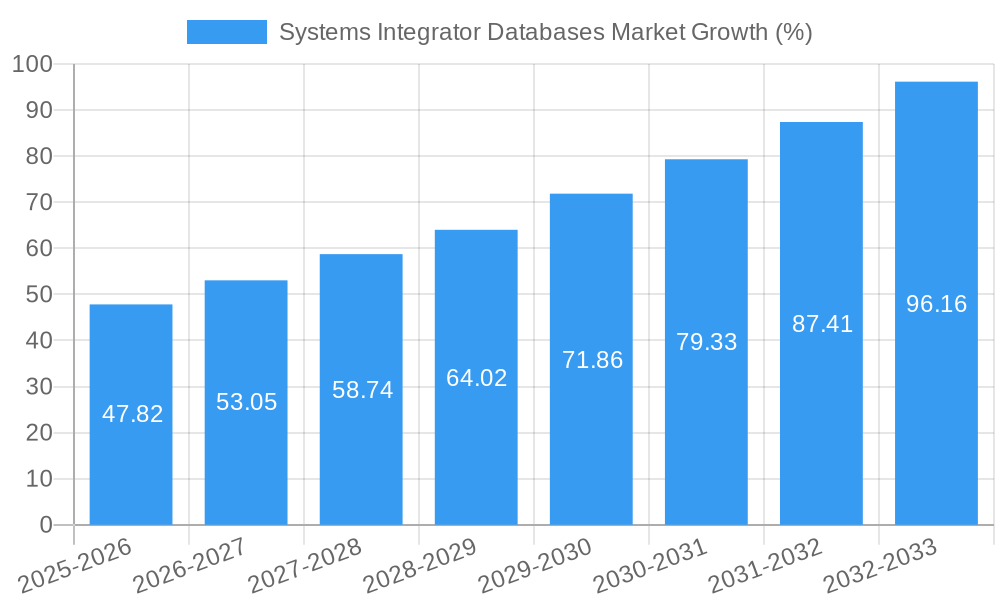
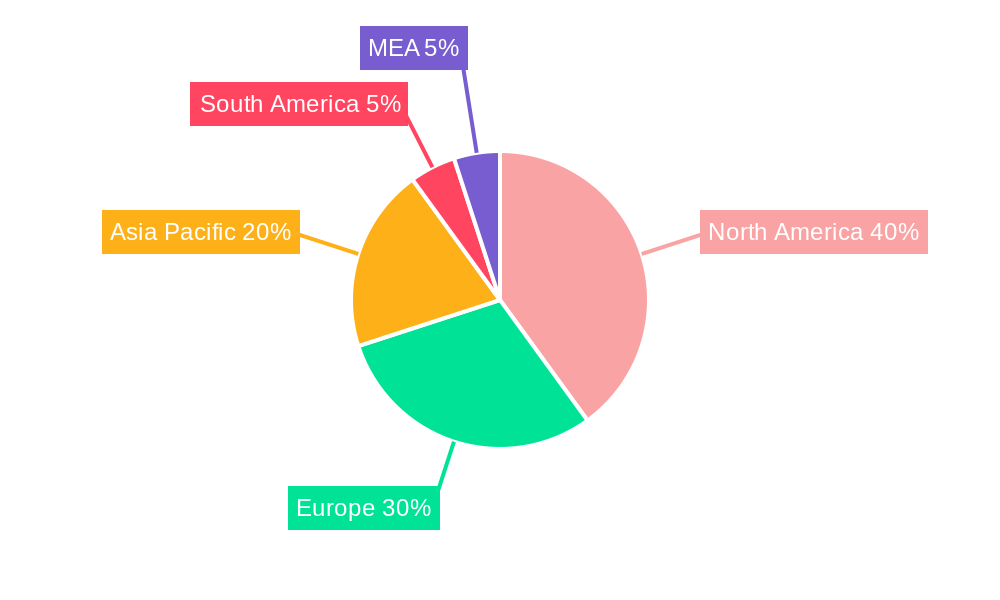
The Systems Integrator Databases market, valued at $485.41 million in 2025, is projected to experience robust growth, driven by the increasing adoption of cloud-based systems, the expanding need for data-driven decision-making across various industries, and the rising complexity of IT infrastructure requiring specialized integration expertise. This market is segmented by service type (Infrastructure Integration, Software/Application Integration, and Consulting) and end-user industry (Automotive, Aerospace & Defense, IT & Telecom, BFSI, Healthcare, Oil & Gas, and Others). The strong CAGR of 9.92% indicates significant future potential, fueled by the digital transformation initiatives undertaken by businesses globally. North America, with its advanced technological infrastructure and high adoption rate of integrated systems, is expected to maintain a substantial market share. However, growth in Asia-Pacific is predicted to be even faster, driven by rapid technological advancement and increasing digitalization across emerging economies such as India and China. Key players like Deloitte, Infosys, Wipro, and IBM are leveraging their expertise in integration and consulting to capture market share. Competitive pressures will likely increase as smaller, specialized firms emerge offering niche integration solutions. The market’s growth is, however, subject to restraints such as high integration costs, the need for skilled professionals, and concerns about data security and compliance.
The forecast period (2025-2033) anticipates continued expansion, with the market size exceeding $1 billion by 2033. This growth trajectory will be significantly influenced by factors such as the rising adoption of advanced analytics and artificial intelligence, which necessitates sophisticated database integration solutions. The increasing prevalence of hybrid cloud environments also presents opportunities for systems integrators to provide specialized services. Furthermore, the ongoing consolidation in the IT sector may lead to both challenges and opportunities for the systems integrator databases market. Larger firms with broader capabilities are likely to gain a competitive advantage, while smaller firms will need to focus on specialized niches or regional markets. The continued evolution of data privacy regulations across different geographies will also necessitate enhanced security features and compliance measures in database integration solutions, impacting market growth and investment strategies.
Systems Integrator Databases Market: A Comprehensive Report (2019-2033)
This detailed report provides a comprehensive analysis of the Systems Integrator Databases Market, offering actionable insights for stakeholders across the value chain. The study covers the period from 2019 to 2033, with 2025 as the base and estimated year. The report forecasts market trends from 2025 to 2033, based on historical data from 2019 to 2024. The market is segmented by service type (Infrastructure Integration, Software/Application Integration, Consulting) and end-user industry (Automotive, Aerospace and Defense, IT and Telecom, BFSI, Healthcare, Oil and Gas, Others). Key players analyzed include Deloitte Touche Tohmatsu Limited, Infosys Limited, Wipro Limited, Cognizant, IBM Corporation, MDS Systems Integration (MDS SI), BAE systems, Accenture, Tata Consultancy Services Limited, and Oracle Corporation. The report's total market size in 2025 is estimated at xx Million, with a projected xx% CAGR during the forecast period.
Systems Integrator Databases Market Concentration & Innovation
The Systems Integrator Databases market exhibits a moderately concentrated landscape, with a few major players holding significant market share. Deloitte, IBM, and Accenture collectively account for an estimated xx% of the market in 2025. However, several mid-sized and niche players are actively innovating, driving competitive intensity.
- Market Share: Top 5 players hold approximately xx% market share in 2025.
- Innovation Drivers: Rising demand for cloud-based solutions, increasing adoption of AI and machine learning, and the need for seamless data integration are key innovation drivers.
- Regulatory Frameworks: Compliance with data privacy regulations (e.g., GDPR, CCPA) is shaping market dynamics, prompting the development of secure and compliant solutions.
- Product Substitutes: Open-source databases and cloud-native platforms pose a competitive threat to traditional systems integrators.
- End-User Trends: Organizations increasingly prioritize data-driven decision-making, fueling demand for sophisticated data integration and management capabilities.
- M&A Activities: The market has witnessed several M&A activities in recent years, with deal values totaling xx Million in 2024. These deals primarily focused on expanding capabilities and market reach.
Systems Integrator Databases Market Industry Trends & Insights
The Systems Integrator Databases market is experiencing robust growth, driven by several factors. The increasing adoption of cloud computing, the proliferation of big data, and the growing demand for data-driven decision-making are key growth drivers. Technological disruptions, such as the emergence of AI and machine learning, are revolutionizing data integration and management practices. Consumer preferences are shifting towards flexible and scalable solutions that can adapt to evolving business needs. The competitive landscape is characterized by intense rivalry among established players and emerging startups. The market's CAGR is projected at xx% from 2025 to 2033, indicating significant growth potential. Market penetration is currently estimated at xx% and is expected to increase to xx% by 2033, driven by increased adoption across diverse end-user industries. Furthermore, the rise of the metaverse, as exemplified by NVIDIA's Omniverse Cloud launch, presents a significant new avenue for growth in specialized systems integration.
Dominant Markets & Segments in Systems Integrator Databases Market
The North American region currently dominates the Systems Integrator Databases market, followed by Europe and Asia-Pacific. Within the segments:
By Service Type: Software/Application Integration holds the largest market share, driven by the increasing complexity of enterprise software landscapes. Consulting services are also experiencing significant growth as businesses seek expertise in optimizing their data management strategies. Infrastructure integration remains important, particularly for legacy system modernization.
By End-user Industry: The BFSI and IT & Telecom sectors are major consumers of systems integration services, due to their dependence on robust and secure data management. The automotive sector is also witnessing rapid growth due to the rise of connected vehicles and autonomous driving technologies. The aerospace and defense sectors show steady growth due to the need for highly secure data management systems. Healthcare is experiencing rapid growth due to increasing data volume, and the oil and gas sector is showing steady growth driven by digital transformation initiatives. Other industries (Energy, Chemical, Mining) contribute a smaller but growing market segment.
Key Drivers for Dominant Segments:
- BFSI: Stringent regulatory compliance and the need for fraud detection and prevention.
- IT & Telecom: High volume of data transactions and the need for reliable network infrastructure.
- Automotive: Growing demand for connected vehicles, autonomous driving technologies, and data analytics.
Systems Integrator Databases Market Product Developments
Recent product innovations focus on enhancing data integration capabilities, improving security and compliance features, and streamlining deployment processes. The market is witnessing a shift toward cloud-based solutions, AI-powered analytics, and real-time data processing capabilities. These advancements offer competitive advantages by providing enhanced efficiency, scalability, and security. The integration of advanced technologies such as AI/ML into database systems is enhancing data management and integration, leading to improved efficiency and reduced operational costs.
Report Scope & Segmentation Analysis
This report segments the Systems Integrator Databases market by service type (Infrastructure Integration, Software/Application Integration, Consulting) and end-user industry (Automotive, Aerospace & Defense, IT & Telecom, BFSI, Healthcare, Oil & Gas, Others). Each segment's analysis includes growth projections, market size estimates, and competitive landscape assessments. The market size for each segment is projected to grow significantly over the forecast period, reflecting the increasing demand for sophisticated data integration and management capabilities across various industries. Competitive dynamics within each segment are shaped by factors like technological innovation, pricing strategies, and market penetration.
Key Drivers of Systems Integrator Databases Market Growth
The Systems Integrator Databases market is experiencing growth due to several factors: the increasing adoption of cloud computing, offering scalability and cost efficiency; the exponential growth of big data, necessitating robust data management solutions; the growing demand for data analytics and AI-powered insights, requiring sophisticated data integration; and the increasing focus on data security and compliance, demanding secure and compliant integration solutions. Furthermore, government initiatives promoting digital transformation across various sectors further fuel market expansion.
Challenges in the Systems Integrator Databases Market Sector
The market faces challenges including the complexity of integrating diverse data sources, the need for skilled professionals to manage and maintain complex systems, increasing cybersecurity threats, and the need to comply with stringent data privacy regulations, such as GDPR and CCPA. These factors can significantly impact project costs and timelines, influencing customer choices and investment decisions. Supply chain disruptions and global economic uncertainties can also impact the market's growth trajectory.
Emerging Opportunities in Systems Integrator Databases Market
Emerging opportunities exist in the integration of IoT devices, increasing demand for real-time data processing, the growth of edge computing, and the expansion into new and developing markets. The rising adoption of AI-powered analytics, creating possibilities for predictive maintenance and business optimization, presents significant potential. The continued demand for improved cybersecurity and compliance solutions offers opportunities for innovative security platforms.
Leading Players in the Systems Integrator Databases Market
- Deloitte Touche Tohmatsu Limited
- Infosys Limited
- Wipro Limited
- Cognizant
- IBM Corporation
- MDS Systems Integration (MDS SI)
- BAE systems
- Accenture
- Tata Consultancy Services Limited
- Oracle Corporation
Key Developments in Systems Integrator Databases Market Industry
- April 2022: Mercedes-Benz opened its Electric Software Hub, highlighting the growing importance of software integration in the automotive industry.
- September 2022: NVIDIA launched NVIDIA Omniverse Cloud, signifying the expansion of cloud-based systems integration solutions and the growing importance of the metaverse.
Strategic Outlook for Systems Integrator Databases Market Market
The Systems Integrator Databases market is poised for continued growth, driven by ongoing technological advancements, increasing data volumes, and growing demand for data-driven decision-making across various sectors. The market's future potential hinges on the ability of key players to adapt to evolving technological trends, maintain robust cybersecurity measures, and meet the rising demand for innovative and scalable solutions. Opportunities exist in specialized vertical markets and in leveraging emerging technologies such as AI/ML and edge computing to enhance data integration capabilities.
Systems Integrator Databases Market Segmentation
-
1. Service Type
- 1.1. Infrastructure Integration
- 1.2. Software/Application Integration
- 1.3. Consulting
-
2. End-user Industry
- 2.1. Automotive
- 2.2. Aerospace and Defense
- 2.3. IT and Telecom
- 2.4. BFSI
- 2.5. Healthcare
- 2.6. Oil and Gas
- 2.7. Others (Energy, Chemical, Mining etc.)
Systems Integrator Databases Market Segmentation By Geography
-
1. North America
- 1.1. United States
- 1.2. Canada
-
2. Europe
- 2.1. Germany
- 2.2. France
- 2.3. United Kingdom
-
3. Asia
- 3.1. India
- 3.2. China
- 3.3. Japan
- 4. Australia and New Zealand
- 5. Latin America
- 6. Middle East and Africa
Systems Integrator Databases Market REPORT HIGHLIGHTS
| Aspects | Details |
|---|---|
| Study Period | 2019-2033 |
| Base Year | 2024 |
| Estimated Year | 2025 |
| Forecast Period | 2025-2033 |
| Historical Period | 2019-2024 |
| Growth Rate | CAGR of 9.92% from 2019-2033 |
| Segmentation |
|
Table of Contents
- 1. Introduction
- 1.1. Research Scope
- 1.2. Market Segmentation
- 1.3. Research Methodology
- 1.4. Definitions and Assumptions
- 2. Executive Summary
- 2.1. Introduction
- 3. Market Dynamics
- 3.1. Introduction
- 3.2. Market Drivers
- 3.2.1. Advancements and adoption of cloud-technologies; Benefits of increasing productivity while reducing IT Management cost
- 3.3. Market Restrains
- 3.3.1. Inability of Service Providers to Provide Real-time Insights
- 3.4. Market Trends
- 3.4.1. Software/Application Integration to have a Significant Growth
- 4. Market Factor Analysis
- 4.1. Porters Five Forces
- 4.2. Supply/Value Chain
- 4.3. PESTEL analysis
- 4.4. Market Entropy
- 4.5. Patent/Trademark Analysis
- 5. Global Systems Integrator Databases Market Analysis, Insights and Forecast, 2019-2031
- 5.1. Market Analysis, Insights and Forecast - by Service Type
- 5.1.1. Infrastructure Integration
- 5.1.2. Software/Application Integration
- 5.1.3. Consulting
- 5.2. Market Analysis, Insights and Forecast - by End-user Industry
- 5.2.1. Automotive
- 5.2.2. Aerospace and Defense
- 5.2.3. IT and Telecom
- 5.2.4. BFSI
- 5.2.5. Healthcare
- 5.2.6. Oil and Gas
- 5.2.7. Others (Energy, Chemical, Mining etc.)
- 5.3. Market Analysis, Insights and Forecast - by Region
- 5.3.1. North America
- 5.3.2. Europe
- 5.3.3. Asia
- 5.3.4. Australia and New Zealand
- 5.3.5. Latin America
- 5.3.6. Middle East and Africa
- 5.1. Market Analysis, Insights and Forecast - by Service Type
- 6. North America Systems Integrator Databases Market Analysis, Insights and Forecast, 2019-2031
- 6.1. Market Analysis, Insights and Forecast - by Service Type
- 6.1.1. Infrastructure Integration
- 6.1.2. Software/Application Integration
- 6.1.3. Consulting
- 6.2. Market Analysis, Insights and Forecast - by End-user Industry
- 6.2.1. Automotive
- 6.2.2. Aerospace and Defense
- 6.2.3. IT and Telecom
- 6.2.4. BFSI
- 6.2.5. Healthcare
- 6.2.6. Oil and Gas
- 6.2.7. Others (Energy, Chemical, Mining etc.)
- 6.1. Market Analysis, Insights and Forecast - by Service Type
- 7. Europe Systems Integrator Databases Market Analysis, Insights and Forecast, 2019-2031
- 7.1. Market Analysis, Insights and Forecast - by Service Type
- 7.1.1. Infrastructure Integration
- 7.1.2. Software/Application Integration
- 7.1.3. Consulting
- 7.2. Market Analysis, Insights and Forecast - by End-user Industry
- 7.2.1. Automotive
- 7.2.2. Aerospace and Defense
- 7.2.3. IT and Telecom
- 7.2.4. BFSI
- 7.2.5. Healthcare
- 7.2.6. Oil and Gas
- 7.2.7. Others (Energy, Chemical, Mining etc.)
- 7.1. Market Analysis, Insights and Forecast - by Service Type
- 8. Asia Systems Integrator Databases Market Analysis, Insights and Forecast, 2019-2031
- 8.1. Market Analysis, Insights and Forecast - by Service Type
- 8.1.1. Infrastructure Integration
- 8.1.2. Software/Application Integration
- 8.1.3. Consulting
- 8.2. Market Analysis, Insights and Forecast - by End-user Industry
- 8.2.1. Automotive
- 8.2.2. Aerospace and Defense
- 8.2.3. IT and Telecom
- 8.2.4. BFSI
- 8.2.5. Healthcare
- 8.2.6. Oil and Gas
- 8.2.7. Others (Energy, Chemical, Mining etc.)
- 8.1. Market Analysis, Insights and Forecast - by Service Type
- 9. Australia and New Zealand Systems Integrator Databases Market Analysis, Insights and Forecast, 2019-2031
- 9.1. Market Analysis, Insights and Forecast - by Service Type
- 9.1.1. Infrastructure Integration
- 9.1.2. Software/Application Integration
- 9.1.3. Consulting
- 9.2. Market Analysis, Insights and Forecast - by End-user Industry
- 9.2.1. Automotive
- 9.2.2. Aerospace and Defense
- 9.2.3. IT and Telecom
- 9.2.4. BFSI
- 9.2.5. Healthcare
- 9.2.6. Oil and Gas
- 9.2.7. Others (Energy, Chemical, Mining etc.)
- 9.1. Market Analysis, Insights and Forecast - by Service Type
- 10. Latin America Systems Integrator Databases Market Analysis, Insights and Forecast, 2019-2031
- 10.1. Market Analysis, Insights and Forecast - by Service Type
- 10.1.1. Infrastructure Integration
- 10.1.2. Software/Application Integration
- 10.1.3. Consulting
- 10.2. Market Analysis, Insights and Forecast - by End-user Industry
- 10.2.1. Automotive
- 10.2.2. Aerospace and Defense
- 10.2.3. IT and Telecom
- 10.2.4. BFSI
- 10.2.5. Healthcare
- 10.2.6. Oil and Gas
- 10.2.7. Others (Energy, Chemical, Mining etc.)
- 10.1. Market Analysis, Insights and Forecast - by Service Type
- 11. Middle East and Africa Systems Integrator Databases Market Analysis, Insights and Forecast, 2019-2031
- 11.1. Market Analysis, Insights and Forecast - by Service Type
- 11.1.1. Infrastructure Integration
- 11.1.2. Software/Application Integration
- 11.1.3. Consulting
- 11.2. Market Analysis, Insights and Forecast - by End-user Industry
- 11.2.1. Automotive
- 11.2.2. Aerospace and Defense
- 11.2.3. IT and Telecom
- 11.2.4. BFSI
- 11.2.5. Healthcare
- 11.2.6. Oil and Gas
- 11.2.7. Others (Energy, Chemical, Mining etc.)
- 11.1. Market Analysis, Insights and Forecast - by Service Type
- 12. North America Systems Integrator Databases Market Analysis, Insights and Forecast, 2019-2031
- 12.1. Market Analysis, Insights and Forecast - By Country/Sub-region
- 12.1.1 United States
- 12.1.2 Canada
- 12.1.3 Mexico
- 13. Europe Systems Integrator Databases Market Analysis, Insights and Forecast, 2019-2031
- 13.1. Market Analysis, Insights and Forecast - By Country/Sub-region
- 13.1.1 Germany
- 13.1.2 United Kingdom
- 13.1.3 France
- 13.1.4 Spain
- 13.1.5 Italy
- 13.1.6 Spain
- 13.1.7 Belgium
- 13.1.8 Netherland
- 13.1.9 Nordics
- 13.1.10 Rest of Europe
- 14. Asia Pacific Systems Integrator Databases Market Analysis, Insights and Forecast, 2019-2031
- 14.1. Market Analysis, Insights and Forecast - By Country/Sub-region
- 14.1.1 China
- 14.1.2 Japan
- 14.1.3 India
- 14.1.4 South Korea
- 14.1.5 Southeast Asia
- 14.1.6 Australia
- 14.1.7 Indonesia
- 14.1.8 Phillipes
- 14.1.9 Singapore
- 14.1.10 Thailandc
- 14.1.11 Rest of Asia Pacific
- 15. South America Systems Integrator Databases Market Analysis, Insights and Forecast, 2019-2031
- 15.1. Market Analysis, Insights and Forecast - By Country/Sub-region
- 15.1.1 Brazil
- 15.1.2 Argentina
- 15.1.3 Peru
- 15.1.4 Chile
- 15.1.5 Colombia
- 15.1.6 Ecuador
- 15.1.7 Venezuela
- 15.1.8 Rest of South America
- 16. North America Systems Integrator Databases Market Analysis, Insights and Forecast, 2019-2031
- 16.1. Market Analysis, Insights and Forecast - By Country/Sub-region
- 16.1.1 United States
- 16.1.2 Canada
- 16.1.3 Mexico
- 17. MEA Systems Integrator Databases Market Analysis, Insights and Forecast, 2019-2031
- 17.1. Market Analysis, Insights and Forecast - By Country/Sub-region
- 17.1.1 United Arab Emirates
- 17.1.2 Saudi Arabia
- 17.1.3 South Africa
- 17.1.4 Rest of Middle East and Africa
- 18. Competitive Analysis
- 18.1. Global Market Share Analysis 2024
- 18.2. Company Profiles
- 18.2.1 Deloitte Touche Tohmatsu Limited
- 18.2.1.1. Overview
- 18.2.1.2. Products
- 18.2.1.3. SWOT Analysis
- 18.2.1.4. Recent Developments
- 18.2.1.5. Financials (Based on Availability)
- 18.2.2 Infosys Limited
- 18.2.2.1. Overview
- 18.2.2.2. Products
- 18.2.2.3. SWOT Analysis
- 18.2.2.4. Recent Developments
- 18.2.2.5. Financials (Based on Availability)
- 18.2.3 Wipro Limited
- 18.2.3.1. Overview
- 18.2.3.2. Products
- 18.2.3.3. SWOT Analysis
- 18.2.3.4. Recent Developments
- 18.2.3.5. Financials (Based on Availability)
- 18.2.4 Cognizant
- 18.2.4.1. Overview
- 18.2.4.2. Products
- 18.2.4.3. SWOT Analysis
- 18.2.4.4. Recent Developments
- 18.2.4.5. Financials (Based on Availability)
- 18.2.5 IBM Corporation
- 18.2.5.1. Overview
- 18.2.5.2. Products
- 18.2.5.3. SWOT Analysis
- 18.2.5.4. Recent Developments
- 18.2.5.5. Financials (Based on Availability)
- 18.2.6 MDS Systems Integration (MDS SI)
- 18.2.6.1. Overview
- 18.2.6.2. Products
- 18.2.6.3. SWOT Analysis
- 18.2.6.4. Recent Developments
- 18.2.6.5. Financials (Based on Availability)
- 18.2.7 BAE systems
- 18.2.7.1. Overview
- 18.2.7.2. Products
- 18.2.7.3. SWOT Analysis
- 18.2.7.4. Recent Developments
- 18.2.7.5. Financials (Based on Availability)
- 18.2.8 Accenture
- 18.2.8.1. Overview
- 18.2.8.2. Products
- 18.2.8.3. SWOT Analysis
- 18.2.8.4. Recent Developments
- 18.2.8.5. Financials (Based on Availability)
- 18.2.9 Tata Consultancy Services Limited
- 18.2.9.1. Overview
- 18.2.9.2. Products
- 18.2.9.3. SWOT Analysis
- 18.2.9.4. Recent Developments
- 18.2.9.5. Financials (Based on Availability)
- 18.2.10 Oracle Corporation
- 18.2.10.1. Overview
- 18.2.10.2. Products
- 18.2.10.3. SWOT Analysis
- 18.2.10.4. Recent Developments
- 18.2.10.5. Financials (Based on Availability)
- 18.2.1 Deloitte Touche Tohmatsu Limited
List of Figures
- Figure 1: Global Systems Integrator Databases Market Revenue Breakdown (Million, %) by Region 2024 & 2032
- Figure 2: Global Systems Integrator Databases Market Volume Breakdown (K Unit, %) by Region 2024 & 2032
- Figure 3: North America Systems Integrator Databases Market Revenue (Million), by Country 2024 & 2032
- Figure 4: North America Systems Integrator Databases Market Volume (K Unit), by Country 2024 & 2032
- Figure 5: North America Systems Integrator Databases Market Revenue Share (%), by Country 2024 & 2032
- Figure 6: North America Systems Integrator Databases Market Volume Share (%), by Country 2024 & 2032
- Figure 7: Europe Systems Integrator Databases Market Revenue (Million), by Country 2024 & 2032
- Figure 8: Europe Systems Integrator Databases Market Volume (K Unit), by Country 2024 & 2032
- Figure 9: Europe Systems Integrator Databases Market Revenue Share (%), by Country 2024 & 2032
- Figure 10: Europe Systems Integrator Databases Market Volume Share (%), by Country 2024 & 2032
- Figure 11: Asia Pacific Systems Integrator Databases Market Revenue (Million), by Country 2024 & 2032
- Figure 12: Asia Pacific Systems Integrator Databases Market Volume (K Unit), by Country 2024 & 2032
- Figure 13: Asia Pacific Systems Integrator Databases Market Revenue Share (%), by Country 2024 & 2032
- Figure 14: Asia Pacific Systems Integrator Databases Market Volume Share (%), by Country 2024 & 2032
- Figure 15: South America Systems Integrator Databases Market Revenue (Million), by Country 2024 & 2032
- Figure 16: South America Systems Integrator Databases Market Volume (K Unit), by Country 2024 & 2032
- Figure 17: South America Systems Integrator Databases Market Revenue Share (%), by Country 2024 & 2032
- Figure 18: South America Systems Integrator Databases Market Volume Share (%), by Country 2024 & 2032
- Figure 19: North America Systems Integrator Databases Market Revenue (Million), by Country 2024 & 2032
- Figure 20: North America Systems Integrator Databases Market Volume (K Unit), by Country 2024 & 2032
- Figure 21: North America Systems Integrator Databases Market Revenue Share (%), by Country 2024 & 2032
- Figure 22: North America Systems Integrator Databases Market Volume Share (%), by Country 2024 & 2032
- Figure 23: MEA Systems Integrator Databases Market Revenue (Million), by Country 2024 & 2032
- Figure 24: MEA Systems Integrator Databases Market Volume (K Unit), by Country 2024 & 2032
- Figure 25: MEA Systems Integrator Databases Market Revenue Share (%), by Country 2024 & 2032
- Figure 26: MEA Systems Integrator Databases Market Volume Share (%), by Country 2024 & 2032
- Figure 27: North America Systems Integrator Databases Market Revenue (Million), by Service Type 2024 & 2032
- Figure 28: North America Systems Integrator Databases Market Volume (K Unit), by Service Type 2024 & 2032
- Figure 29: North America Systems Integrator Databases Market Revenue Share (%), by Service Type 2024 & 2032
- Figure 30: North America Systems Integrator Databases Market Volume Share (%), by Service Type 2024 & 2032
- Figure 31: North America Systems Integrator Databases Market Revenue (Million), by End-user Industry 2024 & 2032
- Figure 32: North America Systems Integrator Databases Market Volume (K Unit), by End-user Industry 2024 & 2032
- Figure 33: North America Systems Integrator Databases Market Revenue Share (%), by End-user Industry 2024 & 2032
- Figure 34: North America Systems Integrator Databases Market Volume Share (%), by End-user Industry 2024 & 2032
- Figure 35: North America Systems Integrator Databases Market Revenue (Million), by Country 2024 & 2032
- Figure 36: North America Systems Integrator Databases Market Volume (K Unit), by Country 2024 & 2032
- Figure 37: North America Systems Integrator Databases Market Revenue Share (%), by Country 2024 & 2032
- Figure 38: North America Systems Integrator Databases Market Volume Share (%), by Country 2024 & 2032
- Figure 39: Europe Systems Integrator Databases Market Revenue (Million), by Service Type 2024 & 2032
- Figure 40: Europe Systems Integrator Databases Market Volume (K Unit), by Service Type 2024 & 2032
- Figure 41: Europe Systems Integrator Databases Market Revenue Share (%), by Service Type 2024 & 2032
- Figure 42: Europe Systems Integrator Databases Market Volume Share (%), by Service Type 2024 & 2032
- Figure 43: Europe Systems Integrator Databases Market Revenue (Million), by End-user Industry 2024 & 2032
- Figure 44: Europe Systems Integrator Databases Market Volume (K Unit), by End-user Industry 2024 & 2032
- Figure 45: Europe Systems Integrator Databases Market Revenue Share (%), by End-user Industry 2024 & 2032
- Figure 46: Europe Systems Integrator Databases Market Volume Share (%), by End-user Industry 2024 & 2032
- Figure 47: Europe Systems Integrator Databases Market Revenue (Million), by Country 2024 & 2032
- Figure 48: Europe Systems Integrator Databases Market Volume (K Unit), by Country 2024 & 2032
- Figure 49: Europe Systems Integrator Databases Market Revenue Share (%), by Country 2024 & 2032
- Figure 50: Europe Systems Integrator Databases Market Volume Share (%), by Country 2024 & 2032
- Figure 51: Asia Systems Integrator Databases Market Revenue (Million), by Service Type 2024 & 2032
- Figure 52: Asia Systems Integrator Databases Market Volume (K Unit), by Service Type 2024 & 2032
- Figure 53: Asia Systems Integrator Databases Market Revenue Share (%), by Service Type 2024 & 2032
- Figure 54: Asia Systems Integrator Databases Market Volume Share (%), by Service Type 2024 & 2032
- Figure 55: Asia Systems Integrator Databases Market Revenue (Million), by End-user Industry 2024 & 2032
- Figure 56: Asia Systems Integrator Databases Market Volume (K Unit), by End-user Industry 2024 & 2032
- Figure 57: Asia Systems Integrator Databases Market Revenue Share (%), by End-user Industry 2024 & 2032
- Figure 58: Asia Systems Integrator Databases Market Volume Share (%), by End-user Industry 2024 & 2032
- Figure 59: Asia Systems Integrator Databases Market Revenue (Million), by Country 2024 & 2032
- Figure 60: Asia Systems Integrator Databases Market Volume (K Unit), by Country 2024 & 2032
- Figure 61: Asia Systems Integrator Databases Market Revenue Share (%), by Country 2024 & 2032
- Figure 62: Asia Systems Integrator Databases Market Volume Share (%), by Country 2024 & 2032
- Figure 63: Australia and New Zealand Systems Integrator Databases Market Revenue (Million), by Service Type 2024 & 2032
- Figure 64: Australia and New Zealand Systems Integrator Databases Market Volume (K Unit), by Service Type 2024 & 2032
- Figure 65: Australia and New Zealand Systems Integrator Databases Market Revenue Share (%), by Service Type 2024 & 2032
- Figure 66: Australia and New Zealand Systems Integrator Databases Market Volume Share (%), by Service Type 2024 & 2032
- Figure 67: Australia and New Zealand Systems Integrator Databases Market Revenue (Million), by End-user Industry 2024 & 2032
- Figure 68: Australia and New Zealand Systems Integrator Databases Market Volume (K Unit), by End-user Industry 2024 & 2032
- Figure 69: Australia and New Zealand Systems Integrator Databases Market Revenue Share (%), by End-user Industry 2024 & 2032
- Figure 70: Australia and New Zealand Systems Integrator Databases Market Volume Share (%), by End-user Industry 2024 & 2032
- Figure 71: Australia and New Zealand Systems Integrator Databases Market Revenue (Million), by Country 2024 & 2032
- Figure 72: Australia and New Zealand Systems Integrator Databases Market Volume (K Unit), by Country 2024 & 2032
- Figure 73: Australia and New Zealand Systems Integrator Databases Market Revenue Share (%), by Country 2024 & 2032
- Figure 74: Australia and New Zealand Systems Integrator Databases Market Volume Share (%), by Country 2024 & 2032
- Figure 75: Latin America Systems Integrator Databases Market Revenue (Million), by Service Type 2024 & 2032
- Figure 76: Latin America Systems Integrator Databases Market Volume (K Unit), by Service Type 2024 & 2032
- Figure 77: Latin America Systems Integrator Databases Market Revenue Share (%), by Service Type 2024 & 2032
- Figure 78: Latin America Systems Integrator Databases Market Volume Share (%), by Service Type 2024 & 2032
- Figure 79: Latin America Systems Integrator Databases Market Revenue (Million), by End-user Industry 2024 & 2032
- Figure 80: Latin America Systems Integrator Databases Market Volume (K Unit), by End-user Industry 2024 & 2032
- Figure 81: Latin America Systems Integrator Databases Market Revenue Share (%), by End-user Industry 2024 & 2032
- Figure 82: Latin America Systems Integrator Databases Market Volume Share (%), by End-user Industry 2024 & 2032
- Figure 83: Latin America Systems Integrator Databases Market Revenue (Million), by Country 2024 & 2032
- Figure 84: Latin America Systems Integrator Databases Market Volume (K Unit), by Country 2024 & 2032
- Figure 85: Latin America Systems Integrator Databases Market Revenue Share (%), by Country 2024 & 2032
- Figure 86: Latin America Systems Integrator Databases Market Volume Share (%), by Country 2024 & 2032
- Figure 87: Middle East and Africa Systems Integrator Databases Market Revenue (Million), by Service Type 2024 & 2032
- Figure 88: Middle East and Africa Systems Integrator Databases Market Volume (K Unit), by Service Type 2024 & 2032
- Figure 89: Middle East and Africa Systems Integrator Databases Market Revenue Share (%), by Service Type 2024 & 2032
- Figure 90: Middle East and Africa Systems Integrator Databases Market Volume Share (%), by Service Type 2024 & 2032
- Figure 91: Middle East and Africa Systems Integrator Databases Market Revenue (Million), by End-user Industry 2024 & 2032
- Figure 92: Middle East and Africa Systems Integrator Databases Market Volume (K Unit), by End-user Industry 2024 & 2032
- Figure 93: Middle East and Africa Systems Integrator Databases Market Revenue Share (%), by End-user Industry 2024 & 2032
- Figure 94: Middle East and Africa Systems Integrator Databases Market Volume Share (%), by End-user Industry 2024 & 2032
- Figure 95: Middle East and Africa Systems Integrator Databases Market Revenue (Million), by Country 2024 & 2032
- Figure 96: Middle East and Africa Systems Integrator Databases Market Volume (K Unit), by Country 2024 & 2032
- Figure 97: Middle East and Africa Systems Integrator Databases Market Revenue Share (%), by Country 2024 & 2032
- Figure 98: Middle East and Africa Systems Integrator Databases Market Volume Share (%), by Country 2024 & 2032
List of Tables
- Table 1: Global Systems Integrator Databases Market Revenue Million Forecast, by Region 2019 & 2032
- Table 2: Global Systems Integrator Databases Market Volume K Unit Forecast, by Region 2019 & 2032
- Table 3: Global Systems Integrator Databases Market Revenue Million Forecast, by Service Type 2019 & 2032
- Table 4: Global Systems Integrator Databases Market Volume K Unit Forecast, by Service Type 2019 & 2032
- Table 5: Global Systems Integrator Databases Market Revenue Million Forecast, by End-user Industry 2019 & 2032
- Table 6: Global Systems Integrator Databases Market Volume K Unit Forecast, by End-user Industry 2019 & 2032
- Table 7: Global Systems Integrator Databases Market Revenue Million Forecast, by Region 2019 & 2032
- Table 8: Global Systems Integrator Databases Market Volume K Unit Forecast, by Region 2019 & 2032
- Table 9: Global Systems Integrator Databases Market Revenue Million Forecast, by Country 2019 & 2032
- Table 10: Global Systems Integrator Databases Market Volume K Unit Forecast, by Country 2019 & 2032
- Table 11: United States Systems Integrator Databases Market Revenue (Million) Forecast, by Application 2019 & 2032
- Table 12: United States Systems Integrator Databases Market Volume (K Unit) Forecast, by Application 2019 & 2032
- Table 13: Canada Systems Integrator Databases Market Revenue (Million) Forecast, by Application 2019 & 2032
- Table 14: Canada Systems Integrator Databases Market Volume (K Unit) Forecast, by Application 2019 & 2032
- Table 15: Mexico Systems Integrator Databases Market Revenue (Million) Forecast, by Application 2019 & 2032
- Table 16: Mexico Systems Integrator Databases Market Volume (K Unit) Forecast, by Application 2019 & 2032
- Table 17: Global Systems Integrator Databases Market Revenue Million Forecast, by Country 2019 & 2032
- Table 18: Global Systems Integrator Databases Market Volume K Unit Forecast, by Country 2019 & 2032
- Table 19: Germany Systems Integrator Databases Market Revenue (Million) Forecast, by Application 2019 & 2032
- Table 20: Germany Systems Integrator Databases Market Volume (K Unit) Forecast, by Application 2019 & 2032
- Table 21: United Kingdom Systems Integrator Databases Market Revenue (Million) Forecast, by Application 2019 & 2032
- Table 22: United Kingdom Systems Integrator Databases Market Volume (K Unit) Forecast, by Application 2019 & 2032
- Table 23: France Systems Integrator Databases Market Revenue (Million) Forecast, by Application 2019 & 2032
- Table 24: France Systems Integrator Databases Market Volume (K Unit) Forecast, by Application 2019 & 2032
- Table 25: Spain Systems Integrator Databases Market Revenue (Million) Forecast, by Application 2019 & 2032
- Table 26: Spain Systems Integrator Databases Market Volume (K Unit) Forecast, by Application 2019 & 2032
- Table 27: Italy Systems Integrator Databases Market Revenue (Million) Forecast, by Application 2019 & 2032
- Table 28: Italy Systems Integrator Databases Market Volume (K Unit) Forecast, by Application 2019 & 2032
- Table 29: Spain Systems Integrator Databases Market Revenue (Million) Forecast, by Application 2019 & 2032
- Table 30: Spain Systems Integrator Databases Market Volume (K Unit) Forecast, by Application 2019 & 2032
- Table 31: Belgium Systems Integrator Databases Market Revenue (Million) Forecast, by Application 2019 & 2032
- Table 32: Belgium Systems Integrator Databases Market Volume (K Unit) Forecast, by Application 2019 & 2032
- Table 33: Netherland Systems Integrator Databases Market Revenue (Million) Forecast, by Application 2019 & 2032
- Table 34: Netherland Systems Integrator Databases Market Volume (K Unit) Forecast, by Application 2019 & 2032
- Table 35: Nordics Systems Integrator Databases Market Revenue (Million) Forecast, by Application 2019 & 2032
- Table 36: Nordics Systems Integrator Databases Market Volume (K Unit) Forecast, by Application 2019 & 2032
- Table 37: Rest of Europe Systems Integrator Databases Market Revenue (Million) Forecast, by Application 2019 & 2032
- Table 38: Rest of Europe Systems Integrator Databases Market Volume (K Unit) Forecast, by Application 2019 & 2032
- Table 39: Global Systems Integrator Databases Market Revenue Million Forecast, by Country 2019 & 2032
- Table 40: Global Systems Integrator Databases Market Volume K Unit Forecast, by Country 2019 & 2032
- Table 41: China Systems Integrator Databases Market Revenue (Million) Forecast, by Application 2019 & 2032
- Table 42: China Systems Integrator Databases Market Volume (K Unit) Forecast, by Application 2019 & 2032
- Table 43: Japan Systems Integrator Databases Market Revenue (Million) Forecast, by Application 2019 & 2032
- Table 44: Japan Systems Integrator Databases Market Volume (K Unit) Forecast, by Application 2019 & 2032
- Table 45: India Systems Integrator Databases Market Revenue (Million) Forecast, by Application 2019 & 2032
- Table 46: India Systems Integrator Databases Market Volume (K Unit) Forecast, by Application 2019 & 2032
- Table 47: South Korea Systems Integrator Databases Market Revenue (Million) Forecast, by Application 2019 & 2032
- Table 48: South Korea Systems Integrator Databases Market Volume (K Unit) Forecast, by Application 2019 & 2032
- Table 49: Southeast Asia Systems Integrator Databases Market Revenue (Million) Forecast, by Application 2019 & 2032
- Table 50: Southeast Asia Systems Integrator Databases Market Volume (K Unit) Forecast, by Application 2019 & 2032
- Table 51: Australia Systems Integrator Databases Market Revenue (Million) Forecast, by Application 2019 & 2032
- Table 52: Australia Systems Integrator Databases Market Volume (K Unit) Forecast, by Application 2019 & 2032
- Table 53: Indonesia Systems Integrator Databases Market Revenue (Million) Forecast, by Application 2019 & 2032
- Table 54: Indonesia Systems Integrator Databases Market Volume (K Unit) Forecast, by Application 2019 & 2032
- Table 55: Phillipes Systems Integrator Databases Market Revenue (Million) Forecast, by Application 2019 & 2032
- Table 56: Phillipes Systems Integrator Databases Market Volume (K Unit) Forecast, by Application 2019 & 2032
- Table 57: Singapore Systems Integrator Databases Market Revenue (Million) Forecast, by Application 2019 & 2032
- Table 58: Singapore Systems Integrator Databases Market Volume (K Unit) Forecast, by Application 2019 & 2032
- Table 59: Thailandc Systems Integrator Databases Market Revenue (Million) Forecast, by Application 2019 & 2032
- Table 60: Thailandc Systems Integrator Databases Market Volume (K Unit) Forecast, by Application 2019 & 2032
- Table 61: Rest of Asia Pacific Systems Integrator Databases Market Revenue (Million) Forecast, by Application 2019 & 2032
- Table 62: Rest of Asia Pacific Systems Integrator Databases Market Volume (K Unit) Forecast, by Application 2019 & 2032
- Table 63: Global Systems Integrator Databases Market Revenue Million Forecast, by Country 2019 & 2032
- Table 64: Global Systems Integrator Databases Market Volume K Unit Forecast, by Country 2019 & 2032
- Table 65: Brazil Systems Integrator Databases Market Revenue (Million) Forecast, by Application 2019 & 2032
- Table 66: Brazil Systems Integrator Databases Market Volume (K Unit) Forecast, by Application 2019 & 2032
- Table 67: Argentina Systems Integrator Databases Market Revenue (Million) Forecast, by Application 2019 & 2032
- Table 68: Argentina Systems Integrator Databases Market Volume (K Unit) Forecast, by Application 2019 & 2032
- Table 69: Peru Systems Integrator Databases Market Revenue (Million) Forecast, by Application 2019 & 2032
- Table 70: Peru Systems Integrator Databases Market Volume (K Unit) Forecast, by Application 2019 & 2032
- Table 71: Chile Systems Integrator Databases Market Revenue (Million) Forecast, by Application 2019 & 2032
- Table 72: Chile Systems Integrator Databases Market Volume (K Unit) Forecast, by Application 2019 & 2032
- Table 73: Colombia Systems Integrator Databases Market Revenue (Million) Forecast, by Application 2019 & 2032
- Table 74: Colombia Systems Integrator Databases Market Volume (K Unit) Forecast, by Application 2019 & 2032
- Table 75: Ecuador Systems Integrator Databases Market Revenue (Million) Forecast, by Application 2019 & 2032
- Table 76: Ecuador Systems Integrator Databases Market Volume (K Unit) Forecast, by Application 2019 & 2032
- Table 77: Venezuela Systems Integrator Databases Market Revenue (Million) Forecast, by Application 2019 & 2032
- Table 78: Venezuela Systems Integrator Databases Market Volume (K Unit) Forecast, by Application 2019 & 2032
- Table 79: Rest of South America Systems Integrator Databases Market Revenue (Million) Forecast, by Application 2019 & 2032
- Table 80: Rest of South America Systems Integrator Databases Market Volume (K Unit) Forecast, by Application 2019 & 2032
- Table 81: Global Systems Integrator Databases Market Revenue Million Forecast, by Country 2019 & 2032
- Table 82: Global Systems Integrator Databases Market Volume K Unit Forecast, by Country 2019 & 2032
- Table 83: United States Systems Integrator Databases Market Revenue (Million) Forecast, by Application 2019 & 2032
- Table 84: United States Systems Integrator Databases Market Volume (K Unit) Forecast, by Application 2019 & 2032
- Table 85: Canada Systems Integrator Databases Market Revenue (Million) Forecast, by Application 2019 & 2032
- Table 86: Canada Systems Integrator Databases Market Volume (K Unit) Forecast, by Application 2019 & 2032
- Table 87: Mexico Systems Integrator Databases Market Revenue (Million) Forecast, by Application 2019 & 2032
- Table 88: Mexico Systems Integrator Databases Market Volume (K Unit) Forecast, by Application 2019 & 2032
- Table 89: Global Systems Integrator Databases Market Revenue Million Forecast, by Country 2019 & 2032
- Table 90: Global Systems Integrator Databases Market Volume K Unit Forecast, by Country 2019 & 2032
- Table 91: United Arab Emirates Systems Integrator Databases Market Revenue (Million) Forecast, by Application 2019 & 2032
- Table 92: United Arab Emirates Systems Integrator Databases Market Volume (K Unit) Forecast, by Application 2019 & 2032
- Table 93: Saudi Arabia Systems Integrator Databases Market Revenue (Million) Forecast, by Application 2019 & 2032
- Table 94: Saudi Arabia Systems Integrator Databases Market Volume (K Unit) Forecast, by Application 2019 & 2032
- Table 95: South Africa Systems Integrator Databases Market Revenue (Million) Forecast, by Application 2019 & 2032
- Table 96: South Africa Systems Integrator Databases Market Volume (K Unit) Forecast, by Application 2019 & 2032
- Table 97: Rest of Middle East and Africa Systems Integrator Databases Market Revenue (Million) Forecast, by Application 2019 & 2032
- Table 98: Rest of Middle East and Africa Systems Integrator Databases Market Volume (K Unit) Forecast, by Application 2019 & 2032
- Table 99: Global Systems Integrator Databases Market Revenue Million Forecast, by Service Type 2019 & 2032
- Table 100: Global Systems Integrator Databases Market Volume K Unit Forecast, by Service Type 2019 & 2032
- Table 101: Global Systems Integrator Databases Market Revenue Million Forecast, by End-user Industry 2019 & 2032
- Table 102: Global Systems Integrator Databases Market Volume K Unit Forecast, by End-user Industry 2019 & 2032
- Table 103: Global Systems Integrator Databases Market Revenue Million Forecast, by Country 2019 & 2032
- Table 104: Global Systems Integrator Databases Market Volume K Unit Forecast, by Country 2019 & 2032
- Table 105: United States Systems Integrator Databases Market Revenue (Million) Forecast, by Application 2019 & 2032
- Table 106: United States Systems Integrator Databases Market Volume (K Unit) Forecast, by Application 2019 & 2032
- Table 107: Canada Systems Integrator Databases Market Revenue (Million) Forecast, by Application 2019 & 2032
- Table 108: Canada Systems Integrator Databases Market Volume (K Unit) Forecast, by Application 2019 & 2032
- Table 109: Global Systems Integrator Databases Market Revenue Million Forecast, by Service Type 2019 & 2032
- Table 110: Global Systems Integrator Databases Market Volume K Unit Forecast, by Service Type 2019 & 2032
- Table 111: Global Systems Integrator Databases Market Revenue Million Forecast, by End-user Industry 2019 & 2032
- Table 112: Global Systems Integrator Databases Market Volume K Unit Forecast, by End-user Industry 2019 & 2032
- Table 113: Global Systems Integrator Databases Market Revenue Million Forecast, by Country 2019 & 2032
- Table 114: Global Systems Integrator Databases Market Volume K Unit Forecast, by Country 2019 & 2032
- Table 115: Germany Systems Integrator Databases Market Revenue (Million) Forecast, by Application 2019 & 2032
- Table 116: Germany Systems Integrator Databases Market Volume (K Unit) Forecast, by Application 2019 & 2032
- Table 117: France Systems Integrator Databases Market Revenue (Million) Forecast, by Application 2019 & 2032
- Table 118: France Systems Integrator Databases Market Volume (K Unit) Forecast, by Application 2019 & 2032
- Table 119: United Kingdom Systems Integrator Databases Market Revenue (Million) Forecast, by Application 2019 & 2032
- Table 120: United Kingdom Systems Integrator Databases Market Volume (K Unit) Forecast, by Application 2019 & 2032
- Table 121: Global Systems Integrator Databases Market Revenue Million Forecast, by Service Type 2019 & 2032
- Table 122: Global Systems Integrator Databases Market Volume K Unit Forecast, by Service Type 2019 & 2032
- Table 123: Global Systems Integrator Databases Market Revenue Million Forecast, by End-user Industry 2019 & 2032
- Table 124: Global Systems Integrator Databases Market Volume K Unit Forecast, by End-user Industry 2019 & 2032
- Table 125: Global Systems Integrator Databases Market Revenue Million Forecast, by Country 2019 & 2032
- Table 126: Global Systems Integrator Databases Market Volume K Unit Forecast, by Country 2019 & 2032
- Table 127: India Systems Integrator Databases Market Revenue (Million) Forecast, by Application 2019 & 2032
- Table 128: India Systems Integrator Databases Market Volume (K Unit) Forecast, by Application 2019 & 2032
- Table 129: China Systems Integrator Databases Market Revenue (Million) Forecast, by Application 2019 & 2032
- Table 130: China Systems Integrator Databases Market Volume (K Unit) Forecast, by Application 2019 & 2032
- Table 131: Japan Systems Integrator Databases Market Revenue (Million) Forecast, by Application 2019 & 2032
- Table 132: Japan Systems Integrator Databases Market Volume (K Unit) Forecast, by Application 2019 & 2032
- Table 133: Global Systems Integrator Databases Market Revenue Million Forecast, by Service Type 2019 & 2032
- Table 134: Global Systems Integrator Databases Market Volume K Unit Forecast, by Service Type 2019 & 2032
- Table 135: Global Systems Integrator Databases Market Revenue Million Forecast, by End-user Industry 2019 & 2032
- Table 136: Global Systems Integrator Databases Market Volume K Unit Forecast, by End-user Industry 2019 & 2032
- Table 137: Global Systems Integrator Databases Market Revenue Million Forecast, by Country 2019 & 2032
- Table 138: Global Systems Integrator Databases Market Volume K Unit Forecast, by Country 2019 & 2032
- Table 139: Global Systems Integrator Databases Market Revenue Million Forecast, by Service Type 2019 & 2032
- Table 140: Global Systems Integrator Databases Market Volume K Unit Forecast, by Service Type 2019 & 2032
- Table 141: Global Systems Integrator Databases Market Revenue Million Forecast, by End-user Industry 2019 & 2032
- Table 142: Global Systems Integrator Databases Market Volume K Unit Forecast, by End-user Industry 2019 & 2032
- Table 143: Global Systems Integrator Databases Market Revenue Million Forecast, by Country 2019 & 2032
- Table 144: Global Systems Integrator Databases Market Volume K Unit Forecast, by Country 2019 & 2032
- Table 145: Global Systems Integrator Databases Market Revenue Million Forecast, by Service Type 2019 & 2032
- Table 146: Global Systems Integrator Databases Market Volume K Unit Forecast, by Service Type 2019 & 2032
- Table 147: Global Systems Integrator Databases Market Revenue Million Forecast, by End-user Industry 2019 & 2032
- Table 148: Global Systems Integrator Databases Market Volume K Unit Forecast, by End-user Industry 2019 & 2032
- Table 149: Global Systems Integrator Databases Market Revenue Million Forecast, by Country 2019 & 2032
- Table 150: Global Systems Integrator Databases Market Volume K Unit Forecast, by Country 2019 & 2032
Frequently Asked Questions
1. What is the projected Compound Annual Growth Rate (CAGR) of the Systems Integrator Databases Market?
The projected CAGR is approximately 9.92%.
2. Which companies are prominent players in the Systems Integrator Databases Market?
Key companies in the market include Deloitte Touche Tohmatsu Limited, Infosys Limited, Wipro Limited, Cognizant, IBM Corporation, MDS Systems Integration (MDS SI), BAE systems, Accenture, Tata Consultancy Services Limited, Oracle Corporation.
3. What are the main segments of the Systems Integrator Databases Market?
The market segments include Service Type, End-user Industry.
4. Can you provide details about the market size?
The market size is estimated to be USD 485.41 Million as of 2022.
5. What are some drivers contributing to market growth?
Advancements and adoption of cloud-technologies; Benefits of increasing productivity while reducing IT Management cost.
6. What are the notable trends driving market growth?
Software/Application Integration to have a Significant Growth.
7. Are there any restraints impacting market growth?
Inability of Service Providers to Provide Real-time Insights.
8. Can you provide examples of recent developments in the market?
September 2022 - NVIDIA launched its first software- and infrastructure-as-a-service offering NVIDIA Omniverse Cloud, a comprehensive suite of cloud services for artists, developers, and enterprise teams to design, publish, operate, and experience metaverse applications anywhere. Using Omniverse Cloud, individuals and teams can experience in one click the ability to create and collaborate on 3D workflows without the need for any local computing power.
9. What pricing options are available for accessing the report?
Pricing options include single-user, multi-user, and enterprise licenses priced at USD 4750, USD 5250, and USD 8750 respectively.
10. Is the market size provided in terms of value or volume?
The market size is provided in terms of value, measured in Million and volume, measured in K Unit.
11. Are there any specific market keywords associated with the report?
Yes, the market keyword associated with the report is "Systems Integrator Databases Market," which aids in identifying and referencing the specific market segment covered.
12. How do I determine which pricing option suits my needs best?
The pricing options vary based on user requirements and access needs. Individual users may opt for single-user licenses, while businesses requiring broader access may choose multi-user or enterprise licenses for cost-effective access to the report.
13. Are there any additional resources or data provided in the Systems Integrator Databases Market report?
While the report offers comprehensive insights, it's advisable to review the specific contents or supplementary materials provided to ascertain if additional resources or data are available.
14. How can I stay updated on further developments or reports in the Systems Integrator Databases Market?
To stay informed about further developments, trends, and reports in the Systems Integrator Databases Market, consider subscribing to industry newsletters, following relevant companies and organizations, or regularly checking reputable industry news sources and publications.
Methodology
Step 1 - Identification of Relevant Samples Size from Population Database


Step 2 - Approaches for Defining Global Market Size (Value, Volume* & Price*)

Note*: In applicable scenarios
Step 3 - Data Sources
Primary Research
- Web Analytics
- Survey Reports
- Research Institute
- Latest Research Reports
- Opinion Leaders
Secondary Research
- Annual Reports
- White Paper
- Latest Press Release
- Industry Association
- Paid Database
- Investor Presentations

Step 4 - Data Triangulation
Involves using different sources of information in order to increase the validity of a study
These sources are likely to be stakeholders in a program - participants, other researchers, program staff, other community members, and so on.
Then we put all data in single framework & apply various statistical tools to find out the dynamic on the market.
During the analysis stage, feedback from the stakeholder groups would be compared to determine areas of agreement as well as areas of divergence


