
Key Insights
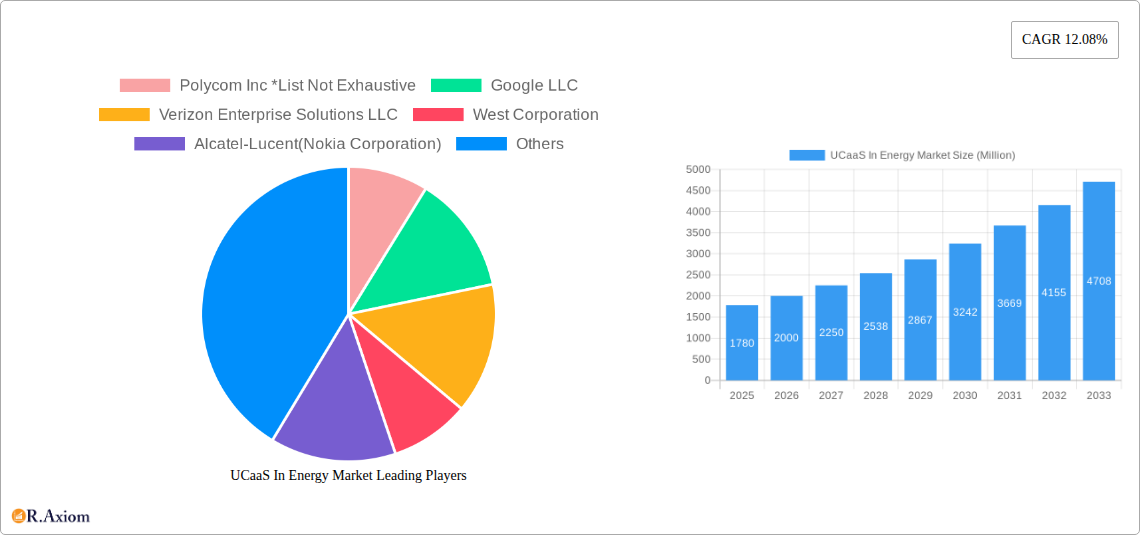
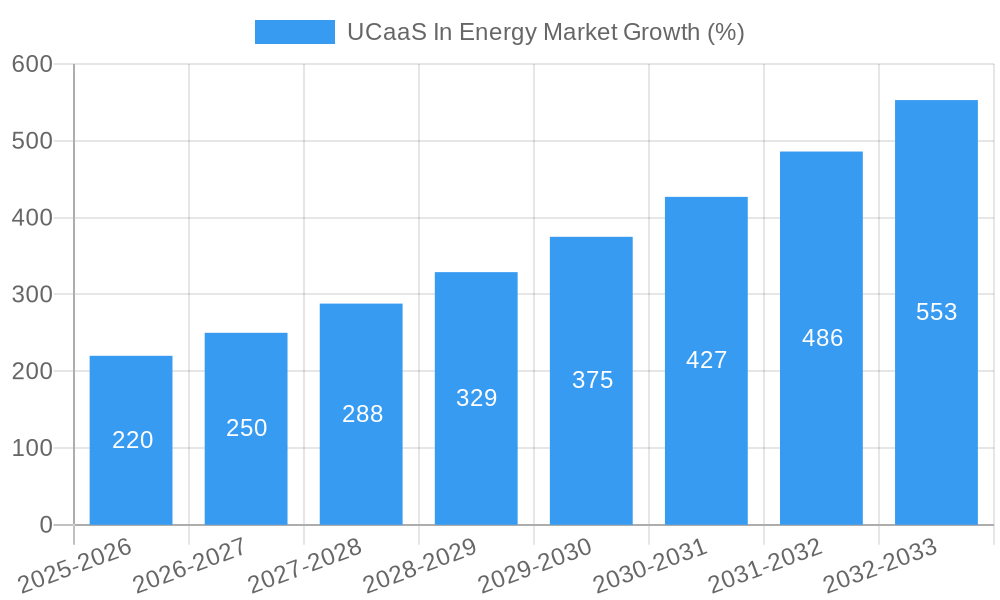
The Unified Communications as a Service (UCaaS) market within the energy sector is experiencing robust growth, projected to reach \$1.78 billion in 2025 and exhibiting a Compound Annual Growth Rate (CAGR) of 12.08% from 2025 to 2033. This expansion is driven by several key factors. Firstly, the increasing need for enhanced collaboration and communication among geographically dispersed teams within energy companies fuels the demand for flexible and scalable UCaaS solutions. Secondly, the ongoing digital transformation initiatives across the energy industry are pushing organizations to adopt cloud-based communication technologies, leading to a preference for UCaaS over traditional on-premises systems. Improved operational efficiency, reduced infrastructure costs, and enhanced security features further contribute to the market's growth. Finally, the integration of UCaaS with other enterprise applications, such as CRM and ERP systems, streamlines workflows and improves overall productivity. The market segmentation reveals significant contributions from large enterprises, with the private deployment model being preferred for its security and control advantages. Key players like Polycom, Google, Verizon, and Cisco are strategically investing in expanding their UCaaS offerings tailored to the specific needs of the energy sector, further propelling market expansion.
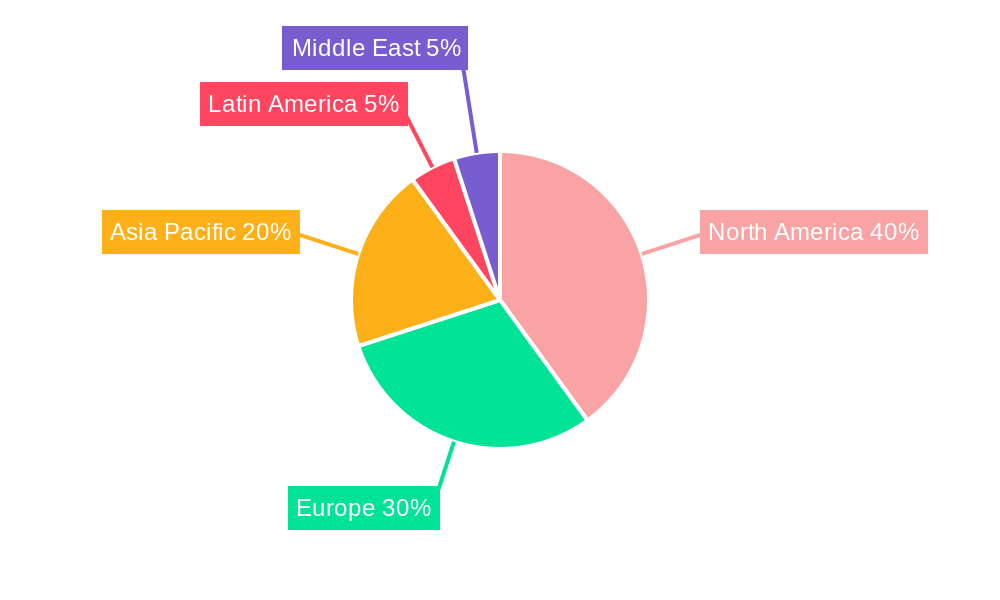
The growth trajectory of the UCaaS market in the energy sector is anticipated to remain strong throughout the forecast period (2025-2033). Continued investment in smart grids, renewable energy projects, and the Internet of Things (IoT) within the energy sector will create further demand for robust communication infrastructure. The market will likely see increased adoption of advanced features like AI-powered call routing, enhanced video conferencing capabilities, and improved integration with operational technology (OT) systems. While security concerns and the need for specialized industry expertise might pose some challenges, the overall market outlook remains positive. The hybrid deployment model is likely to gain traction as organizations strive to balance the benefits of cloud-based solutions with the security and control of on-premises systems. Regional variations in adoption rates are expected, with North America and Europe leading the market initially, followed by a significant increase in adoption across the Asia-Pacific region.
UCaaS in Energy Market: A Comprehensive Report (2019-2033)
This in-depth report provides a comprehensive analysis of the UCaaS (Unified Communications as a Service) market within the energy sector, offering invaluable insights for stakeholders from 2019 to 2033. The study covers market size, segmentation, growth drivers, challenges, and key players, equipping you with the knowledge to navigate this dynamic landscape. With a focus on actionable intelligence and data-driven projections, this report is an essential resource for strategic decision-making.
UCaaS In Energy Market Market Concentration & Innovation
The UCaaS market in the energy sector is experiencing a period of significant transformation, driven by both consolidation and innovation. Market concentration is moderate, with several major players holding substantial shares, but also room for smaller, specialized providers to thrive. The overall market size in 2025 is estimated at $xx Million, projected to reach $xx Million by 2033, representing a CAGR of xx%. This growth is fueled by several factors.
- Innovation Drivers: The increasing adoption of cloud-based technologies, the need for enhanced collaboration tools, and the rising demand for improved operational efficiency are key drivers. The development of AI-powered features within UCaaS platforms is also accelerating market growth.
- Regulatory Frameworks: Compliance requirements within the energy sector, particularly concerning data security and privacy, are shaping the market. Vendors are increasingly incorporating robust security measures into their offerings to meet these regulatory demands.
- Product Substitutes: While traditional on-premise communication systems still exist, the advantages of cloud-based UCaaS, such as scalability, cost-effectiveness, and accessibility, are driving their displacement.
- End-User Trends: Energy companies are increasingly adopting UCaaS solutions to connect geographically dispersed teams, enhance workforce mobility, and facilitate real-time communication during critical operations. The demand for seamless integration with existing enterprise systems is also a significant driver.
- M&A Activities: The UCaaS market has witnessed significant merger and acquisition activity in recent years. While precise deal values are not publicly available for all transactions, several large deals have resulted in the consolidation of market share and the expansion of service offerings. For example, a notable acquisition in 2024 valued at $xx Million significantly altered the competitive landscape.
UCaaS In Energy Market Industry Trends & Insights
The UCaaS market within the energy sector is experiencing robust growth, driven by several converging trends. The market's expansion is fueled by a confluence of factors, including the increasing adoption of cloud-based technologies, a growing need for enhanced collaboration tools, and the rising demand for improved operational efficiency within the energy industry. The market is projected to witness a compound annual growth rate (CAGR) of xx% during the forecast period (2025-2033). Market penetration is expected to increase from xx% in 2025 to xx% by 2033, reflecting the widespread adoption of UCaaS across various segments of the energy sector. Technological disruptions, such as the rise of 5G and AI-powered features within UCaaS platforms, are accelerating market growth. Consumer preferences are shifting towards flexible, scalable solutions that can adapt to the evolving needs of the energy industry. This preference, combined with intensified competition, is prompting UCaaS providers to innovate continuously and offer advanced features and improved customer service.
Dominant Markets & Segments in UCaaS In Energy Market
The North American region currently holds a dominant position in the UCaaS market for the energy sector, driven by factors such as the high concentration of major energy companies and advanced technological infrastructure.
- By Component: The collaboration segment currently dominates, followed closely by telephony. Unified messaging and conferencing are also significant segments, experiencing strong growth.
- By Deployment Model: The hybrid model is witnessing significant traction, offering a balance between on-premise security and the scalability of the cloud. Public cloud deployments are also gaining momentum.
- By Enterprise Size: Large enterprises are the primary adopters of UCaaS, but the SME segment is showcasing impressive growth potential.
Key Drivers of Dominance:
- North America: Strong regulatory support for cloud adoption and a high concentration of major energy companies.
- Collaboration Component: Growing need for real-time communication and collaboration across geographically dispersed teams within energy organizations.
- Hybrid Deployment Model: The ability to integrate cloud-based solutions with existing on-premise systems, allowing organizations to maintain control while benefiting from enhanced scalability.
- Large Enterprises: Greater resources and IT infrastructure to support the implementation of sophisticated UCaaS solutions.
UCaaS In Energy Market Product Developments
Recent product innovations in the UCaaS energy market focus on enhanced security features, AI-powered functionalities (like intelligent call routing and automated transcription), and improved integration with existing enterprise systems. These advancements cater to the specific needs of the energy sector, including the need for robust security protocols to protect sensitive data and compliance with industry regulations. The market is witnessing a shift toward more user-friendly interfaces and streamlined workflows, enhancing the overall user experience. The integration of advanced analytics is enabling energy companies to gain valuable insights into communication patterns and operational efficiencies.
Report Scope & Segmentation Analysis
This report comprehensively analyzes the UCaaS market in the energy sector across various segments.
- By Component: Telephony, Collaboration, Unified Messaging, Conferencing, and Other Services – Each segment exhibits unique growth trajectories and competitive dynamics. Collaboration is the fastest-growing segment, projected to reach $xx Million by 2033.
- By Deployment Model: Private, Public, and Hybrid Models – The hybrid model is gaining significant traction due to its flexibility.
- By Enterprise Size: Large Enterprises and Small & Medium Enterprises (SMEs) – Large enterprises currently dominate, but the SME segment is showing promising growth potential.
The report provides detailed market size estimations, growth projections, and competitive landscapes for each segment, highlighting key trends and opportunities.
Key Drivers of UCaaS In Energy Market Growth
The UCaaS market in the energy sector is propelled by several key drivers:
- Technological advancements: The rise of cloud computing, AI, and 5G are revolutionizing communication capabilities, offering greater scalability, reliability, and enhanced features.
- Economic factors: Cost optimization and improved operational efficiency are compelling energy companies to embrace UCaaS solutions.
- Regulatory compliance: Stringent data security and compliance regulations are driving the demand for secure and compliant UCaaS platforms.
Challenges in the UCaaS In Energy Market Sector
The growth of the UCaaS market in the energy sector is not without its challenges:
- Security concerns: Protecting sensitive data from cyber threats is a major concern for energy companies, requiring robust security protocols.
- Integration complexities: Seamless integration with existing enterprise systems can be challenging, requiring careful planning and implementation.
- Vendor lock-in: The dependence on a specific vendor can limit flexibility and increase switching costs.
Emerging Opportunities in UCaaS In Energy Market
Emerging opportunities in the UCaaS energy market include:
- Expansion into remote areas: UCaaS solutions can enable seamless communication in remote locations, crucial for energy operations.
- Integration with IoT devices: Integrating UCaaS with IoT sensors and devices can improve monitoring and efficiency in energy infrastructure.
- Focus on sustainability: UCaaS can contribute to sustainability efforts by reducing travel and paper consumption.
Leading Players in the UCaaS In Energy Market Market
- Polycom Inc
- Google LLC
- Verizon Enterprise Solutions LLC
- West Corporation
- Alcatel-Lucent (Nokia Corporation)
- Cisco Systems Inc
- Microsoft Corporation
- International Business Machines Corporation
- Avaya Inc
- BT Group plc
Key Developments in UCaaS In Energy Market Industry
- May 2023: Access4 launched a new SMS service, boosting partner growth and customer retention.
- August 2022: Avaya introduced Avaya Spaces, a comprehensive video collaboration app with advanced features for enhanced meeting management.
Strategic Outlook for UCaaS In Energy Market Market
The UCaaS market within the energy sector is poised for continued growth, driven by technological advancements, increasing demand for enhanced collaboration, and the need for improved operational efficiency. The focus on security, integration capabilities, and user experience will be crucial for success. The market presents significant opportunities for both established players and emerging innovators to capture market share and drive further growth in the coming years.
UCaaS In Energy Market Segmentation
-
1. Component
- 1.1. Telephony
- 1.2. Collaboration
- 1.3. Unified Messaging
- 1.4. Conferencing
- 1.5. Other Services
-
2. Deployment Model
- 2.1. Private
- 2.2. Public
- 2.3. Hybrid Model
-
3. Enterprise Size
- 3.1. Large Enterprise
- 3.2. Small & Medium Enterprise
UCaaS In Energy Market Segmentation By Geography
- 1. North America
- 2. Europe
- 3. Asia
- 4. Latin America
- 5. Middle East and Africa
UCaaS In Energy Market REPORT HIGHLIGHTS
| Aspects | Details |
|---|---|
| Study Period | 2019-2033 |
| Base Year | 2024 |
| Estimated Year | 2025 |
| Forecast Period | 2025-2033 |
| Historical Period | 2019-2024 |
| Growth Rate | CAGR of 12.08% from 2019-2033 |
| Segmentation |
|
Table of Contents
- 1. Introduction
- 1.1. Research Scope
- 1.2. Market Segmentation
- 1.3. Research Methodology
- 1.4. Definitions and Assumptions
- 2. Executive Summary
- 2.1. Introduction
- 3. Market Dynamics
- 3.1. Introduction
- 3.2. Market Drivers
- 3.2.1. Proliferation of Cloud Based Ecosystem will Act as a Driver; Improvement of Communication Technology
- 3.3. Market Restrains
- 3.3.1. Data Security Concerns will Remain a Challenge to the Growth of the Market
- 3.4. Market Trends
- 3.4.1. Proliferation of Cloud Based Ecosystem to Drive the Market Growth
- 4. Market Factor Analysis
- 4.1. Porters Five Forces
- 4.2. Supply/Value Chain
- 4.3. PESTEL analysis
- 4.4. Market Entropy
- 4.5. Patent/Trademark Analysis
- 5. Global UCaaS In Energy Market Analysis, Insights and Forecast, 2019-2031
- 5.1. Market Analysis, Insights and Forecast - by Component
- 5.1.1. Telephony
- 5.1.2. Collaboration
- 5.1.3. Unified Messaging
- 5.1.4. Conferencing
- 5.1.5. Other Services
- 5.2. Market Analysis, Insights and Forecast - by Deployment Model
- 5.2.1. Private
- 5.2.2. Public
- 5.2.3. Hybrid Model
- 5.3. Market Analysis, Insights and Forecast - by Enterprise Size
- 5.3.1. Large Enterprise
- 5.3.2. Small & Medium Enterprise
- 5.4. Market Analysis, Insights and Forecast - by Region
- 5.4.1. North America
- 5.4.2. Europe
- 5.4.3. Asia
- 5.4.4. Latin America
- 5.4.5. Middle East and Africa
- 5.1. Market Analysis, Insights and Forecast - by Component
- 6. North America UCaaS In Energy Market Analysis, Insights and Forecast, 2019-2031
- 6.1. Market Analysis, Insights and Forecast - by Component
- 6.1.1. Telephony
- 6.1.2. Collaboration
- 6.1.3. Unified Messaging
- 6.1.4. Conferencing
- 6.1.5. Other Services
- 6.2. Market Analysis, Insights and Forecast - by Deployment Model
- 6.2.1. Private
- 6.2.2. Public
- 6.2.3. Hybrid Model
- 6.3. Market Analysis, Insights and Forecast - by Enterprise Size
- 6.3.1. Large Enterprise
- 6.3.2. Small & Medium Enterprise
- 6.1. Market Analysis, Insights and Forecast - by Component
- 7. Europe UCaaS In Energy Market Analysis, Insights and Forecast, 2019-2031
- 7.1. Market Analysis, Insights and Forecast - by Component
- 7.1.1. Telephony
- 7.1.2. Collaboration
- 7.1.3. Unified Messaging
- 7.1.4. Conferencing
- 7.1.5. Other Services
- 7.2. Market Analysis, Insights and Forecast - by Deployment Model
- 7.2.1. Private
- 7.2.2. Public
- 7.2.3. Hybrid Model
- 7.3. Market Analysis, Insights and Forecast - by Enterprise Size
- 7.3.1. Large Enterprise
- 7.3.2. Small & Medium Enterprise
- 7.1. Market Analysis, Insights and Forecast - by Component
- 8. Asia UCaaS In Energy Market Analysis, Insights and Forecast, 2019-2031
- 8.1. Market Analysis, Insights and Forecast - by Component
- 8.1.1. Telephony
- 8.1.2. Collaboration
- 8.1.3. Unified Messaging
- 8.1.4. Conferencing
- 8.1.5. Other Services
- 8.2. Market Analysis, Insights and Forecast - by Deployment Model
- 8.2.1. Private
- 8.2.2. Public
- 8.2.3. Hybrid Model
- 8.3. Market Analysis, Insights and Forecast - by Enterprise Size
- 8.3.1. Large Enterprise
- 8.3.2. Small & Medium Enterprise
- 8.1. Market Analysis, Insights and Forecast - by Component
- 9. Latin America UCaaS In Energy Market Analysis, Insights and Forecast, 2019-2031
- 9.1. Market Analysis, Insights and Forecast - by Component
- 9.1.1. Telephony
- 9.1.2. Collaboration
- 9.1.3. Unified Messaging
- 9.1.4. Conferencing
- 9.1.5. Other Services
- 9.2. Market Analysis, Insights and Forecast - by Deployment Model
- 9.2.1. Private
- 9.2.2. Public
- 9.2.3. Hybrid Model
- 9.3. Market Analysis, Insights and Forecast - by Enterprise Size
- 9.3.1. Large Enterprise
- 9.3.2. Small & Medium Enterprise
- 9.1. Market Analysis, Insights and Forecast - by Component
- 10. Middle East and Africa UCaaS In Energy Market Analysis, Insights and Forecast, 2019-2031
- 10.1. Market Analysis, Insights and Forecast - by Component
- 10.1.1. Telephony
- 10.1.2. Collaboration
- 10.1.3. Unified Messaging
- 10.1.4. Conferencing
- 10.1.5. Other Services
- 10.2. Market Analysis, Insights and Forecast - by Deployment Model
- 10.2.1. Private
- 10.2.2. Public
- 10.2.3. Hybrid Model
- 10.3. Market Analysis, Insights and Forecast - by Enterprise Size
- 10.3.1. Large Enterprise
- 10.3.2. Small & Medium Enterprise
- 10.1. Market Analysis, Insights and Forecast - by Component
- 11. North America UCaaS In Energy Market Analysis, Insights and Forecast, 2019-2031
- 11.1. Market Analysis, Insights and Forecast - By Country/Sub-region
- 11.1.1.
- 12. Europe UCaaS In Energy Market Analysis, Insights and Forecast, 2019-2031
- 12.1. Market Analysis, Insights and Forecast - By Country/Sub-region
- 12.1.1.
- 13. Asia Pacific UCaaS In Energy Market Analysis, Insights and Forecast, 2019-2031
- 13.1. Market Analysis, Insights and Forecast - By Country/Sub-region
- 13.1.1.
- 14. Latin America UCaaS In Energy Market Analysis, Insights and Forecast, 2019-2031
- 14.1. Market Analysis, Insights and Forecast - By Country/Sub-region
- 14.1.1.
- 15. Middle East UCaaS In Energy Market Analysis, Insights and Forecast, 2019-2031
- 15.1. Market Analysis, Insights and Forecast - By Country/Sub-region
- 15.1.1.
- 16. Competitive Analysis
- 16.1. Global Market Share Analysis 2024
- 16.2. Company Profiles
- 16.2.1 Polycom Inc *List Not Exhaustive
- 16.2.1.1. Overview
- 16.2.1.2. Products
- 16.2.1.3. SWOT Analysis
- 16.2.1.4. Recent Developments
- 16.2.1.5. Financials (Based on Availability)
- 16.2.2 Google LLC
- 16.2.2.1. Overview
- 16.2.2.2. Products
- 16.2.2.3. SWOT Analysis
- 16.2.2.4. Recent Developments
- 16.2.2.5. Financials (Based on Availability)
- 16.2.3 Verizon Enterprise Solutions LLC
- 16.2.3.1. Overview
- 16.2.3.2. Products
- 16.2.3.3. SWOT Analysis
- 16.2.3.4. Recent Developments
- 16.2.3.5. Financials (Based on Availability)
- 16.2.4 West Corporation
- 16.2.4.1. Overview
- 16.2.4.2. Products
- 16.2.4.3. SWOT Analysis
- 16.2.4.4. Recent Developments
- 16.2.4.5. Financials (Based on Availability)
- 16.2.5 Alcatel-Lucent(Nokia Corporation)
- 16.2.5.1. Overview
- 16.2.5.2. Products
- 16.2.5.3. SWOT Analysis
- 16.2.5.4. Recent Developments
- 16.2.5.5. Financials (Based on Availability)
- 16.2.6 Cisco Systems Inc
- 16.2.6.1. Overview
- 16.2.6.2. Products
- 16.2.6.3. SWOT Analysis
- 16.2.6.4. Recent Developments
- 16.2.6.5. Financials (Based on Availability)
- 16.2.7 Microsoft Corporation
- 16.2.7.1. Overview
- 16.2.7.2. Products
- 16.2.7.3. SWOT Analysis
- 16.2.7.4. Recent Developments
- 16.2.7.5. Financials (Based on Availability)
- 16.2.8 International Business Machines Corporation
- 16.2.8.1. Overview
- 16.2.8.2. Products
- 16.2.8.3. SWOT Analysis
- 16.2.8.4. Recent Developments
- 16.2.8.5. Financials (Based on Availability)
- 16.2.9 Avaya Inc
- 16.2.9.1. Overview
- 16.2.9.2. Products
- 16.2.9.3. SWOT Analysis
- 16.2.9.4. Recent Developments
- 16.2.9.5. Financials (Based on Availability)
- 16.2.10 BT Group plc
- 16.2.10.1. Overview
- 16.2.10.2. Products
- 16.2.10.3. SWOT Analysis
- 16.2.10.4. Recent Developments
- 16.2.10.5. Financials (Based on Availability)
- 16.2.1 Polycom Inc *List Not Exhaustive
List of Figures
- Figure 1: Global UCaaS In Energy Market Revenue Breakdown (Million, %) by Region 2024 & 2032
- Figure 2: North America UCaaS In Energy Market Revenue (Million), by Country 2024 & 2032
- Figure 3: North America UCaaS In Energy Market Revenue Share (%), by Country 2024 & 2032
- Figure 4: Europe UCaaS In Energy Market Revenue (Million), by Country 2024 & 2032
- Figure 5: Europe UCaaS In Energy Market Revenue Share (%), by Country 2024 & 2032
- Figure 6: Asia Pacific UCaaS In Energy Market Revenue (Million), by Country 2024 & 2032
- Figure 7: Asia Pacific UCaaS In Energy Market Revenue Share (%), by Country 2024 & 2032
- Figure 8: Latin America UCaaS In Energy Market Revenue (Million), by Country 2024 & 2032
- Figure 9: Latin America UCaaS In Energy Market Revenue Share (%), by Country 2024 & 2032
- Figure 10: Middle East UCaaS In Energy Market Revenue (Million), by Country 2024 & 2032
- Figure 11: Middle East UCaaS In Energy Market Revenue Share (%), by Country 2024 & 2032
- Figure 12: North America UCaaS In Energy Market Revenue (Million), by Component 2024 & 2032
- Figure 13: North America UCaaS In Energy Market Revenue Share (%), by Component 2024 & 2032
- Figure 14: North America UCaaS In Energy Market Revenue (Million), by Deployment Model 2024 & 2032
- Figure 15: North America UCaaS In Energy Market Revenue Share (%), by Deployment Model 2024 & 2032
- Figure 16: North America UCaaS In Energy Market Revenue (Million), by Enterprise Size 2024 & 2032
- Figure 17: North America UCaaS In Energy Market Revenue Share (%), by Enterprise Size 2024 & 2032
- Figure 18: North America UCaaS In Energy Market Revenue (Million), by Country 2024 & 2032
- Figure 19: North America UCaaS In Energy Market Revenue Share (%), by Country 2024 & 2032
- Figure 20: Europe UCaaS In Energy Market Revenue (Million), by Component 2024 & 2032
- Figure 21: Europe UCaaS In Energy Market Revenue Share (%), by Component 2024 & 2032
- Figure 22: Europe UCaaS In Energy Market Revenue (Million), by Deployment Model 2024 & 2032
- Figure 23: Europe UCaaS In Energy Market Revenue Share (%), by Deployment Model 2024 & 2032
- Figure 24: Europe UCaaS In Energy Market Revenue (Million), by Enterprise Size 2024 & 2032
- Figure 25: Europe UCaaS In Energy Market Revenue Share (%), by Enterprise Size 2024 & 2032
- Figure 26: Europe UCaaS In Energy Market Revenue (Million), by Country 2024 & 2032
- Figure 27: Europe UCaaS In Energy Market Revenue Share (%), by Country 2024 & 2032
- Figure 28: Asia UCaaS In Energy Market Revenue (Million), by Component 2024 & 2032
- Figure 29: Asia UCaaS In Energy Market Revenue Share (%), by Component 2024 & 2032
- Figure 30: Asia UCaaS In Energy Market Revenue (Million), by Deployment Model 2024 & 2032
- Figure 31: Asia UCaaS In Energy Market Revenue Share (%), by Deployment Model 2024 & 2032
- Figure 32: Asia UCaaS In Energy Market Revenue (Million), by Enterprise Size 2024 & 2032
- Figure 33: Asia UCaaS In Energy Market Revenue Share (%), by Enterprise Size 2024 & 2032
- Figure 34: Asia UCaaS In Energy Market Revenue (Million), by Country 2024 & 2032
- Figure 35: Asia UCaaS In Energy Market Revenue Share (%), by Country 2024 & 2032
- Figure 36: Latin America UCaaS In Energy Market Revenue (Million), by Component 2024 & 2032
- Figure 37: Latin America UCaaS In Energy Market Revenue Share (%), by Component 2024 & 2032
- Figure 38: Latin America UCaaS In Energy Market Revenue (Million), by Deployment Model 2024 & 2032
- Figure 39: Latin America UCaaS In Energy Market Revenue Share (%), by Deployment Model 2024 & 2032
- Figure 40: Latin America UCaaS In Energy Market Revenue (Million), by Enterprise Size 2024 & 2032
- Figure 41: Latin America UCaaS In Energy Market Revenue Share (%), by Enterprise Size 2024 & 2032
- Figure 42: Latin America UCaaS In Energy Market Revenue (Million), by Country 2024 & 2032
- Figure 43: Latin America UCaaS In Energy Market Revenue Share (%), by Country 2024 & 2032
- Figure 44: Middle East and Africa UCaaS In Energy Market Revenue (Million), by Component 2024 & 2032
- Figure 45: Middle East and Africa UCaaS In Energy Market Revenue Share (%), by Component 2024 & 2032
- Figure 46: Middle East and Africa UCaaS In Energy Market Revenue (Million), by Deployment Model 2024 & 2032
- Figure 47: Middle East and Africa UCaaS In Energy Market Revenue Share (%), by Deployment Model 2024 & 2032
- Figure 48: Middle East and Africa UCaaS In Energy Market Revenue (Million), by Enterprise Size 2024 & 2032
- Figure 49: Middle East and Africa UCaaS In Energy Market Revenue Share (%), by Enterprise Size 2024 & 2032
- Figure 50: Middle East and Africa UCaaS In Energy Market Revenue (Million), by Country 2024 & 2032
- Figure 51: Middle East and Africa UCaaS In Energy Market Revenue Share (%), by Country 2024 & 2032
List of Tables
- Table 1: Global UCaaS In Energy Market Revenue Million Forecast, by Region 2019 & 2032
- Table 2: Global UCaaS In Energy Market Revenue Million Forecast, by Component 2019 & 2032
- Table 3: Global UCaaS In Energy Market Revenue Million Forecast, by Deployment Model 2019 & 2032
- Table 4: Global UCaaS In Energy Market Revenue Million Forecast, by Enterprise Size 2019 & 2032
- Table 5: Global UCaaS In Energy Market Revenue Million Forecast, by Region 2019 & 2032
- Table 6: Global UCaaS In Energy Market Revenue Million Forecast, by Country 2019 & 2032
- Table 7: UCaaS In Energy Market Revenue (Million) Forecast, by Application 2019 & 2032
- Table 8: Global UCaaS In Energy Market Revenue Million Forecast, by Country 2019 & 2032
- Table 9: UCaaS In Energy Market Revenue (Million) Forecast, by Application 2019 & 2032
- Table 10: Global UCaaS In Energy Market Revenue Million Forecast, by Country 2019 & 2032
- Table 11: UCaaS In Energy Market Revenue (Million) Forecast, by Application 2019 & 2032
- Table 12: Global UCaaS In Energy Market Revenue Million Forecast, by Country 2019 & 2032
- Table 13: UCaaS In Energy Market Revenue (Million) Forecast, by Application 2019 & 2032
- Table 14: Global UCaaS In Energy Market Revenue Million Forecast, by Country 2019 & 2032
- Table 15: UCaaS In Energy Market Revenue (Million) Forecast, by Application 2019 & 2032
- Table 16: Global UCaaS In Energy Market Revenue Million Forecast, by Component 2019 & 2032
- Table 17: Global UCaaS In Energy Market Revenue Million Forecast, by Deployment Model 2019 & 2032
- Table 18: Global UCaaS In Energy Market Revenue Million Forecast, by Enterprise Size 2019 & 2032
- Table 19: Global UCaaS In Energy Market Revenue Million Forecast, by Country 2019 & 2032
- Table 20: Global UCaaS In Energy Market Revenue Million Forecast, by Component 2019 & 2032
- Table 21: Global UCaaS In Energy Market Revenue Million Forecast, by Deployment Model 2019 & 2032
- Table 22: Global UCaaS In Energy Market Revenue Million Forecast, by Enterprise Size 2019 & 2032
- Table 23: Global UCaaS In Energy Market Revenue Million Forecast, by Country 2019 & 2032
- Table 24: Global UCaaS In Energy Market Revenue Million Forecast, by Component 2019 & 2032
- Table 25: Global UCaaS In Energy Market Revenue Million Forecast, by Deployment Model 2019 & 2032
- Table 26: Global UCaaS In Energy Market Revenue Million Forecast, by Enterprise Size 2019 & 2032
- Table 27: Global UCaaS In Energy Market Revenue Million Forecast, by Country 2019 & 2032
- Table 28: Global UCaaS In Energy Market Revenue Million Forecast, by Component 2019 & 2032
- Table 29: Global UCaaS In Energy Market Revenue Million Forecast, by Deployment Model 2019 & 2032
- Table 30: Global UCaaS In Energy Market Revenue Million Forecast, by Enterprise Size 2019 & 2032
- Table 31: Global UCaaS In Energy Market Revenue Million Forecast, by Country 2019 & 2032
- Table 32: Global UCaaS In Energy Market Revenue Million Forecast, by Component 2019 & 2032
- Table 33: Global UCaaS In Energy Market Revenue Million Forecast, by Deployment Model 2019 & 2032
- Table 34: Global UCaaS In Energy Market Revenue Million Forecast, by Enterprise Size 2019 & 2032
- Table 35: Global UCaaS In Energy Market Revenue Million Forecast, by Country 2019 & 2032
Frequently Asked Questions
1. What is the projected Compound Annual Growth Rate (CAGR) of the UCaaS In Energy Market?
The projected CAGR is approximately 12.08%.
2. Which companies are prominent players in the UCaaS In Energy Market?
Key companies in the market include Polycom Inc *List Not Exhaustive, Google LLC, Verizon Enterprise Solutions LLC, West Corporation, Alcatel-Lucent(Nokia Corporation), Cisco Systems Inc, Microsoft Corporation, International Business Machines Corporation, Avaya Inc, BT Group plc.
3. What are the main segments of the UCaaS In Energy Market?
The market segments include Component, Deployment Model, Enterprise Size.
4. Can you provide details about the market size?
The market size is estimated to be USD 1.78 Million as of 2022.
5. What are some drivers contributing to market growth?
Proliferation of Cloud Based Ecosystem will Act as a Driver; Improvement of Communication Technology.
6. What are the notable trends driving market growth?
Proliferation of Cloud Based Ecosystem to Drive the Market Growth.
7. Are there any restraints impacting market growth?
Data Security Concerns will Remain a Challenge to the Growth of the Market.
8. Can you provide examples of recent developments in the market?
May 2023: Access4, a leading Unified Communication-as-a-Service (UCaaS) provider, has unveiled a new SMS service, demonstrating its commitment to enhancing partner network growth and bolstering customer retention.
9. What pricing options are available for accessing the report?
Pricing options include single-user, multi-user, and enterprise licenses priced at USD 4750, USD 5250, and USD 8750 respectively.
10. Is the market size provided in terms of value or volume?
The market size is provided in terms of value, measured in Million.
11. Are there any specific market keywords associated with the report?
Yes, the market keyword associated with the report is "UCaaS In Energy Market," which aids in identifying and referencing the specific market segment covered.
12. How do I determine which pricing option suits my needs best?
The pricing options vary based on user requirements and access needs. Individual users may opt for single-user licenses, while businesses requiring broader access may choose multi-user or enterprise licenses for cost-effective access to the report.
13. Are there any additional resources or data provided in the UCaaS In Energy Market report?
While the report offers comprehensive insights, it's advisable to review the specific contents or supplementary materials provided to ascertain if additional resources or data are available.
14. How can I stay updated on further developments or reports in the UCaaS In Energy Market?
To stay informed about further developments, trends, and reports in the UCaaS In Energy Market, consider subscribing to industry newsletters, following relevant companies and organizations, or regularly checking reputable industry news sources and publications.
Methodology
Step 1 - Identification of Relevant Samples Size from Population Database


Step 2 - Approaches for Defining Global Market Size (Value, Volume* & Price*)

Note*: In applicable scenarios
Step 3 - Data Sources
Primary Research
- Web Analytics
- Survey Reports
- Research Institute
- Latest Research Reports
- Opinion Leaders
Secondary Research
- Annual Reports
- White Paper
- Latest Press Release
- Industry Association
- Paid Database
- Investor Presentations

Step 4 - Data Triangulation
Involves using different sources of information in order to increase the validity of a study
These sources are likely to be stakeholders in a program - participants, other researchers, program staff, other community members, and so on.
Then we put all data in single framework & apply various statistical tools to find out the dynamic on the market.
During the analysis stage, feedback from the stakeholder groups would be compared to determine areas of agreement as well as areas of divergence


