
Key Insights
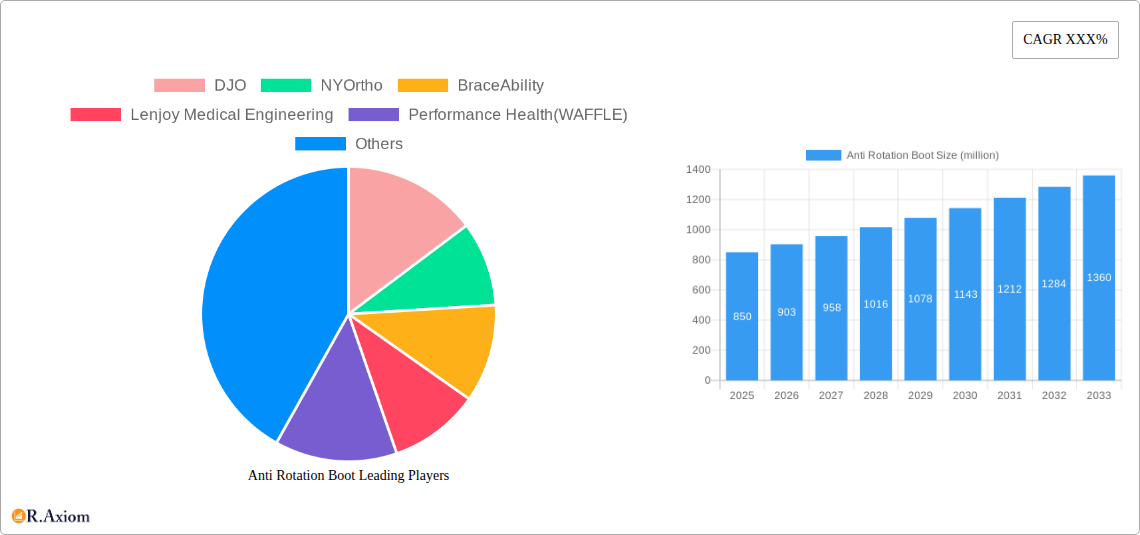
The global Anti-Rotation Boot market is poised for robust expansion, projected to reach an estimated market size of $850 million by 2025, with a compelling Compound Annual Growth Rate (CAGR) of 6.2% anticipated throughout the forecast period of 2025-2033. This growth trajectory is primarily fueled by a confluence of escalating sports-related injuries, a growing awareness of preventive measures among athletes, and the increasing prevalence of orthopedic conditions necessitating post-operative support and rehabilitation. The rising global demand for advanced orthopedic devices that offer superior immobilization and protection against rotational forces is a significant driver. Furthermore, the aging global population, which is more susceptible to bone fractures and joint issues, contributes to a sustained demand for effective orthotic solutions. Technological advancements leading to lighter, more comfortable, and user-friendly designs are also playing a crucial role in market penetration.
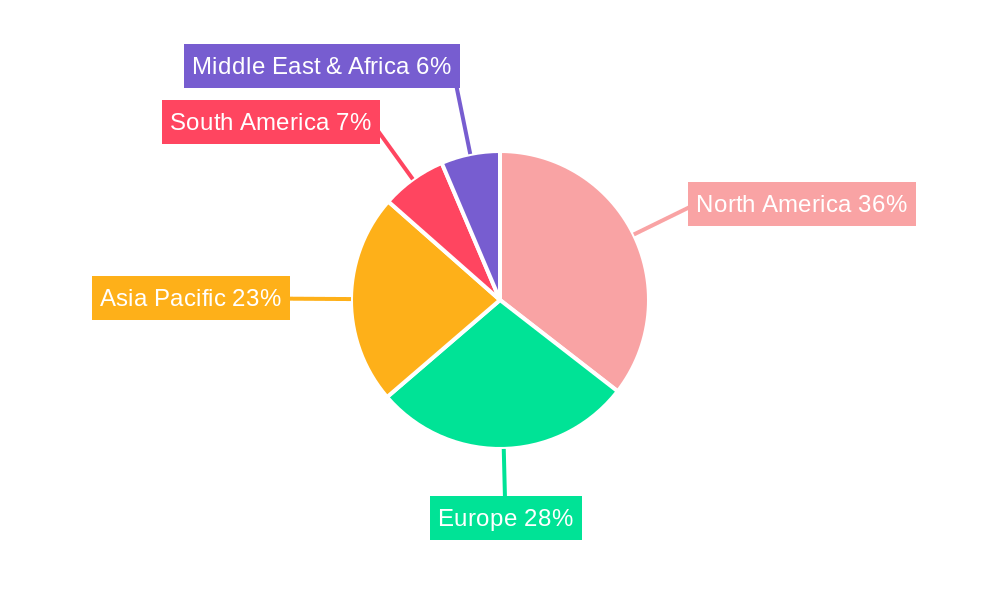
The market exhibits distinct segmentation based on application and product type, catering to diverse user needs. In terms of application, both male and female segments are significant, reflecting the broad applicability of anti-rotation boots across genders for various orthopedic concerns. The product type segmentation highlights the dominance of Walking Boots due to their prevalence in treating common lower limb injuries, while Non-walking Boots address more specific post-surgical or severe injury requirements. Geographically, North America currently leads the market, driven by high healthcare expenditure, advanced medical infrastructure, and a strong emphasis on sports participation. However, the Asia Pacific region is expected to witness the fastest growth, fueled by an expanding middle class, increasing disposable income, and a growing adoption of modern healthcare practices. Restraints, such as the high cost of advanced devices and the availability of alternative treatment options, are being mitigated by continuous innovation and a focus on affordability.
Anti Rotation Boot Market Concentration & Innovation
The anti-rotation boot market, a critical segment within orthopedic bracing solutions, exhibits a moderate to high concentration, with key players like DJO, NYOrtho, BraceAbility, Lenjoy Medical Engineering, Performance Health (WAFFLE), Lakeland Orthotics, TIDI Products, and Restorative Medical commanding significant market share. This concentration is driven by substantial investments in research and development, stringent regulatory approvals for medical devices, and established distribution networks. Innovation within this space is primarily focused on enhancing patient comfort, improving immobilization effectiveness, and developing lighter, more durable materials. Technologies such as advanced composite materials, adjustable strapping systems, and integrated gait control mechanisms are becoming standard. Regulatory frameworks, including FDA approvals in the US and CE marking in Europe, play a pivotal role in market entry and product validation, influencing the pace of innovation and market access. While direct product substitutes offering identical anti-rotation functionality are limited, traditional casting and other orthopedic devices can be considered indirect substitutes in certain recovery scenarios. End-user trends are increasingly leaning towards personalized rehabilitation programs and patient-centric designs, driving demand for boots that offer adjustable settings and ease of use. Merger and acquisition (M&A) activities are a notable aspect of market dynamics, with strategic acquisitions aimed at expanding product portfolios, gaining access to new technologies, and consolidating market presence. Deal values for such acquisitions are projected to range from tens of millions to hundreds of millions of dollars, reflecting the strategic importance of orthopedic bracing companies.
Anti Rotation Boot Industry Trends & Insights
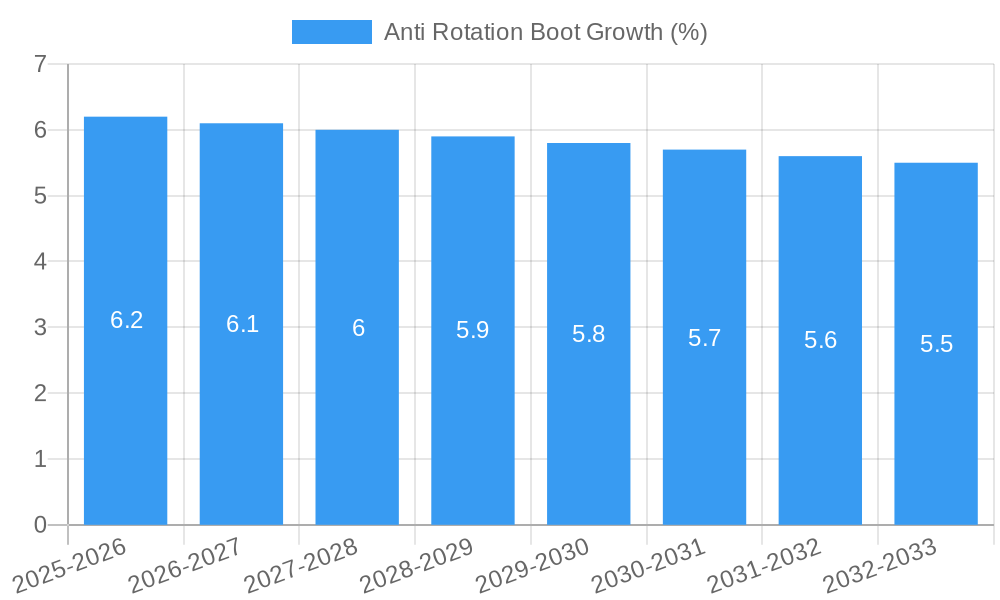
The global anti-rotation boot market is poised for robust growth, driven by a confluence of factors that underscore the increasing demand for effective orthopedic recovery solutions. The market is projected to expand at a Compound Annual Growth Rate (CAGR) of approximately 5.5% over the forecast period of 2025–2033. This growth is underpinned by a rising incidence of sports-related injuries, an aging global population prone to fractures and degenerative conditions, and an increasing awareness among healthcare professionals and patients regarding the benefits of specialized orthopedic bracing. Technological advancements are acting as significant disruptors and enablers within the industry. Innovations in material science have led to the development of lighter, more breathable, and more durable anti-rotation boots, enhancing patient compliance and comfort. Furthermore, the integration of smart technologies, such as sensors for gait analysis and pressure mapping, is emerging, offering personalized rehabilitation insights and optimizing recovery outcomes. Consumer preferences are shifting towards user-friendly designs that allow for easy application and adjustment, reducing the burden on both patients and caregivers. The demand for aesthetically pleasing and discreet orthopedic devices is also on the rise, particularly among younger demographics. Competitive dynamics are characterized by a blend of established players and emerging innovators. Companies are differentiating themselves through product features, clinical efficacy, distribution reach, and pricing strategies. The market penetration of advanced anti-rotation boot technologies is expected to increase significantly as healthcare systems recognize their cost-effectiveness in reducing complications and hospital stays. The study period from 2019 to 2033, with a base year of 2025, provides a comprehensive view of historical performance and future projections. The estimated market size in 2025 is anticipated to be in the range of $1.2 billion to $1.5 billion, with projections indicating substantial growth in the subsequent years due to these prevailing trends.
Dominant Markets & Segments in Anti Rotation Boot
The anti-rotation boot market demonstrates clear dominance across specific regions and product segments, driven by a complex interplay of demographic, economic, and healthcare-related factors.
Leading Region and Country Dominance
- North America currently leads the global anti-rotation boot market, largely attributed to a high prevalence of sports-related injuries, a sophisticated healthcare infrastructure, widespread adoption of advanced medical technologies, and favorable reimbursement policies for orthopedic devices. The United States, in particular, is a powerhouse due to its large population, significant investment in sports at both amateur and professional levels, and a strong emphasis on post-operative care and rehabilitation.
- Europe follows closely, with countries like Germany, the UK, and France showing substantial market share. Factors contributing to this include an aging demographic susceptible to fractures, robust healthcare systems with a focus on rehabilitation, and increasing awareness of advanced orthopedic solutions.
- Asia-Pacific is the fastest-growing region, fueled by rising disposable incomes, increasing healthcare expenditure, growing sports participation, and a greater awareness of orthopedic health. Countries like China and India are key contributors to this growth, driven by their vast populations and improving access to healthcare.
Application Segment Dominance
- Male segment: This segment is a significant contributor to the anti-rotation boot market. The higher participation rates in contact sports and physically demanding occupations among males contribute to a greater incidence of injuries requiring these specialized boots. The market size for the male segment is estimated to be in the range of $700 million to $900 million in 2025. Key drivers include specialized sports bracing needs and occupational safety regulations.
- Female segment: The female segment is also experiencing steady growth. Increased participation in sports and fitness activities, coupled with age-related conditions, is driving demand. The market size for the female segment is projected to be around $500 million to $650 million in 2025. Drivers include fitness-related injuries and a growing awareness of proactive orthopedic care.
Type Segment Dominance
- Walking Boot: This segment holds the largest market share within the anti-rotation boot industry. Walking boots offer a balance of immobilization and mobility, making them ideal for a wide range of foot and ankle injuries, including fractures, sprains, and post-surgical recovery. Their versatility and relative comfort contribute to their widespread adoption. The market size for walking boots is estimated to be between $900 million and $1.1 billion in 2025. Key drivers include post-operative care, fracture management, and ankle ligament injuries.
- Non-walking Boot: While smaller in market share, the non-walking boot segment is crucial for severe immobility requirements, often used in cases of complex fractures, significant instability, or during the initial critical recovery phases. These boots provide maximum immobilization to ensure proper healing. The market size for non-walking boots is projected to be around $300 million to $400 million in 2025. Drivers include severe trauma, complex fractures, and post-surgical stabilization.
Economic policies that support healthcare access and innovation, coupled with improving infrastructure for distribution and patient care, are instrumental in solidifying the dominance of these regions and segments. The continuous development of tailored solutions for each application and type further strengthens their respective market positions.
Anti Rotation Boot Product Developments
Recent product developments in the anti-rotation boot market are centered on enhancing patient outcomes through innovative design and material science. Innovations include the introduction of ultra-lightweight composite materials that reduce user fatigue, advanced pneumatic or hydraulic systems for precise pressure adjustment, and breathable, moisture-wicking liners for improved hygiene and comfort. Some newer models feature integrated modular components that allow for customization based on specific injury types and recovery stages. These advancements aim to provide superior immobilization, promote faster healing, and minimize the risk of secondary injuries, thereby offering a distinct competitive advantage to manufacturers that successfully integrate these technologies into their product lines.
Report Scope & Segmentation Analysis
This comprehensive report analyzes the Anti Rotation Boot market across key segmentations to provide granular insights into market dynamics.
Application Segmentation
- Male: This segment encompasses anti-rotation boots designed for male anatomical needs, addressing a higher incidence of sports-related and occupational injuries. Projections indicate a steady growth rate for this segment, with a market size estimated to be between $700 million and $900 million in 2025. Competitive dynamics are influenced by specialized sports bracing needs and safety regulations.
- Female: This segment focuses on anti-rotation boots tailored for female users, catering to fitness-related injuries and age-related conditions. Growth is anticipated to be robust, with a projected market size of $500 million to $650 million in 2025. Awareness of proactive orthopedic care and targeted product designs are key competitive factors.
Type Segmentation
- Walking Boot: This segment represents the largest share of the market, comprising boots designed to allow for weight-bearing and ambulation during recovery. The market size is estimated to be between $900 million and $1.1 billion in 2025, driven by widespread use in fracture management and post-operative care.
- Non-walking Boot: This segment includes boots providing absolute immobilization, essential for severe injuries. Market projections place its size at $300 million to $400 million in 2025. Competitive dynamics revolve around offering the highest level of stability for critical healing phases.
Key Drivers of Anti Rotation Boot Growth
The growth of the anti-rotation boot market is propelled by several key factors. Technologically, advancements in material science leading to lighter, more durable, and comfortable boots are significant drivers. Economically, increasing healthcare expenditure globally and growing disposable incomes, especially in emerging economies, enable greater access to advanced orthopedic devices. Regulatory bodies like the FDA continue to approve innovative products, further stimulating market expansion. Furthermore, the rising prevalence of sports injuries and an aging global population prone to bone-related conditions are creating a sustained demand for effective rehabilitation solutions.
Challenges in the Anti Rotation Boot Sector
Despite robust growth, the anti-rotation boot sector faces several challenges. Regulatory hurdles for new product approvals can be time-consuming and costly, potentially delaying market entry for innovative solutions. Supply chain disruptions, as experienced in recent years, can impact the availability and cost of raw materials, affecting production volumes. Moreover, competitive pressures from both established players and new entrants can lead to price wars, impacting profit margins. The perception of discomfort associated with wearing boots, even with advanced designs, can also be a restraint, although this is diminishing with ongoing product development.
Emerging Opportunities in Anti Rotation Boot
Emerging opportunities in the anti-rotation boot market are vast and diverse. The integration of smart technologies, such as embedded sensors for remote patient monitoring and gait analysis, presents a significant growth avenue. The expansion into untapped emerging markets in Asia-Pacific and Latin America, driven by increasing healthcare awareness and infrastructure development, offers substantial potential. Furthermore, the development of aesthetically pleasing and discreet designs, catering to a growing demand for less conspicuous medical devices, especially among younger demographics, represents a niche but promising opportunity. Personalized rehabilitation solutions are also a key trend, opening doors for customized boot designs.
Leading Players in the Anti Rotation Boot Market
- DJO
- NYOrtho
- BraceAbility
- Lenjoy Medical Engineering
- Performance Health (WAFFLE)
- Lakeland Orthotics
- TIDI Products
- Restorative Medical
Key Developments in Anti Rotation Boot Industry
- 2023/08: DJO launches a new generation of lightweight, adjustable walking boots with enhanced breathability features, aiming to improve patient compliance and comfort.
- 2022/11: Performance Health (WAFFLE) introduces a novel non-walking boot design incorporating advanced shock absorption technology to minimize impact during patient transfers.
- 2022/05: BraceAbility expands its product line with a focus on customizable anti-rotation boots for specific sports-related injuries.
- 2021/10: NYOrtho secures FDA approval for a new pneumatic brace system designed for superior ankle immobilization and pain management.
- 2020/03: Lenjoy Medical Engineering announces strategic partnerships to expand its distribution network into underserved regions in Southeast Asia.
Strategic Outlook for Anti Rotation Boot Market
The strategic outlook for the anti-rotation boot market is exceptionally positive, driven by continuous innovation and a growing global demand for effective orthopedic recovery solutions. Future growth catalysts include the increasing adoption of telehealth and remote monitoring, which will integrate seamlessly with smart anti-rotation boot technologies. Expanding into emerging markets with tailored product offerings and competitive pricing will be crucial for market penetration. Furthermore, a continued focus on patient comfort, durability, and ease of use will remain paramount for companies seeking to gain a competitive edge and capitalize on the substantial opportunities within this evolving healthcare segment.
Anti Rotation Boot Segmentation
-
1. Application
- 1.1. Male
- 1.2. Female
-
2. Type
- 2.1. Walking Boot
- 2.2. Non-walking Boot
Anti Rotation Boot Segmentation By Geography
-
1. North America
- 1.1. United States
- 1.2. Canada
- 1.3. Mexico
-
2. South America
- 2.1. Brazil
- 2.2. Argentina
- 2.3. Rest of South America
-
3. Europe
- 3.1. United Kingdom
- 3.2. Germany
- 3.3. France
- 3.4. Italy
- 3.5. Spain
- 3.6. Russia
- 3.7. Benelux
- 3.8. Nordics
- 3.9. Rest of Europe
-
4. Middle East & Africa
- 4.1. Turkey
- 4.2. Israel
- 4.3. GCC
- 4.4. North Africa
- 4.5. South Africa
- 4.6. Rest of Middle East & Africa
-
5. Asia Pacific
- 5.1. China
- 5.2. India
- 5.3. Japan
- 5.4. South Korea
- 5.5. ASEAN
- 5.6. Oceania
- 5.7. Rest of Asia Pacific
Anti Rotation Boot REPORT HIGHLIGHTS
| Aspects | Details |
|---|---|
| Study Period | 2019-2033 |
| Base Year | 2024 |
| Estimated Year | 2025 |
| Forecast Period | 2025-2033 |
| Historical Period | 2019-2024 |
| Growth Rate | CAGR of XXX% from 2019-2033 |
| Segmentation |
|
Table of Contents
- 1. Introduction
- 1.1. Research Scope
- 1.2. Market Segmentation
- 1.3. Research Methodology
- 1.4. Definitions and Assumptions
- 2. Executive Summary
- 2.1. Introduction
- 3. Market Dynamics
- 3.1. Introduction
- 3.2. Market Drivers
- 3.3. Market Restrains
- 3.4. Market Trends
- 4. Market Factor Analysis
- 4.1. Porters Five Forces
- 4.2. Supply/Value Chain
- 4.3. PESTEL analysis
- 4.4. Market Entropy
- 4.5. Patent/Trademark Analysis
- 5. Global Anti Rotation Boot Analysis, Insights and Forecast, 2019-2031
- 5.1. Market Analysis, Insights and Forecast - by Application
- 5.1.1. Male
- 5.1.2. Female
- 5.2. Market Analysis, Insights and Forecast - by Type
- 5.2.1. Walking Boot
- 5.2.2. Non-walking Boot
- 5.3. Market Analysis, Insights and Forecast - by Region
- 5.3.1. North America
- 5.3.2. South America
- 5.3.3. Europe
- 5.3.4. Middle East & Africa
- 5.3.5. Asia Pacific
- 5.1. Market Analysis, Insights and Forecast - by Application
- 6. North America Anti Rotation Boot Analysis, Insights and Forecast, 2019-2031
- 6.1. Market Analysis, Insights and Forecast - by Application
- 6.1.1. Male
- 6.1.2. Female
- 6.2. Market Analysis, Insights and Forecast - by Type
- 6.2.1. Walking Boot
- 6.2.2. Non-walking Boot
- 6.1. Market Analysis, Insights and Forecast - by Application
- 7. South America Anti Rotation Boot Analysis, Insights and Forecast, 2019-2031
- 7.1. Market Analysis, Insights and Forecast - by Application
- 7.1.1. Male
- 7.1.2. Female
- 7.2. Market Analysis, Insights and Forecast - by Type
- 7.2.1. Walking Boot
- 7.2.2. Non-walking Boot
- 7.1. Market Analysis, Insights and Forecast - by Application
- 8. Europe Anti Rotation Boot Analysis, Insights and Forecast, 2019-2031
- 8.1. Market Analysis, Insights and Forecast - by Application
- 8.1.1. Male
- 8.1.2. Female
- 8.2. Market Analysis, Insights and Forecast - by Type
- 8.2.1. Walking Boot
- 8.2.2. Non-walking Boot
- 8.1. Market Analysis, Insights and Forecast - by Application
- 9. Middle East & Africa Anti Rotation Boot Analysis, Insights and Forecast, 2019-2031
- 9.1. Market Analysis, Insights and Forecast - by Application
- 9.1.1. Male
- 9.1.2. Female
- 9.2. Market Analysis, Insights and Forecast - by Type
- 9.2.1. Walking Boot
- 9.2.2. Non-walking Boot
- 9.1. Market Analysis, Insights and Forecast - by Application
- 10. Asia Pacific Anti Rotation Boot Analysis, Insights and Forecast, 2019-2031
- 10.1. Market Analysis, Insights and Forecast - by Application
- 10.1.1. Male
- 10.1.2. Female
- 10.2. Market Analysis, Insights and Forecast - by Type
- 10.2.1. Walking Boot
- 10.2.2. Non-walking Boot
- 10.1. Market Analysis, Insights and Forecast - by Application
- 11. Competitive Analysis
- 11.1. Global Market Share Analysis 2024
- 11.2. Company Profiles
- 11.2.1 DJO
- 11.2.1.1. Overview
- 11.2.1.2. Products
- 11.2.1.3. SWOT Analysis
- 11.2.1.4. Recent Developments
- 11.2.1.5. Financials (Based on Availability)
- 11.2.2 NYOrtho
- 11.2.2.1. Overview
- 11.2.2.2. Products
- 11.2.2.3. SWOT Analysis
- 11.2.2.4. Recent Developments
- 11.2.2.5. Financials (Based on Availability)
- 11.2.3 BraceAbility
- 11.2.3.1. Overview
- 11.2.3.2. Products
- 11.2.3.3. SWOT Analysis
- 11.2.3.4. Recent Developments
- 11.2.3.5. Financials (Based on Availability)
- 11.2.4 Lenjoy Medical Engineering
- 11.2.4.1. Overview
- 11.2.4.2. Products
- 11.2.4.3. SWOT Analysis
- 11.2.4.4. Recent Developments
- 11.2.4.5. Financials (Based on Availability)
- 11.2.5 Performance Health(WAFFLE)
- 11.2.5.1. Overview
- 11.2.5.2. Products
- 11.2.5.3. SWOT Analysis
- 11.2.5.4. Recent Developments
- 11.2.5.5. Financials (Based on Availability)
- 11.2.6 Lakeland Orthotics
- 11.2.6.1. Overview
- 11.2.6.2. Products
- 11.2.6.3. SWOT Analysis
- 11.2.6.4. Recent Developments
- 11.2.6.5. Financials (Based on Availability)
- 11.2.7 TIDI Products
- 11.2.7.1. Overview
- 11.2.7.2. Products
- 11.2.7.3. SWOT Analysis
- 11.2.7.4. Recent Developments
- 11.2.7.5. Financials (Based on Availability)
- 11.2.8 Restorative Medical
- 11.2.8.1. Overview
- 11.2.8.2. Products
- 11.2.8.3. SWOT Analysis
- 11.2.8.4. Recent Developments
- 11.2.8.5. Financials (Based on Availability)
- 11.2.1 DJO
List of Figures
- Figure 1: Global Anti Rotation Boot Revenue Breakdown (million, %) by Region 2024 & 2032
- Figure 2: Global Anti Rotation Boot Volume Breakdown (K, %) by Region 2024 & 2032
- Figure 3: North America Anti Rotation Boot Revenue (million), by Application 2024 & 2032
- Figure 4: North America Anti Rotation Boot Volume (K), by Application 2024 & 2032
- Figure 5: North America Anti Rotation Boot Revenue Share (%), by Application 2024 & 2032
- Figure 6: North America Anti Rotation Boot Volume Share (%), by Application 2024 & 2032
- Figure 7: North America Anti Rotation Boot Revenue (million), by Type 2024 & 2032
- Figure 8: North America Anti Rotation Boot Volume (K), by Type 2024 & 2032
- Figure 9: North America Anti Rotation Boot Revenue Share (%), by Type 2024 & 2032
- Figure 10: North America Anti Rotation Boot Volume Share (%), by Type 2024 & 2032
- Figure 11: North America Anti Rotation Boot Revenue (million), by Country 2024 & 2032
- Figure 12: North America Anti Rotation Boot Volume (K), by Country 2024 & 2032
- Figure 13: North America Anti Rotation Boot Revenue Share (%), by Country 2024 & 2032
- Figure 14: North America Anti Rotation Boot Volume Share (%), by Country 2024 & 2032
- Figure 15: South America Anti Rotation Boot Revenue (million), by Application 2024 & 2032
- Figure 16: South America Anti Rotation Boot Volume (K), by Application 2024 & 2032
- Figure 17: South America Anti Rotation Boot Revenue Share (%), by Application 2024 & 2032
- Figure 18: South America Anti Rotation Boot Volume Share (%), by Application 2024 & 2032
- Figure 19: South America Anti Rotation Boot Revenue (million), by Type 2024 & 2032
- Figure 20: South America Anti Rotation Boot Volume (K), by Type 2024 & 2032
- Figure 21: South America Anti Rotation Boot Revenue Share (%), by Type 2024 & 2032
- Figure 22: South America Anti Rotation Boot Volume Share (%), by Type 2024 & 2032
- Figure 23: South America Anti Rotation Boot Revenue (million), by Country 2024 & 2032
- Figure 24: South America Anti Rotation Boot Volume (K), by Country 2024 & 2032
- Figure 25: South America Anti Rotation Boot Revenue Share (%), by Country 2024 & 2032
- Figure 26: South America Anti Rotation Boot Volume Share (%), by Country 2024 & 2032
- Figure 27: Europe Anti Rotation Boot Revenue (million), by Application 2024 & 2032
- Figure 28: Europe Anti Rotation Boot Volume (K), by Application 2024 & 2032
- Figure 29: Europe Anti Rotation Boot Revenue Share (%), by Application 2024 & 2032
- Figure 30: Europe Anti Rotation Boot Volume Share (%), by Application 2024 & 2032
- Figure 31: Europe Anti Rotation Boot Revenue (million), by Type 2024 & 2032
- Figure 32: Europe Anti Rotation Boot Volume (K), by Type 2024 & 2032
- Figure 33: Europe Anti Rotation Boot Revenue Share (%), by Type 2024 & 2032
- Figure 34: Europe Anti Rotation Boot Volume Share (%), by Type 2024 & 2032
- Figure 35: Europe Anti Rotation Boot Revenue (million), by Country 2024 & 2032
- Figure 36: Europe Anti Rotation Boot Volume (K), by Country 2024 & 2032
- Figure 37: Europe Anti Rotation Boot Revenue Share (%), by Country 2024 & 2032
- Figure 38: Europe Anti Rotation Boot Volume Share (%), by Country 2024 & 2032
- Figure 39: Middle East & Africa Anti Rotation Boot Revenue (million), by Application 2024 & 2032
- Figure 40: Middle East & Africa Anti Rotation Boot Volume (K), by Application 2024 & 2032
- Figure 41: Middle East & Africa Anti Rotation Boot Revenue Share (%), by Application 2024 & 2032
- Figure 42: Middle East & Africa Anti Rotation Boot Volume Share (%), by Application 2024 & 2032
- Figure 43: Middle East & Africa Anti Rotation Boot Revenue (million), by Type 2024 & 2032
- Figure 44: Middle East & Africa Anti Rotation Boot Volume (K), by Type 2024 & 2032
- Figure 45: Middle East & Africa Anti Rotation Boot Revenue Share (%), by Type 2024 & 2032
- Figure 46: Middle East & Africa Anti Rotation Boot Volume Share (%), by Type 2024 & 2032
- Figure 47: Middle East & Africa Anti Rotation Boot Revenue (million), by Country 2024 & 2032
- Figure 48: Middle East & Africa Anti Rotation Boot Volume (K), by Country 2024 & 2032
- Figure 49: Middle East & Africa Anti Rotation Boot Revenue Share (%), by Country 2024 & 2032
- Figure 50: Middle East & Africa Anti Rotation Boot Volume Share (%), by Country 2024 & 2032
- Figure 51: Asia Pacific Anti Rotation Boot Revenue (million), by Application 2024 & 2032
- Figure 52: Asia Pacific Anti Rotation Boot Volume (K), by Application 2024 & 2032
- Figure 53: Asia Pacific Anti Rotation Boot Revenue Share (%), by Application 2024 & 2032
- Figure 54: Asia Pacific Anti Rotation Boot Volume Share (%), by Application 2024 & 2032
- Figure 55: Asia Pacific Anti Rotation Boot Revenue (million), by Type 2024 & 2032
- Figure 56: Asia Pacific Anti Rotation Boot Volume (K), by Type 2024 & 2032
- Figure 57: Asia Pacific Anti Rotation Boot Revenue Share (%), by Type 2024 & 2032
- Figure 58: Asia Pacific Anti Rotation Boot Volume Share (%), by Type 2024 & 2032
- Figure 59: Asia Pacific Anti Rotation Boot Revenue (million), by Country 2024 & 2032
- Figure 60: Asia Pacific Anti Rotation Boot Volume (K), by Country 2024 & 2032
- Figure 61: Asia Pacific Anti Rotation Boot Revenue Share (%), by Country 2024 & 2032
- Figure 62: Asia Pacific Anti Rotation Boot Volume Share (%), by Country 2024 & 2032
List of Tables
- Table 1: Global Anti Rotation Boot Revenue million Forecast, by Region 2019 & 2032
- Table 2: Global Anti Rotation Boot Volume K Forecast, by Region 2019 & 2032
- Table 3: Global Anti Rotation Boot Revenue million Forecast, by Application 2019 & 2032
- Table 4: Global Anti Rotation Boot Volume K Forecast, by Application 2019 & 2032
- Table 5: Global Anti Rotation Boot Revenue million Forecast, by Type 2019 & 2032
- Table 6: Global Anti Rotation Boot Volume K Forecast, by Type 2019 & 2032
- Table 7: Global Anti Rotation Boot Revenue million Forecast, by Region 2019 & 2032
- Table 8: Global Anti Rotation Boot Volume K Forecast, by Region 2019 & 2032
- Table 9: Global Anti Rotation Boot Revenue million Forecast, by Application 2019 & 2032
- Table 10: Global Anti Rotation Boot Volume K Forecast, by Application 2019 & 2032
- Table 11: Global Anti Rotation Boot Revenue million Forecast, by Type 2019 & 2032
- Table 12: Global Anti Rotation Boot Volume K Forecast, by Type 2019 & 2032
- Table 13: Global Anti Rotation Boot Revenue million Forecast, by Country 2019 & 2032
- Table 14: Global Anti Rotation Boot Volume K Forecast, by Country 2019 & 2032
- Table 15: United States Anti Rotation Boot Revenue (million) Forecast, by Application 2019 & 2032
- Table 16: United States Anti Rotation Boot Volume (K) Forecast, by Application 2019 & 2032
- Table 17: Canada Anti Rotation Boot Revenue (million) Forecast, by Application 2019 & 2032
- Table 18: Canada Anti Rotation Boot Volume (K) Forecast, by Application 2019 & 2032
- Table 19: Mexico Anti Rotation Boot Revenue (million) Forecast, by Application 2019 & 2032
- Table 20: Mexico Anti Rotation Boot Volume (K) Forecast, by Application 2019 & 2032
- Table 21: Global Anti Rotation Boot Revenue million Forecast, by Application 2019 & 2032
- Table 22: Global Anti Rotation Boot Volume K Forecast, by Application 2019 & 2032
- Table 23: Global Anti Rotation Boot Revenue million Forecast, by Type 2019 & 2032
- Table 24: Global Anti Rotation Boot Volume K Forecast, by Type 2019 & 2032
- Table 25: Global Anti Rotation Boot Revenue million Forecast, by Country 2019 & 2032
- Table 26: Global Anti Rotation Boot Volume K Forecast, by Country 2019 & 2032
- Table 27: Brazil Anti Rotation Boot Revenue (million) Forecast, by Application 2019 & 2032
- Table 28: Brazil Anti Rotation Boot Volume (K) Forecast, by Application 2019 & 2032
- Table 29: Argentina Anti Rotation Boot Revenue (million) Forecast, by Application 2019 & 2032
- Table 30: Argentina Anti Rotation Boot Volume (K) Forecast, by Application 2019 & 2032
- Table 31: Rest of South America Anti Rotation Boot Revenue (million) Forecast, by Application 2019 & 2032
- Table 32: Rest of South America Anti Rotation Boot Volume (K) Forecast, by Application 2019 & 2032
- Table 33: Global Anti Rotation Boot Revenue million Forecast, by Application 2019 & 2032
- Table 34: Global Anti Rotation Boot Volume K Forecast, by Application 2019 & 2032
- Table 35: Global Anti Rotation Boot Revenue million Forecast, by Type 2019 & 2032
- Table 36: Global Anti Rotation Boot Volume K Forecast, by Type 2019 & 2032
- Table 37: Global Anti Rotation Boot Revenue million Forecast, by Country 2019 & 2032
- Table 38: Global Anti Rotation Boot Volume K Forecast, by Country 2019 & 2032
- Table 39: United Kingdom Anti Rotation Boot Revenue (million) Forecast, by Application 2019 & 2032
- Table 40: United Kingdom Anti Rotation Boot Volume (K) Forecast, by Application 2019 & 2032
- Table 41: Germany Anti Rotation Boot Revenue (million) Forecast, by Application 2019 & 2032
- Table 42: Germany Anti Rotation Boot Volume (K) Forecast, by Application 2019 & 2032
- Table 43: France Anti Rotation Boot Revenue (million) Forecast, by Application 2019 & 2032
- Table 44: France Anti Rotation Boot Volume (K) Forecast, by Application 2019 & 2032
- Table 45: Italy Anti Rotation Boot Revenue (million) Forecast, by Application 2019 & 2032
- Table 46: Italy Anti Rotation Boot Volume (K) Forecast, by Application 2019 & 2032
- Table 47: Spain Anti Rotation Boot Revenue (million) Forecast, by Application 2019 & 2032
- Table 48: Spain Anti Rotation Boot Volume (K) Forecast, by Application 2019 & 2032
- Table 49: Russia Anti Rotation Boot Revenue (million) Forecast, by Application 2019 & 2032
- Table 50: Russia Anti Rotation Boot Volume (K) Forecast, by Application 2019 & 2032
- Table 51: Benelux Anti Rotation Boot Revenue (million) Forecast, by Application 2019 & 2032
- Table 52: Benelux Anti Rotation Boot Volume (K) Forecast, by Application 2019 & 2032
- Table 53: Nordics Anti Rotation Boot Revenue (million) Forecast, by Application 2019 & 2032
- Table 54: Nordics Anti Rotation Boot Volume (K) Forecast, by Application 2019 & 2032
- Table 55: Rest of Europe Anti Rotation Boot Revenue (million) Forecast, by Application 2019 & 2032
- Table 56: Rest of Europe Anti Rotation Boot Volume (K) Forecast, by Application 2019 & 2032
- Table 57: Global Anti Rotation Boot Revenue million Forecast, by Application 2019 & 2032
- Table 58: Global Anti Rotation Boot Volume K Forecast, by Application 2019 & 2032
- Table 59: Global Anti Rotation Boot Revenue million Forecast, by Type 2019 & 2032
- Table 60: Global Anti Rotation Boot Volume K Forecast, by Type 2019 & 2032
- Table 61: Global Anti Rotation Boot Revenue million Forecast, by Country 2019 & 2032
- Table 62: Global Anti Rotation Boot Volume K Forecast, by Country 2019 & 2032
- Table 63: Turkey Anti Rotation Boot Revenue (million) Forecast, by Application 2019 & 2032
- Table 64: Turkey Anti Rotation Boot Volume (K) Forecast, by Application 2019 & 2032
- Table 65: Israel Anti Rotation Boot Revenue (million) Forecast, by Application 2019 & 2032
- Table 66: Israel Anti Rotation Boot Volume (K) Forecast, by Application 2019 & 2032
- Table 67: GCC Anti Rotation Boot Revenue (million) Forecast, by Application 2019 & 2032
- Table 68: GCC Anti Rotation Boot Volume (K) Forecast, by Application 2019 & 2032
- Table 69: North Africa Anti Rotation Boot Revenue (million) Forecast, by Application 2019 & 2032
- Table 70: North Africa Anti Rotation Boot Volume (K) Forecast, by Application 2019 & 2032
- Table 71: South Africa Anti Rotation Boot Revenue (million) Forecast, by Application 2019 & 2032
- Table 72: South Africa Anti Rotation Boot Volume (K) Forecast, by Application 2019 & 2032
- Table 73: Rest of Middle East & Africa Anti Rotation Boot Revenue (million) Forecast, by Application 2019 & 2032
- Table 74: Rest of Middle East & Africa Anti Rotation Boot Volume (K) Forecast, by Application 2019 & 2032
- Table 75: Global Anti Rotation Boot Revenue million Forecast, by Application 2019 & 2032
- Table 76: Global Anti Rotation Boot Volume K Forecast, by Application 2019 & 2032
- Table 77: Global Anti Rotation Boot Revenue million Forecast, by Type 2019 & 2032
- Table 78: Global Anti Rotation Boot Volume K Forecast, by Type 2019 & 2032
- Table 79: Global Anti Rotation Boot Revenue million Forecast, by Country 2019 & 2032
- Table 80: Global Anti Rotation Boot Volume K Forecast, by Country 2019 & 2032
- Table 81: China Anti Rotation Boot Revenue (million) Forecast, by Application 2019 & 2032
- Table 82: China Anti Rotation Boot Volume (K) Forecast, by Application 2019 & 2032
- Table 83: India Anti Rotation Boot Revenue (million) Forecast, by Application 2019 & 2032
- Table 84: India Anti Rotation Boot Volume (K) Forecast, by Application 2019 & 2032
- Table 85: Japan Anti Rotation Boot Revenue (million) Forecast, by Application 2019 & 2032
- Table 86: Japan Anti Rotation Boot Volume (K) Forecast, by Application 2019 & 2032
- Table 87: South Korea Anti Rotation Boot Revenue (million) Forecast, by Application 2019 & 2032
- Table 88: South Korea Anti Rotation Boot Volume (K) Forecast, by Application 2019 & 2032
- Table 89: ASEAN Anti Rotation Boot Revenue (million) Forecast, by Application 2019 & 2032
- Table 90: ASEAN Anti Rotation Boot Volume (K) Forecast, by Application 2019 & 2032
- Table 91: Oceania Anti Rotation Boot Revenue (million) Forecast, by Application 2019 & 2032
- Table 92: Oceania Anti Rotation Boot Volume (K) Forecast, by Application 2019 & 2032
- Table 93: Rest of Asia Pacific Anti Rotation Boot Revenue (million) Forecast, by Application 2019 & 2032
- Table 94: Rest of Asia Pacific Anti Rotation Boot Volume (K) Forecast, by Application 2019 & 2032
Frequently Asked Questions
1. What is the projected Compound Annual Growth Rate (CAGR) of the Anti Rotation Boot?
The projected CAGR is approximately XXX%.
2. Which companies are prominent players in the Anti Rotation Boot?
Key companies in the market include DJO, NYOrtho, BraceAbility, Lenjoy Medical Engineering, Performance Health(WAFFLE), Lakeland Orthotics, TIDI Products, Restorative Medical.
3. What are the main segments of the Anti Rotation Boot?
The market segments include Application, Type.
4. Can you provide details about the market size?
The market size is estimated to be USD XXX million as of 2022.
5. What are some drivers contributing to market growth?
N/A
6. What are the notable trends driving market growth?
N/A
7. Are there any restraints impacting market growth?
N/A
8. Can you provide examples of recent developments in the market?
N/A
9. What pricing options are available for accessing the report?
Pricing options include single-user, multi-user, and enterprise licenses priced at USD 3950.00, USD 5925.00, and USD 7900.00 respectively.
10. Is the market size provided in terms of value or volume?
The market size is provided in terms of value, measured in million and volume, measured in K.
11. Are there any specific market keywords associated with the report?
Yes, the market keyword associated with the report is "Anti Rotation Boot," which aids in identifying and referencing the specific market segment covered.
12. How do I determine which pricing option suits my needs best?
The pricing options vary based on user requirements and access needs. Individual users may opt for single-user licenses, while businesses requiring broader access may choose multi-user or enterprise licenses for cost-effective access to the report.
13. Are there any additional resources or data provided in the Anti Rotation Boot report?
While the report offers comprehensive insights, it's advisable to review the specific contents or supplementary materials provided to ascertain if additional resources or data are available.
14. How can I stay updated on further developments or reports in the Anti Rotation Boot?
To stay informed about further developments, trends, and reports in the Anti Rotation Boot, consider subscribing to industry newsletters, following relevant companies and organizations, or regularly checking reputable industry news sources and publications.
Methodology
Step 1 - Identification of Relevant Samples Size from Population Database


Step 2 - Approaches for Defining Global Market Size (Value, Volume* & Price*)

Note*: In applicable scenarios
Step 3 - Data Sources
Primary Research
- Web Analytics
- Survey Reports
- Research Institute
- Latest Research Reports
- Opinion Leaders
Secondary Research
- Annual Reports
- White Paper
- Latest Press Release
- Industry Association
- Paid Database
- Investor Presentations

Step 4 - Data Triangulation
Involves using different sources of information in order to increase the validity of a study
These sources are likely to be stakeholders in a program - participants, other researchers, program staff, other community members, and so on.
Then we put all data in single framework & apply various statistical tools to find out the dynamic on the market.
During the analysis stage, feedback from the stakeholder groups would be compared to determine areas of agreement as well as areas of divergence


