
Key Insights
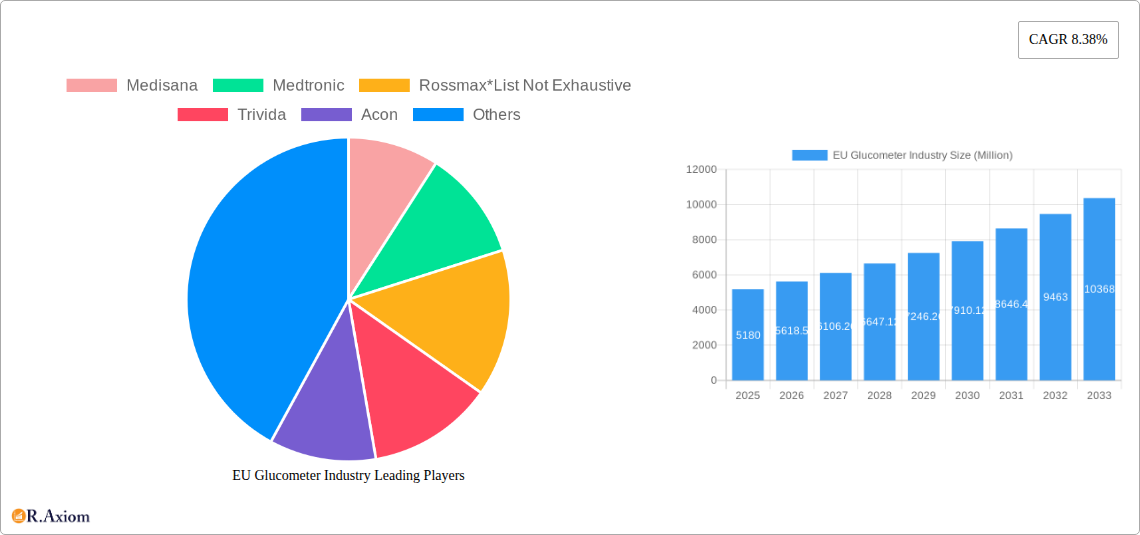
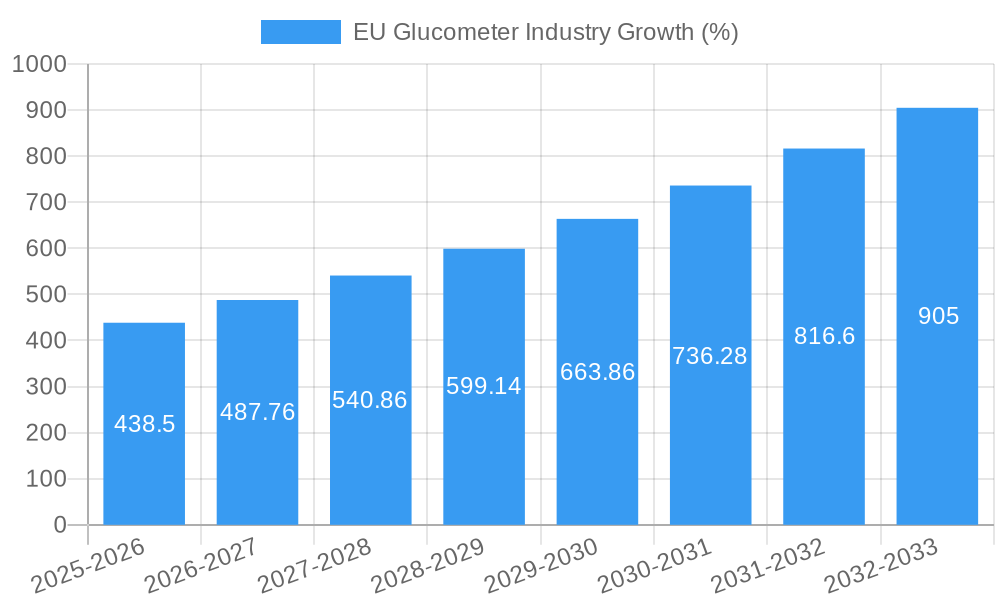
The European Union glucometer market, valued at €5.18 billion in 2025, is poised for robust growth, exhibiting a Compound Annual Growth Rate (CAGR) of 8.38% from 2025 to 2033. This expansion is driven by several key factors. The rising prevalence of diabetes across Europe, coupled with an aging population increasingly susceptible to the disease, fuels demand for both self-monitoring blood glucose (SMBG) devices and continuous glucose monitoring (CGM) systems. Technological advancements, including the development of smaller, more user-friendly devices and improved accuracy of CGM sensors, are further stimulating market growth. Furthermore, increasing awareness of the importance of proactive diabetes management and better access to healthcare contribute to higher adoption rates. The market is segmented into SMBG devices (glucometers, test strips, lancets) and CGM systems (sensors and durables). While SMBG remains the dominant segment, the CGM market is experiencing rapid growth due to its convenience and ability to provide real-time glucose data, improving diabetes management and potentially reducing complications. Competition is fierce, with established players like Medtronic, Abbott, and Roche alongside emerging companies vying for market share through innovation and strategic partnerships. Regulatory changes impacting reimbursement policies and healthcare spending could influence market dynamics in the coming years.
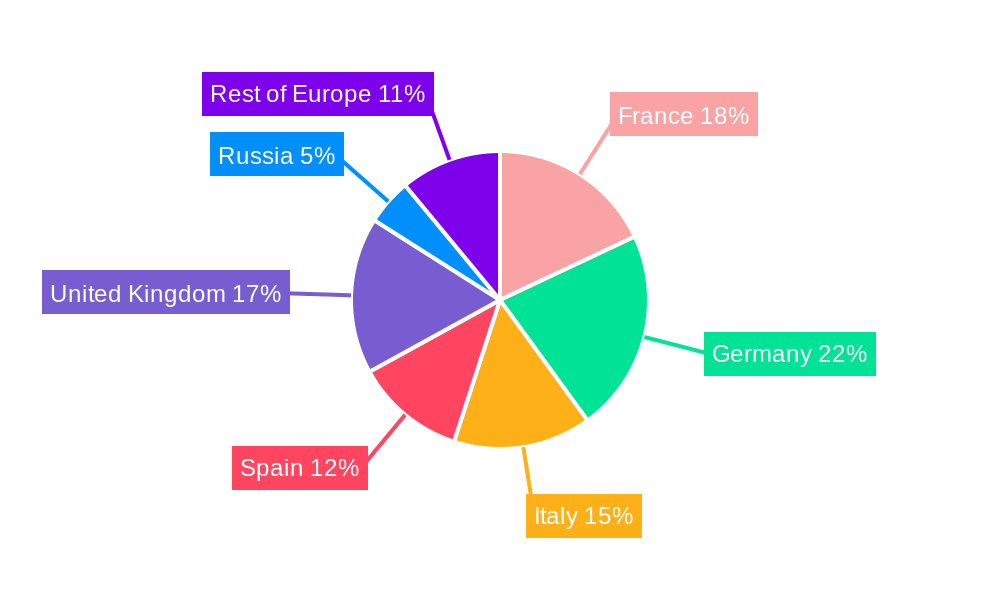
The continued growth trajectory is projected to be influenced by factors such as the increasing adoption of telehealth solutions integrating glucometer data and the development of integrated diabetes management systems incorporating other vital health parameters. However, potential restraints include pricing pressures from generic products and the need for continuous education and training to ensure proper device usage. Regional variations within the EU market exist, with countries like Germany, France, and the United Kingdom expected to represent larger market shares due to higher diabetes prevalence and greater healthcare infrastructure. The forecast period of 2025-2033 will likely see a continued shift towards CGM systems as technology advances and its cost-effectiveness improves, eventually reshaping the market landscape significantly. Detailed country-specific data would provide a more granular understanding of market performance within the EU.
EU Glucometer Industry Market Report: 2019-2033
This comprehensive report provides an in-depth analysis of the European Union glucometer industry, offering invaluable insights for stakeholders, investors, and industry professionals. Covering the period from 2019 to 2033, with a focus on 2025, this report meticulously examines market dynamics, competitive landscapes, and future growth trajectories. The report leverages extensive data analysis and industry expertise to deliver actionable intelligence on market trends, segment performance, and key players.
EU Glucometer Industry Market Concentration & Innovation
The EU glucometer market exhibits a moderately concentrated structure, with a few major players holding significant market share. However, the presence of numerous smaller companies and continuous innovation fosters a dynamic competitive environment. Market share data for 2024 reveals that Medtronic and Abbott collectively hold approximately xx% of the market, followed by Roche and Ascensia Diabetes Care with xx% and xx%, respectively. Smaller players, including Medisana, Rossmax, Trivida, Acon, Agamatrix Inc, Bionime Corporation, Johnson & Johnson, and Arkray, contribute to the remaining market share. Innovation is driven by technological advancements in continuous glucose monitoring (CGM) and the integration of smart technologies into self-monitoring blood glucose (SMBG) devices. Stringent regulatory frameworks, including CE marking requirements, ensure product safety and efficacy. The presence of substitute products, such as alternative diabetes management therapies, exerts competitive pressure. End-user trends favor minimally invasive, user-friendly, and data-connected devices. M&A activities within the industry have been relatively moderate in recent years, with deal values averaging xx Million EUR annually over the historical period. Several key factors are shaping the market:
- High prevalence of diabetes: The growing number of diabetes patients fuels demand for glucometers.
- Technological advancements: Continuous innovation in CGM and SMBG technologies drives growth.
- Regulatory landscape: Stringent regulatory norms ensure product quality and safety.
- Rising healthcare expenditure: Increased healthcare spending enables greater access to advanced devices.
- Increased awareness and patient education: Better awareness among patients is driving adoption.
EU Glucometer Industry Industry Trends & Insights
The EU glucometer market demonstrates robust growth, projected to reach xx Million EUR by 2033. The Compound Annual Growth Rate (CAGR) from 2025 to 2033 is estimated at xx%. Key growth drivers include the rising prevalence of diabetes, technological advancements leading to smaller, more user-friendly devices (like Medtronic's Simplera), and the increasing integration of glucometers with mobile health (mHealth) applications. Technological disruptions are significantly impacting the market, with CGM systems gaining considerable traction due to their convenience and improved diabetes management capabilities. Consumer preferences are shifting towards non-invasive and easily integrated devices that provide continuous data monitoring and seamless connectivity with healthcare professionals. Competitive dynamics are characterized by continuous product innovation, strategic partnerships, and mergers & acquisitions. The market penetration of CGM devices is increasing rapidly, with a projected xx% penetration rate by 2033, driven by factors such as greater affordability and improved reimbursement policies.
Dominant Markets & Segments in EU Glucometer Industry
Germany holds the largest market share within the EU, driven by a high prevalence of diabetes and strong healthcare infrastructure. Other significant markets include the UK, France, and Italy.
Self-monitoring Blood Glucose Devices:
- Glucometer Devices: This segment holds the largest market share, but growth is being challenged by the increasing adoption of CGM devices. Key drivers include affordability and ease of use.
- Test Strips: This is a high-volume, consumable segment intrinsically linked to glucometer sales. Competitive pricing and product reliability influence market share.
- Lancets: A smaller segment with less growth potential, but crucial for SMBG use. Innovation focuses on reducing pain and improving ease of use.
Continuous Glucose Monitoring:
- Sensors: This segment is experiencing the most significant growth, driven by technological advances and the preference for continuous monitoring. Key drivers include accuracy and reduced need for fingerstick testing.
- Durables: This includes the CGM device itself, which is a higher-priced item with longer lifecycle. Features such as smaller size and user-friendliness are key drivers.
Key Drivers of Dominance:
- High prevalence of diabetes: The higher the incidence of diabetes in a region, the higher the demand for glucometers.
- Healthcare infrastructure: Strong healthcare infrastructure and access to advanced medical technologies is vital.
- Economic policies: Reimbursement policies, healthcare spending, and healthcare access significantly impact market growth.
EU Glucometer Industry Product Developments
Recent product developments highlight a trend towards smaller, more user-friendly devices, integrating connectivity with mobile apps, and improved accuracy. Medtronic's Simplera CGM, Dexcom's G7 CGM system, and Roche's Accu-Chek Instant system exemplify these advancements. These innovations aim to improve patient experience, enhance diabetes management, and offer competitive advantages. The increasing adoption of integrated personalized diabetes management (iPDM) systems is a major market trend.
Report Scope & Segmentation Analysis
This report segments the EU glucometer market by device type (SMBG and CGM), consumables (test strips and lancets), and end-user (hospitals, clinics, home-use). The SMBG segment is expected to maintain a significant market share throughout the forecast period, albeit with slowing growth compared to CGM. The CGM segment is projected to experience the highest growth rate, driven by technological innovation and increased patient preference. Consumables are critical to the overall market value, with steady growth aligned with device usage. Growth projections for each segment vary, but CGM shows the fastest growth, expected to reach xx Million EUR by 2033. Competitive dynamics within each segment are shaped by product features, pricing strategies, and brand reputation.
Key Drivers of EU Glucometer Industry Growth
Several factors drive growth in the EU glucometer industry. The rising prevalence of diabetes across Europe is a major factor. Technological advancements in CGM and improved SMBG devices enhance diabetes management and improve patient outcomes. Favorable regulatory environments support innovation and market entry. Finally, increasing healthcare expenditure and health insurance coverage ensure greater access to these essential diagnostic tools.
Challenges in the EU Glucometer Industry Sector
The EU glucometer market faces several challenges. Stringent regulatory requirements necessitate costly and time-consuming approvals. Supply chain disruptions can impact product availability and pricing. Intense competition necessitates continuous innovation and cost-effectiveness. Additionally, the affordability of CGM systems for all patients remains a significant barrier. The overall impact of these factors on market growth is estimated at xx% reduction in CAGR over the forecast period.
Emerging Opportunities in EU Glucometer Industry
The EU glucometer market offers significant opportunities. The growing adoption of telehealth and remote patient monitoring presents opportunities for connected devices and data analytics services. The development of artificial intelligence (AI)-powered algorithms for improved glucose prediction and management represents a key growth area. Finally, exploring new markets and underserved populations can unlock further growth potential.
Leading Players in the EU Glucometer Industry Market
- Medisana
- Medtronic
- Rossmax
- Trivida
- Acon
- Agamatrix Inc
- F Hoffmann-La Roche AG
- Abbott
- Bionime Corporation
- Johnson & Johnson
- Arkray
- Dexcom
- Ascensia Diabetes Care
Key Developments in EU Glucometer Industry Industry
- October 2023: Medtronic received approval for its Simplera CGM system in Europe, a smaller, disposable device eliminating fingerstick testing. This significantly enhances market competitiveness.
- March 2022: Dexcom's G7 CGM system received CE Mark approval, offering a more user-friendly and powerful real-time monitoring solution. This broadened market access and strengthened Dexcom’s position.
- February 2021: Roche launched the Accu-Chek Instant system, a connected BGM system integrating with the mySugr app. This improved data management and enhanced personalized diabetes management.
Strategic Outlook for EU Glucometer Industry Market
The EU glucometer market holds substantial growth potential, driven by technological advancements, increasing diabetes prevalence, and a growing focus on personalized diabetes management. Continued innovation in CGM technology, the integration of AI and machine learning, and the expansion of telehealth services will further drive market growth. Companies focusing on user-friendly designs, data connectivity, and improved accuracy will be best positioned for success in this evolving market.
EU Glucometer Industry Segmentation
-
1. Self-monitoring Blood Glucose Devices
- 1.1. Glucometer Devices
- 1.2. Test Strips
- 1.3. Lancets
-
2. Continuous Glucose Monitoring
- 2.1. Sensors
- 2.2. Durables
EU Glucometer Industry Segmentation By Geography
- 1. France
- 2. Germany
- 3. Italy
- 4. Spain
- 5. United Kingdom
- 6. Russia
- 7. Rest of Europe
EU Glucometer Industry REPORT HIGHLIGHTS
| Aspects | Details |
|---|---|
| Study Period | 2019-2033 |
| Base Year | 2024 |
| Estimated Year | 2025 |
| Forecast Period | 2025-2033 |
| Historical Period | 2019-2024 |
| Growth Rate | CAGR of 8.38% from 2019-2033 |
| Segmentation |
|
Table of Contents
- 1. Introduction
- 1.1. Research Scope
- 1.2. Market Segmentation
- 1.3. Research Methodology
- 1.4. Definitions and Assumptions
- 2. Executive Summary
- 2.1. Introduction
- 3. Market Dynamics
- 3.1. Introduction
- 3.2. Market Drivers
- 3.2.1. Rising Prevalence of Cancer Worldwide; Technological Advancements in Diagnostic Testing; Increasing Demand for Point-of-care Treatment
- 3.3. Market Restrains
- 3.3.1. High Cost of Molecular Diagnostic Tests; Lack of Skilled Workforce and Stringent Regulatory Framework
- 3.4. Market Trends
- 3.4.1. Continuous Glucose Monitoring Holds Highest Market Share in Europe Blood Glucose Monitoring Market.
- 4. Market Factor Analysis
- 4.1. Porters Five Forces
- 4.2. Supply/Value Chain
- 4.3. PESTEL analysis
- 4.4. Market Entropy
- 4.5. Patent/Trademark Analysis
- 5. Global EU Glucometer Industry Analysis, Insights and Forecast, 2019-2031
- 5.1. Market Analysis, Insights and Forecast - by Self-monitoring Blood Glucose Devices
- 5.1.1. Glucometer Devices
- 5.1.2. Test Strips
- 5.1.3. Lancets
- 5.2. Market Analysis, Insights and Forecast - by Continuous Glucose Monitoring
- 5.2.1. Sensors
- 5.2.2. Durables
- 5.3. Market Analysis, Insights and Forecast - by Region
- 5.3.1. France
- 5.3.2. Germany
- 5.3.3. Italy
- 5.3.4. Spain
- 5.3.5. United Kingdom
- 5.3.6. Russia
- 5.3.7. Rest of Europe
- 5.1. Market Analysis, Insights and Forecast - by Self-monitoring Blood Glucose Devices
- 6. France EU Glucometer Industry Analysis, Insights and Forecast, 2019-2031
- 6.1. Market Analysis, Insights and Forecast - by Self-monitoring Blood Glucose Devices
- 6.1.1. Glucometer Devices
- 6.1.2. Test Strips
- 6.1.3. Lancets
- 6.2. Market Analysis, Insights and Forecast - by Continuous Glucose Monitoring
- 6.2.1. Sensors
- 6.2.2. Durables
- 6.1. Market Analysis, Insights and Forecast - by Self-monitoring Blood Glucose Devices
- 7. Germany EU Glucometer Industry Analysis, Insights and Forecast, 2019-2031
- 7.1. Market Analysis, Insights and Forecast - by Self-monitoring Blood Glucose Devices
- 7.1.1. Glucometer Devices
- 7.1.2. Test Strips
- 7.1.3. Lancets
- 7.2. Market Analysis, Insights and Forecast - by Continuous Glucose Monitoring
- 7.2.1. Sensors
- 7.2.2. Durables
- 7.1. Market Analysis, Insights and Forecast - by Self-monitoring Blood Glucose Devices
- 8. Italy EU Glucometer Industry Analysis, Insights and Forecast, 2019-2031
- 8.1. Market Analysis, Insights and Forecast - by Self-monitoring Blood Glucose Devices
- 8.1.1. Glucometer Devices
- 8.1.2. Test Strips
- 8.1.3. Lancets
- 8.2. Market Analysis, Insights and Forecast - by Continuous Glucose Monitoring
- 8.2.1. Sensors
- 8.2.2. Durables
- 8.1. Market Analysis, Insights and Forecast - by Self-monitoring Blood Glucose Devices
- 9. Spain EU Glucometer Industry Analysis, Insights and Forecast, 2019-2031
- 9.1. Market Analysis, Insights and Forecast - by Self-monitoring Blood Glucose Devices
- 9.1.1. Glucometer Devices
- 9.1.2. Test Strips
- 9.1.3. Lancets
- 9.2. Market Analysis, Insights and Forecast - by Continuous Glucose Monitoring
- 9.2.1. Sensors
- 9.2.2. Durables
- 9.1. Market Analysis, Insights and Forecast - by Self-monitoring Blood Glucose Devices
- 10. United Kingdom EU Glucometer Industry Analysis, Insights and Forecast, 2019-2031
- 10.1. Market Analysis, Insights and Forecast - by Self-monitoring Blood Glucose Devices
- 10.1.1. Glucometer Devices
- 10.1.2. Test Strips
- 10.1.3. Lancets
- 10.2. Market Analysis, Insights and Forecast - by Continuous Glucose Monitoring
- 10.2.1. Sensors
- 10.2.2. Durables
- 10.1. Market Analysis, Insights and Forecast - by Self-monitoring Blood Glucose Devices
- 11. Russia EU Glucometer Industry Analysis, Insights and Forecast, 2019-2031
- 11.1. Market Analysis, Insights and Forecast - by Self-monitoring Blood Glucose Devices
- 11.1.1. Glucometer Devices
- 11.1.2. Test Strips
- 11.1.3. Lancets
- 11.2. Market Analysis, Insights and Forecast - by Continuous Glucose Monitoring
- 11.2.1. Sensors
- 11.2.2. Durables
- 11.1. Market Analysis, Insights and Forecast - by Self-monitoring Blood Glucose Devices
- 12. Rest of Europe EU Glucometer Industry Analysis, Insights and Forecast, 2019-2031
- 12.1. Market Analysis, Insights and Forecast - by Self-monitoring Blood Glucose Devices
- 12.1.1. Glucometer Devices
- 12.1.2. Test Strips
- 12.1.3. Lancets
- 12.2. Market Analysis, Insights and Forecast - by Continuous Glucose Monitoring
- 12.2.1. Sensors
- 12.2.2. Durables
- 12.1. Market Analysis, Insights and Forecast - by Self-monitoring Blood Glucose Devices
- 13. North America EU Glucometer Industry Analysis, Insights and Forecast, 2019-2031
- 13.1. Market Analysis, Insights and Forecast - By Country/Sub-region
- 13.1.1 United States
- 13.1.2 Canada
- 13.1.3 Mexico
- 14. Europe EU Glucometer Industry Analysis, Insights and Forecast, 2019-2031
- 14.1. Market Analysis, Insights and Forecast - By Country/Sub-region
- 14.1.1 Germany
- 14.1.2 United Kingdom
- 14.1.3 France
- 14.1.4 Spain
- 14.1.5 Italy
- 14.1.6 Spain
- 14.1.7 Belgium
- 14.1.8 Netherland
- 14.1.9 Nordics
- 14.1.10 Rest of Europe
- 15. Asia Pacific EU Glucometer Industry Analysis, Insights and Forecast, 2019-2031
- 15.1. Market Analysis, Insights and Forecast - By Country/Sub-region
- 15.1.1 China
- 15.1.2 Japan
- 15.1.3 India
- 15.1.4 South Korea
- 15.1.5 Southeast Asia
- 15.1.6 Australia
- 15.1.7 Indonesia
- 15.1.8 Phillipes
- 15.1.9 Singapore
- 15.1.10 Thailandc
- 15.1.11 Rest of Asia Pacific
- 16. South America EU Glucometer Industry Analysis, Insights and Forecast, 2019-2031
- 16.1. Market Analysis, Insights and Forecast - By Country/Sub-region
- 16.1.1 Brazil
- 16.1.2 Argentina
- 16.1.3 Peru
- 16.1.4 Chile
- 16.1.5 Colombia
- 16.1.6 Ecuador
- 16.1.7 Venezuela
- 16.1.8 Rest of South America
- 17. MEA EU Glucometer Industry Analysis, Insights and Forecast, 2019-2031
- 17.1. Market Analysis, Insights and Forecast - By Country/Sub-region
- 17.1.1 United Arab Emirates
- 17.1.2 Saudi Arabia
- 17.1.3 South Africa
- 17.1.4 Rest of Middle East and Africa
- 18. Competitive Analysis
- 18.1. Global Market Share Analysis 2024
- 18.2. Company Profiles
- 18.2.1 Medisana
- 18.2.1.1. Overview
- 18.2.1.2. Products
- 18.2.1.3. SWOT Analysis
- 18.2.1.4. Recent Developments
- 18.2.1.5. Financials (Based on Availability)
- 18.2.2 Medtronic
- 18.2.2.1. Overview
- 18.2.2.2. Products
- 18.2.2.3. SWOT Analysis
- 18.2.2.4. Recent Developments
- 18.2.2.5. Financials (Based on Availability)
- 18.2.3 Rossmax*List Not Exhaustive
- 18.2.3.1. Overview
- 18.2.3.2. Products
- 18.2.3.3. SWOT Analysis
- 18.2.3.4. Recent Developments
- 18.2.3.5. Financials (Based on Availability)
- 18.2.4 Trivida
- 18.2.4.1. Overview
- 18.2.4.2. Products
- 18.2.4.3. SWOT Analysis
- 18.2.4.4. Recent Developments
- 18.2.4.5. Financials (Based on Availability)
- 18.2.5 Acon
- 18.2.5.1. Overview
- 18.2.5.2. Products
- 18.2.5.3. SWOT Analysis
- 18.2.5.4. Recent Developments
- 18.2.5.5. Financials (Based on Availability)
- 18.2.6 Agamatrix Inc
- 18.2.6.1. Overview
- 18.2.6.2. Products
- 18.2.6.3. SWOT Analysis
- 18.2.6.4. Recent Developments
- 18.2.6.5. Financials (Based on Availability)
- 18.2.7 F Hoffmann-La Roche AG
- 18.2.7.1. Overview
- 18.2.7.2. Products
- 18.2.7.3. SWOT Analysis
- 18.2.7.4. Recent Developments
- 18.2.7.5. Financials (Based on Availability)
- 18.2.8 Abbott
- 18.2.8.1. Overview
- 18.2.8.2. Products
- 18.2.8.3. SWOT Analysis
- 18.2.8.4. Recent Developments
- 18.2.8.5. Financials (Based on Availability)
- 18.2.9 Bionime Corporation
- 18.2.9.1. Overview
- 18.2.9.2. Products
- 18.2.9.3. SWOT Analysis
- 18.2.9.4. Recent Developments
- 18.2.9.5. Financials (Based on Availability)
- 18.2.10 Johnson & Johnson
- 18.2.10.1. Overview
- 18.2.10.2. Products
- 18.2.10.3. SWOT Analysis
- 18.2.10.4. Recent Developments
- 18.2.10.5. Financials (Based on Availability)
- 18.2.11 Arkray
- 18.2.11.1. Overview
- 18.2.11.2. Products
- 18.2.11.3. SWOT Analysis
- 18.2.11.4. Recent Developments
- 18.2.11.5. Financials (Based on Availability)
- 18.2.12 Dexcom
- 18.2.12.1. Overview
- 18.2.12.2. Products
- 18.2.12.3. SWOT Analysis
- 18.2.12.4. Recent Developments
- 18.2.12.5. Financials (Based on Availability)
- 18.2.13 Ascensia Diabetes Care
- 18.2.13.1. Overview
- 18.2.13.2. Products
- 18.2.13.3. SWOT Analysis
- 18.2.13.4. Recent Developments
- 18.2.13.5. Financials (Based on Availability)
- 18.2.1 Medisana
List of Figures
- Figure 1: Global EU Glucometer Industry Revenue Breakdown (Million, %) by Region 2024 & 2032
- Figure 2: North America EU Glucometer Industry Revenue (Million), by Country 2024 & 2032
- Figure 3: North America EU Glucometer Industry Revenue Share (%), by Country 2024 & 2032
- Figure 4: Europe EU Glucometer Industry Revenue (Million), by Country 2024 & 2032
- Figure 5: Europe EU Glucometer Industry Revenue Share (%), by Country 2024 & 2032
- Figure 6: Asia Pacific EU Glucometer Industry Revenue (Million), by Country 2024 & 2032
- Figure 7: Asia Pacific EU Glucometer Industry Revenue Share (%), by Country 2024 & 2032
- Figure 8: South America EU Glucometer Industry Revenue (Million), by Country 2024 & 2032
- Figure 9: South America EU Glucometer Industry Revenue Share (%), by Country 2024 & 2032
- Figure 10: MEA EU Glucometer Industry Revenue (Million), by Country 2024 & 2032
- Figure 11: MEA EU Glucometer Industry Revenue Share (%), by Country 2024 & 2032
- Figure 12: France EU Glucometer Industry Revenue (Million), by Self-monitoring Blood Glucose Devices 2024 & 2032
- Figure 13: France EU Glucometer Industry Revenue Share (%), by Self-monitoring Blood Glucose Devices 2024 & 2032
- Figure 14: France EU Glucometer Industry Revenue (Million), by Continuous Glucose Monitoring 2024 & 2032
- Figure 15: France EU Glucometer Industry Revenue Share (%), by Continuous Glucose Monitoring 2024 & 2032
- Figure 16: France EU Glucometer Industry Revenue (Million), by Country 2024 & 2032
- Figure 17: France EU Glucometer Industry Revenue Share (%), by Country 2024 & 2032
- Figure 18: Germany EU Glucometer Industry Revenue (Million), by Self-monitoring Blood Glucose Devices 2024 & 2032
- Figure 19: Germany EU Glucometer Industry Revenue Share (%), by Self-monitoring Blood Glucose Devices 2024 & 2032
- Figure 20: Germany EU Glucometer Industry Revenue (Million), by Continuous Glucose Monitoring 2024 & 2032
- Figure 21: Germany EU Glucometer Industry Revenue Share (%), by Continuous Glucose Monitoring 2024 & 2032
- Figure 22: Germany EU Glucometer Industry Revenue (Million), by Country 2024 & 2032
- Figure 23: Germany EU Glucometer Industry Revenue Share (%), by Country 2024 & 2032
- Figure 24: Italy EU Glucometer Industry Revenue (Million), by Self-monitoring Blood Glucose Devices 2024 & 2032
- Figure 25: Italy EU Glucometer Industry Revenue Share (%), by Self-monitoring Blood Glucose Devices 2024 & 2032
- Figure 26: Italy EU Glucometer Industry Revenue (Million), by Continuous Glucose Monitoring 2024 & 2032
- Figure 27: Italy EU Glucometer Industry Revenue Share (%), by Continuous Glucose Monitoring 2024 & 2032
- Figure 28: Italy EU Glucometer Industry Revenue (Million), by Country 2024 & 2032
- Figure 29: Italy EU Glucometer Industry Revenue Share (%), by Country 2024 & 2032
- Figure 30: Spain EU Glucometer Industry Revenue (Million), by Self-monitoring Blood Glucose Devices 2024 & 2032
- Figure 31: Spain EU Glucometer Industry Revenue Share (%), by Self-monitoring Blood Glucose Devices 2024 & 2032
- Figure 32: Spain EU Glucometer Industry Revenue (Million), by Continuous Glucose Monitoring 2024 & 2032
- Figure 33: Spain EU Glucometer Industry Revenue Share (%), by Continuous Glucose Monitoring 2024 & 2032
- Figure 34: Spain EU Glucometer Industry Revenue (Million), by Country 2024 & 2032
- Figure 35: Spain EU Glucometer Industry Revenue Share (%), by Country 2024 & 2032
- Figure 36: United Kingdom EU Glucometer Industry Revenue (Million), by Self-monitoring Blood Glucose Devices 2024 & 2032
- Figure 37: United Kingdom EU Glucometer Industry Revenue Share (%), by Self-monitoring Blood Glucose Devices 2024 & 2032
- Figure 38: United Kingdom EU Glucometer Industry Revenue (Million), by Continuous Glucose Monitoring 2024 & 2032
- Figure 39: United Kingdom EU Glucometer Industry Revenue Share (%), by Continuous Glucose Monitoring 2024 & 2032
- Figure 40: United Kingdom EU Glucometer Industry Revenue (Million), by Country 2024 & 2032
- Figure 41: United Kingdom EU Glucometer Industry Revenue Share (%), by Country 2024 & 2032
- Figure 42: Russia EU Glucometer Industry Revenue (Million), by Self-monitoring Blood Glucose Devices 2024 & 2032
- Figure 43: Russia EU Glucometer Industry Revenue Share (%), by Self-monitoring Blood Glucose Devices 2024 & 2032
- Figure 44: Russia EU Glucometer Industry Revenue (Million), by Continuous Glucose Monitoring 2024 & 2032
- Figure 45: Russia EU Glucometer Industry Revenue Share (%), by Continuous Glucose Monitoring 2024 & 2032
- Figure 46: Russia EU Glucometer Industry Revenue (Million), by Country 2024 & 2032
- Figure 47: Russia EU Glucometer Industry Revenue Share (%), by Country 2024 & 2032
- Figure 48: Rest of Europe EU Glucometer Industry Revenue (Million), by Self-monitoring Blood Glucose Devices 2024 & 2032
- Figure 49: Rest of Europe EU Glucometer Industry Revenue Share (%), by Self-monitoring Blood Glucose Devices 2024 & 2032
- Figure 50: Rest of Europe EU Glucometer Industry Revenue (Million), by Continuous Glucose Monitoring 2024 & 2032
- Figure 51: Rest of Europe EU Glucometer Industry Revenue Share (%), by Continuous Glucose Monitoring 2024 & 2032
- Figure 52: Rest of Europe EU Glucometer Industry Revenue (Million), by Country 2024 & 2032
- Figure 53: Rest of Europe EU Glucometer Industry Revenue Share (%), by Country 2024 & 2032
List of Tables
- Table 1: Global EU Glucometer Industry Revenue Million Forecast, by Region 2019 & 2032
- Table 2: Global EU Glucometer Industry Revenue Million Forecast, by Self-monitoring Blood Glucose Devices 2019 & 2032
- Table 3: Global EU Glucometer Industry Revenue Million Forecast, by Continuous Glucose Monitoring 2019 & 2032
- Table 4: Global EU Glucometer Industry Revenue Million Forecast, by Region 2019 & 2032
- Table 5: Global EU Glucometer Industry Revenue Million Forecast, by Country 2019 & 2032
- Table 6: United States EU Glucometer Industry Revenue (Million) Forecast, by Application 2019 & 2032
- Table 7: Canada EU Glucometer Industry Revenue (Million) Forecast, by Application 2019 & 2032
- Table 8: Mexico EU Glucometer Industry Revenue (Million) Forecast, by Application 2019 & 2032
- Table 9: Global EU Glucometer Industry Revenue Million Forecast, by Country 2019 & 2032
- Table 10: Germany EU Glucometer Industry Revenue (Million) Forecast, by Application 2019 & 2032
- Table 11: United Kingdom EU Glucometer Industry Revenue (Million) Forecast, by Application 2019 & 2032
- Table 12: France EU Glucometer Industry Revenue (Million) Forecast, by Application 2019 & 2032
- Table 13: Spain EU Glucometer Industry Revenue (Million) Forecast, by Application 2019 & 2032
- Table 14: Italy EU Glucometer Industry Revenue (Million) Forecast, by Application 2019 & 2032
- Table 15: Spain EU Glucometer Industry Revenue (Million) Forecast, by Application 2019 & 2032
- Table 16: Belgium EU Glucometer Industry Revenue (Million) Forecast, by Application 2019 & 2032
- Table 17: Netherland EU Glucometer Industry Revenue (Million) Forecast, by Application 2019 & 2032
- Table 18: Nordics EU Glucometer Industry Revenue (Million) Forecast, by Application 2019 & 2032
- Table 19: Rest of Europe EU Glucometer Industry Revenue (Million) Forecast, by Application 2019 & 2032
- Table 20: Global EU Glucometer Industry Revenue Million Forecast, by Country 2019 & 2032
- Table 21: China EU Glucometer Industry Revenue (Million) Forecast, by Application 2019 & 2032
- Table 22: Japan EU Glucometer Industry Revenue (Million) Forecast, by Application 2019 & 2032
- Table 23: India EU Glucometer Industry Revenue (Million) Forecast, by Application 2019 & 2032
- Table 24: South Korea EU Glucometer Industry Revenue (Million) Forecast, by Application 2019 & 2032
- Table 25: Southeast Asia EU Glucometer Industry Revenue (Million) Forecast, by Application 2019 & 2032
- Table 26: Australia EU Glucometer Industry Revenue (Million) Forecast, by Application 2019 & 2032
- Table 27: Indonesia EU Glucometer Industry Revenue (Million) Forecast, by Application 2019 & 2032
- Table 28: Phillipes EU Glucometer Industry Revenue (Million) Forecast, by Application 2019 & 2032
- Table 29: Singapore EU Glucometer Industry Revenue (Million) Forecast, by Application 2019 & 2032
- Table 30: Thailandc EU Glucometer Industry Revenue (Million) Forecast, by Application 2019 & 2032
- Table 31: Rest of Asia Pacific EU Glucometer Industry Revenue (Million) Forecast, by Application 2019 & 2032
- Table 32: Global EU Glucometer Industry Revenue Million Forecast, by Country 2019 & 2032
- Table 33: Brazil EU Glucometer Industry Revenue (Million) Forecast, by Application 2019 & 2032
- Table 34: Argentina EU Glucometer Industry Revenue (Million) Forecast, by Application 2019 & 2032
- Table 35: Peru EU Glucometer Industry Revenue (Million) Forecast, by Application 2019 & 2032
- Table 36: Chile EU Glucometer Industry Revenue (Million) Forecast, by Application 2019 & 2032
- Table 37: Colombia EU Glucometer Industry Revenue (Million) Forecast, by Application 2019 & 2032
- Table 38: Ecuador EU Glucometer Industry Revenue (Million) Forecast, by Application 2019 & 2032
- Table 39: Venezuela EU Glucometer Industry Revenue (Million) Forecast, by Application 2019 & 2032
- Table 40: Rest of South America EU Glucometer Industry Revenue (Million) Forecast, by Application 2019 & 2032
- Table 41: Global EU Glucometer Industry Revenue Million Forecast, by Country 2019 & 2032
- Table 42: United Arab Emirates EU Glucometer Industry Revenue (Million) Forecast, by Application 2019 & 2032
- Table 43: Saudi Arabia EU Glucometer Industry Revenue (Million) Forecast, by Application 2019 & 2032
- Table 44: South Africa EU Glucometer Industry Revenue (Million) Forecast, by Application 2019 & 2032
- Table 45: Rest of Middle East and Africa EU Glucometer Industry Revenue (Million) Forecast, by Application 2019 & 2032
- Table 46: Global EU Glucometer Industry Revenue Million Forecast, by Self-monitoring Blood Glucose Devices 2019 & 2032
- Table 47: Global EU Glucometer Industry Revenue Million Forecast, by Continuous Glucose Monitoring 2019 & 2032
- Table 48: Global EU Glucometer Industry Revenue Million Forecast, by Country 2019 & 2032
- Table 49: Global EU Glucometer Industry Revenue Million Forecast, by Self-monitoring Blood Glucose Devices 2019 & 2032
- Table 50: Global EU Glucometer Industry Revenue Million Forecast, by Continuous Glucose Monitoring 2019 & 2032
- Table 51: Global EU Glucometer Industry Revenue Million Forecast, by Country 2019 & 2032
- Table 52: Global EU Glucometer Industry Revenue Million Forecast, by Self-monitoring Blood Glucose Devices 2019 & 2032
- Table 53: Global EU Glucometer Industry Revenue Million Forecast, by Continuous Glucose Monitoring 2019 & 2032
- Table 54: Global EU Glucometer Industry Revenue Million Forecast, by Country 2019 & 2032
- Table 55: Global EU Glucometer Industry Revenue Million Forecast, by Self-monitoring Blood Glucose Devices 2019 & 2032
- Table 56: Global EU Glucometer Industry Revenue Million Forecast, by Continuous Glucose Monitoring 2019 & 2032
- Table 57: Global EU Glucometer Industry Revenue Million Forecast, by Country 2019 & 2032
- Table 58: Global EU Glucometer Industry Revenue Million Forecast, by Self-monitoring Blood Glucose Devices 2019 & 2032
- Table 59: Global EU Glucometer Industry Revenue Million Forecast, by Continuous Glucose Monitoring 2019 & 2032
- Table 60: Global EU Glucometer Industry Revenue Million Forecast, by Country 2019 & 2032
- Table 61: Global EU Glucometer Industry Revenue Million Forecast, by Self-monitoring Blood Glucose Devices 2019 & 2032
- Table 62: Global EU Glucometer Industry Revenue Million Forecast, by Continuous Glucose Monitoring 2019 & 2032
- Table 63: Global EU Glucometer Industry Revenue Million Forecast, by Country 2019 & 2032
- Table 64: Global EU Glucometer Industry Revenue Million Forecast, by Self-monitoring Blood Glucose Devices 2019 & 2032
- Table 65: Global EU Glucometer Industry Revenue Million Forecast, by Continuous Glucose Monitoring 2019 & 2032
- Table 66: Global EU Glucometer Industry Revenue Million Forecast, by Country 2019 & 2032
Frequently Asked Questions
1. What is the projected Compound Annual Growth Rate (CAGR) of the EU Glucometer Industry?
The projected CAGR is approximately 8.38%.
2. Which companies are prominent players in the EU Glucometer Industry?
Key companies in the market include Medisana, Medtronic, Rossmax*List Not Exhaustive, Trivida, Acon, Agamatrix Inc, F Hoffmann-La Roche AG, Abbott, Bionime Corporation, Johnson & Johnson, Arkray, Dexcom, Ascensia Diabetes Care.
3. What are the main segments of the EU Glucometer Industry?
The market segments include Self-monitoring Blood Glucose Devices, Continuous Glucose Monitoring.
4. Can you provide details about the market size?
The market size is estimated to be USD 5.18 Million as of 2022.
5. What are some drivers contributing to market growth?
Rising Prevalence of Cancer Worldwide; Technological Advancements in Diagnostic Testing; Increasing Demand for Point-of-care Treatment.
6. What are the notable trends driving market growth?
Continuous Glucose Monitoring Holds Highest Market Share in Europe Blood Glucose Monitoring Market..
7. Are there any restraints impacting market growth?
High Cost of Molecular Diagnostic Tests; Lack of Skilled Workforce and Stringent Regulatory Framework.
8. Can you provide examples of recent developments in the market?
October 2023: In Europe, the Simplera, a novel continuous glucose monitor (CGM) developed by Medtronic, received approval. This advanced device, suitable for individuals with diabetes aged 2 years and above, represents a significant improvement over the Guardian 4 sensor. Notably, the Simplera is half the size of its predecessor, disposable, and eliminates the need for fingersticks. Moreover, its streamlined two-step insertion process minimizes the likelihood of errors.
9. What pricing options are available for accessing the report?
Pricing options include single-user, multi-user, and enterprise licenses priced at USD 4750, USD 5250, and USD 8750 respectively.
10. Is the market size provided in terms of value or volume?
The market size is provided in terms of value, measured in Million.
11. Are there any specific market keywords associated with the report?
Yes, the market keyword associated with the report is "EU Glucometer Industry," which aids in identifying and referencing the specific market segment covered.
12. How do I determine which pricing option suits my needs best?
The pricing options vary based on user requirements and access needs. Individual users may opt for single-user licenses, while businesses requiring broader access may choose multi-user or enterprise licenses for cost-effective access to the report.
13. Are there any additional resources or data provided in the EU Glucometer Industry report?
While the report offers comprehensive insights, it's advisable to review the specific contents or supplementary materials provided to ascertain if additional resources or data are available.
14. How can I stay updated on further developments or reports in the EU Glucometer Industry?
To stay informed about further developments, trends, and reports in the EU Glucometer Industry, consider subscribing to industry newsletters, following relevant companies and organizations, or regularly checking reputable industry news sources and publications.
Methodology
Step 1 - Identification of Relevant Samples Size from Population Database


Step 2 - Approaches for Defining Global Market Size (Value, Volume* & Price*)

Note*: In applicable scenarios
Step 3 - Data Sources
Primary Research
- Web Analytics
- Survey Reports
- Research Institute
- Latest Research Reports
- Opinion Leaders
Secondary Research
- Annual Reports
- White Paper
- Latest Press Release
- Industry Association
- Paid Database
- Investor Presentations

Step 4 - Data Triangulation
Involves using different sources of information in order to increase the validity of a study
These sources are likely to be stakeholders in a program - participants, other researchers, program staff, other community members, and so on.
Then we put all data in single framework & apply various statistical tools to find out the dynamic on the market.
During the analysis stage, feedback from the stakeholder groups would be compared to determine areas of agreement as well as areas of divergence


