

Key Insights
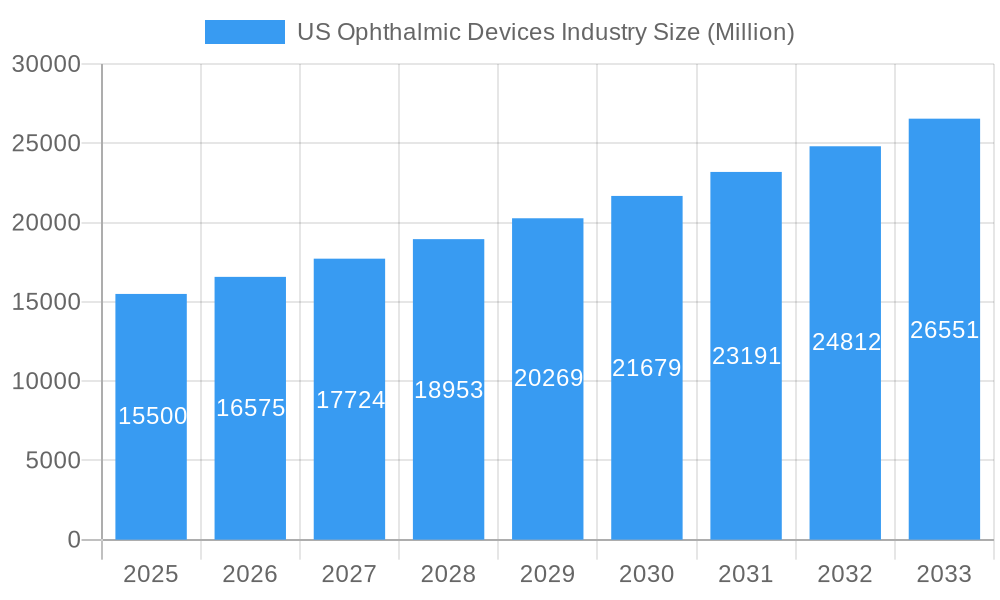
The U.S. Ophthalmic Devices Market is projected for substantial expansion, forecasted to reach approximately $20.5 billion by 2025, driven by a Compound Annual Growth Rate (CAGR) of 8.6% through 2033. This growth is attributed to rising incidences of age-related eye diseases like cataracts and glaucoma, escalating demand for vision correction, and significant technological innovations in diagnostic and surgical ophthalmic equipment. The aging U.S. demographic is a key factor, as older individuals are more prone to vision impairments requiring advanced ophthalmic interventions. Increased public awareness of eye health and the availability of sophisticated treatment options further propel market growth. Innovations in laser surgery, advanced intraocular lenses (IOLs), and sophisticated diagnostic imaging systems are enhancing patient outcomes and boosting market demand for ophthalmic devices.
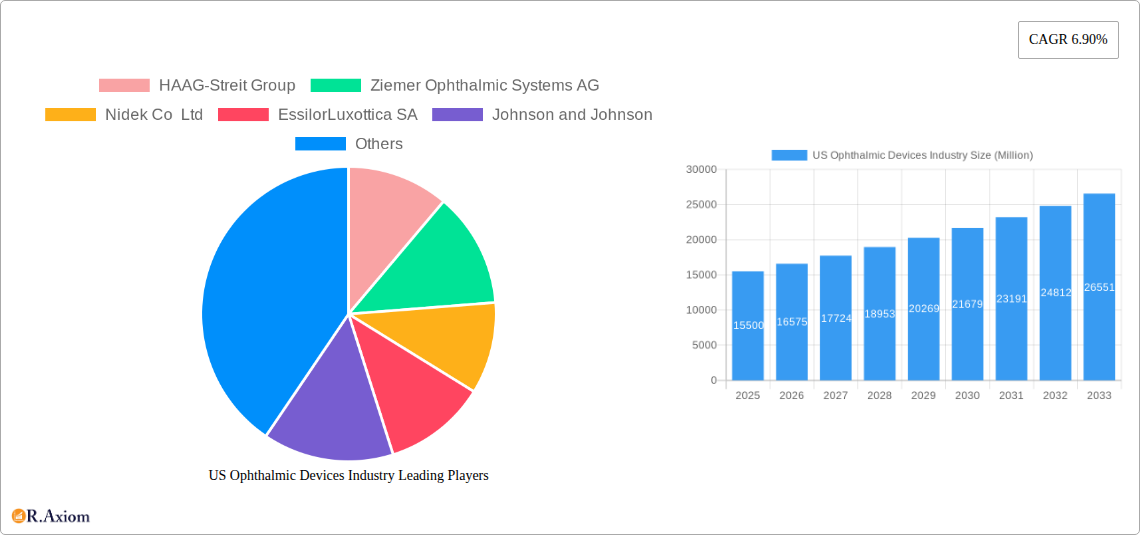
US Ophthalmic Devices Industry Market Size (In Billion)
Market segmentation highlights key growth areas. Surgical ophthalmic devices, including glaucoma drainage devices, stents, implants, and advanced IOLs, are anticipated to experience significant expansion due to the increasing volume of eye surgeries. Diagnostic and monitoring ophthalmic devices, such as optical coherence tomography (OCT) scanners and ophthalmic ultrasound systems, are vital for early detection and precise management of ocular diseases. Vision correction ophthalmic devices, encompassing spectacles and contact lenses, remain a robust segment driven by the widespread need for refractive error correction. Leading companies like Alcon Inc., Johnson & Johnson, and EssilorLuxottica SA are actively engaged in research and development, strategic alliances, and acquisitions to secure their market positions. However, factors such as high healthcare costs and reimbursement policies may pose challenges to growth in specific sub-segments of the ophthalmic devices market.
US Ophthalmic Devices Industry Company Market Share
This detailed report provides an SEO-optimized overview of the U.S. Ophthalmic Devices Industry, incorporating relevant keywords and market data.
US Ophthalmic Devices Industry Market Concentration & Innovation
The US ophthalmic devices market exhibits a moderate to high concentration, characterized by the presence of established global players alongside innovative niche manufacturers. Leading companies such as Johnson and Johnson, Alcon Inc, Carl Zeiss AG, and EssilorLuxottica SA hold significant market share, driven by extensive product portfolios and robust R&D investments. Innovation is a paramount driver, with a consistent influx of advanced technologies in surgical, diagnostic, and vision correction segments. Key innovation areas include minimally invasive surgical tools for glaucoma and cataracts, AI-driven diagnostic imaging, and personalized lens technologies. The regulatory framework, primarily governed by the FDA, plays a crucial role in market access and product approval, necessitating rigorous clinical validation. Product substitutes, while present, are often overcome by superior efficacy, safety profiles, and technological advancements offered by cutting-edge ophthalmic devices. End-user trends are leaning towards less invasive procedures, faster recovery times, and enhanced visual outcomes, fueling demand for sophisticated devices. Mergers and acquisitions (M&A) activities continue to shape the competitive landscape, with strategic acquisitions aimed at expanding product lines and market reach. Recent M&A deals, with values in the hundreds of millions, underscore the consolidation trend.
US Ophthalmic Devices Industry Industry Trends & Insights
The US ophthalmic devices industry is poised for substantial growth, propelled by a confluence of demographic shifts, technological advancements, and increasing healthcare expenditure. The projected Compound Annual Growth Rate (CAGR) for the forecast period (2025–2033) is estimated at approximately 7.5%, indicating a dynamic and expanding market. Key growth drivers include the aging US population, leading to a higher prevalence of age-related eye conditions such as cataracts, glaucoma, and age-related macular degeneration. Advancements in surgical technologies, particularly in minimally invasive glaucoma surgery (MIGS) and laser refractive surgery, are revolutionizing patient care and expanding treatment options. Optical coherence tomography (OCT) scanners, autorefractors, and corneal topography systems are witnessing increased adoption due to their ability to provide precise diagnostics and personalized treatment plans. Consumer preferences are shifting towards proactive eye health management and premium vision correction solutions, including advanced multifocal contact lenses and custom-designed spectacles. The competitive landscape is intense, with companies continuously investing in R&D to introduce next-generation ophthalmic equipment and therapies. Market penetration of advanced diagnostic and surgical devices is steadily increasing as healthcare providers and payers recognize the long-term cost-effectiveness and improved patient outcomes associated with these technologies. The integration of artificial intelligence (AI) in diagnostic imaging and treatment planning is also emerging as a significant disruptive force, promising enhanced accuracy and efficiency.
Dominant Markets & Segments in US Ophthalmic Devices Industry
The United States holds a dominant position within the global ophthalmic devices market, characterized by high per capita healthcare spending, advanced technological adoption, and a robust regulatory environment. Within the US, the market for Surgical Devices is particularly significant. This segment's dominance is driven by the high prevalence of age-related eye conditions necessitating surgical interventions.
- Intraocular Lenses (IOLs): This sub-segment is a major revenue generator, propelled by the widespread performance of cataract surgeries. Advancements in premium IOLs, such as toric and multifocal options, cater to the growing demand for spectacle independence and improved visual quality, contributing significantly to market value. The estimated market size for IOLs is in the billions of dollars.
- Glaucoma Drainage Devices and Glaucoma Stents and Implants: With the rising incidence of glaucoma, particularly among the aging population, these sub-segments are experiencing robust growth. The push towards minimally invasive glaucoma surgery (MIGS) solutions is a key driver, offering improved safety profiles and faster recovery times compared to traditional procedures. The market for MIGS devices is projected to grow at a substantial CAGR.
- Lasers: Ophthalmic lasers are crucial for refractive surgeries (LASIK, PRK) and treating various retinal conditions. Continuous technological innovation in laser systems, leading to greater precision and reduced invasiveness, further solidifies their importance.
- Other Surgical Devices: This encompasses a range of instruments and devices used in various ophthalmic procedures, from vitrectomy to strabismus surgery, all contributing to the overall strength of the surgical segment.
The Diagnostic and Monitoring Devices segment also exhibits substantial strength and growth potential.
- Optical Coherence Tomography (OCT) Scanners: OCT technology has become indispensable for diagnosing and monitoring a wide array of retinal diseases. Its ability to provide cross-sectional images of the retina with high resolution makes it a cornerstone of modern ophthalmology. The market penetration of advanced OCT systems is high and continues to expand.
- Autorefractors and Keratometers: These essential tools for routine eye examinations and pre-operative assessments are fundamental to the diagnostics segment. Their widespread use in optometry and ophthalmology practices ensures consistent demand.
- Corneal Topography Systems: Critical for diagnosing conditions like keratoconus and for planning refractive surgeries and contact lens fittings, these systems are integral to comprehensive eye care.
- Ophthalmic Ultrasound Imaging Systems and Ophthalmoscopes: While foundational, these devices continue to be vital for certain diagnostic procedures, contributing to the overall segment's market size.
The Vision Correction Devices segment, while mature, continues to be a significant contributor.
- Spectacles: Despite advancements, spectacles remain the most common form of vision correction globally. The market is driven by fashion trends, technological innovations in lens materials and coatings, and the sheer volume of the population requiring vision correction.
- Contact Lenses: The contact lens market is characterized by a growing demand for specialty lenses, including multifocal, toric, and extended-wear options, driven by convenience and improved visual acuity. The market size for contact lenses is in the billions of dollars.
US Ophthalmic Devices Industry Product Developments
The US ophthalmic devices industry is a hotbed of product innovation, driven by advancements in miniaturization, imaging technology, and biocompatible materials. Key developments focus on enhancing surgical precision and patient outcomes, exemplified by next-generation intraocular lenses offering broader ranges of vision correction and improved accommodative capabilities. Minimally invasive glaucoma surgical devices are continuously evolving, aiming for even greater efficacy and reduced risk profiles. In diagnostics, the integration of AI into OCT scanners and other imaging devices is revolutionizing early disease detection and progression monitoring. Furthermore, advancements in laser technologies are enabling faster and more precise procedures for refractive correction and various ocular surface conditions. These innovations are creating significant competitive advantages for companies that can effectively translate novel technologies into market-ready solutions.
Report Scope & Segmentation Analysis
This report meticulously analyzes the US Ophthalmic Devices Industry across its key segments. The Surgical Devices segment, including Glaucoma Drainage Devices, Glaucoma Stents and Implants, Intraocular Lenses, and Lasers, is projected to experience a robust CAGR driven by an aging population and technological advancements in minimally invasive procedures. The Diagnostic and Monitoring Devices segment, encompassing Autorefractors and Keratometers, Corneal Topography Systems, Ophthalmic Ultrasound Imaging Systems, Ophthalmoscopes, and Optical Coherence Tomography Scanners, is anticipated to grow significantly due to increasing demand for early disease detection and personalized treatment strategies, with OCT scanners leading the charge. The Vision Correction Devices segment, comprising Spectacles and Contact Lenses, while more mature, will see steady growth fueled by ongoing innovation in lens technology and evolving consumer preferences for convenience and superior visual performance. Market sizes for each segment are projected to reach billions of dollars within the forecast period.
Key Drivers of US Ophthalmic Devices Industry Growth
Several pivotal factors are propelling the growth of the US ophthalmic devices industry.
- Demographic Shifts: The aging US population is a primary driver, leading to increased incidence of age-related eye diseases like cataracts and glaucoma.
- Technological Advancements: Continuous innovation in surgical instrumentation, diagnostic imaging (e.g., AI-enhanced OCT), and vision correction technologies enhances efficacy and patient outcomes.
- Rising Healthcare Expenditure: Increased investment in healthcare infrastructure and advanced medical technologies fuels the adoption of sophisticated ophthalmic devices.
- Growing Awareness and Demand for Eye Care: Enhanced patient awareness regarding eye health and a preference for early intervention and vision correction contribute to market expansion.
- Favorable Regulatory Environment: A well-established regulatory framework (FDA) ensures product quality and safety, fostering trust and market acceptance.
Challenges in the US Ophthalmic Devices Industry Sector
Despite robust growth prospects, the US ophthalmic devices industry faces several significant challenges.
- Stringent Regulatory Approval Processes: Obtaining FDA clearance for new devices can be lengthy and costly, requiring extensive clinical trials and data.
- High Research and Development Costs: Developing cutting-edge ophthalmic technologies demands substantial financial investment, posing a barrier for smaller companies.
- Reimbursement Policies: Evolving reimbursement landscapes and potential reductions in insurance coverage for certain procedures or devices can impact market access and adoption rates.
- Intense Competition: The presence of major global players and emerging innovators leads to fierce competition, pressuring profit margins and necessitating continuous innovation.
- Supply Chain Disruptions: Global supply chain volatility can affect the availability of raw materials and components, potentially impacting production schedules and costs.
Emerging Opportunities in US Ophthalmic Devices Industry
The US ophthalmic devices industry is ripe with emerging opportunities, driven by evolving patient needs and technological frontiers.
- Minimally Invasive Glaucoma Surgery (MIGS): The expanding market for MIGS offers significant growth potential as surgeons and patients seek safer, less invasive treatment options for glaucoma.
- Artificial Intelligence (AI) in Diagnostics: Integrating AI into diagnostic imaging platforms promises to enhance diagnostic accuracy, personalize treatment plans, and improve efficiency, creating new revenue streams.
- Teleophthalmology: The increasing adoption of telemedicine for remote patient monitoring and consultations presents opportunities for connected ophthalmic devices and platforms.
- Personalized Vision Correction: Advanced lens technologies, including custom-designed spectacles and specialized contact lenses, cater to growing consumer demand for tailored visual solutions.
- Emerging Markets within the US: Focusing on underserved populations and regions with increasing demand for eye care services can unlock new market segments.
Leading Players in the US Ophthalmic Devices Industry Market
- HAAG-Streit Group
- Ziemer Ophthalmic Systems AG
- Nidek Co Ltd
- EssilorLuxottica SA
- Johnson and Johnson
- Carl Zeiss AG
- Topcon Corporation
- Alcon Inc
- Bausch Health Companies Inc
- Hoya Corporation
Key Developments in US Ophthalmic Devices Industry Industry
- November 2022: Sight Sciences reported a publication of clinical data demonstrating the standalone effectiveness of the OMNI Surgical System in pseudophakic glaucoma patients with uncontrolled pressure following a previous combination cataract stent procedure. This development highlights progress in glaucoma management and the efficacy of standalone MIGS procedures.
- August 2022: Glaukos Corporation, an ophthalmic medical technology and pharmaceutical company focused on novel therapies for the treatment of glaucoma, corneal disorders, and retinal diseases, received 510(k) clearance from the U.S. Food and Drug Administration (FDA) for the iStent infinite Trabecular Micro-Bypass System indicated for use in a standalone procedure to reduce elevated intraocular pressure (IOP) in patients with primary open-angle glaucoma uncontrolled by prior medical and surgical therapy. This clearance signifies advancements in standalone MIGS options and expands treatment possibilities for glaucoma patients.
Strategic Outlook for US Ophthalmic Devices Industry Market
The strategic outlook for the US ophthalmic devices industry is highly positive, driven by sustained innovation and increasing demand for advanced eye care solutions. Companies are expected to focus on developing and commercializing technologies that offer improved patient outcomes, enhanced procedural efficiency, and greater accessibility. The ongoing integration of digital technologies, including AI and telemedicine, will be critical for future success. Strategic partnerships and collaborations will likely accelerate product development and market penetration. Furthermore, a continued emphasis on minimally invasive surgical techniques and personalized vision correction will shape product portfolios. The industry's ability to navigate regulatory landscapes effectively and adapt to evolving reimbursement policies will be crucial for capitalizing on the substantial growth potential and maintaining a competitive edge in this dynamic market.
US Ophthalmic Devices Industry Segmentation
-
1. Devices
-
1.1. Surgical Devices
- 1.1.1. Glaucoma Drainage Devices
- 1.1.2. Glaucoma Stents and Implants
- 1.1.3. Intraocular Lenses
- 1.1.4. Lasers
- 1.1.5. Other Surgical Devices
-
1.2. Diagnostic and Monitoring Devices
- 1.2.1. Autorefractors and Keratometers
- 1.2.2. Corneal Topography Systems
- 1.2.3. Ophthalmic Ultrasound Imaging Systems
- 1.2.4. Ophthalmoscopes
- 1.2.5. Optical Coherence Tomography Scanners
- 1.2.6. Other Diagnostic and Monitoring Devices
-
1.3. Vision Correction Devices
- 1.3.1. Spectacles
- 1.3.2. Contact Lenses
-
1.1. Surgical Devices
US Ophthalmic Devices Industry Segmentation By Geography
-
1. North America
- 1.1. United States
- 1.2. Canada
- 1.3. Mexico
-
2. South America
- 2.1. Brazil
- 2.2. Argentina
- 2.3. Rest of South America
-
3. Europe
- 3.1. United Kingdom
- 3.2. Germany
- 3.3. France
- 3.4. Italy
- 3.5. Spain
- 3.6. Russia
- 3.7. Benelux
- 3.8. Nordics
- 3.9. Rest of Europe
-
4. Middle East & Africa
- 4.1. Turkey
- 4.2. Israel
- 4.3. GCC
- 4.4. North Africa
- 4.5. South Africa
- 4.6. Rest of Middle East & Africa
-
5. Asia Pacific
- 5.1. China
- 5.2. India
- 5.3. Japan
- 5.4. South Korea
- 5.5. ASEAN
- 5.6. Oceania
- 5.7. Rest of Asia Pacific
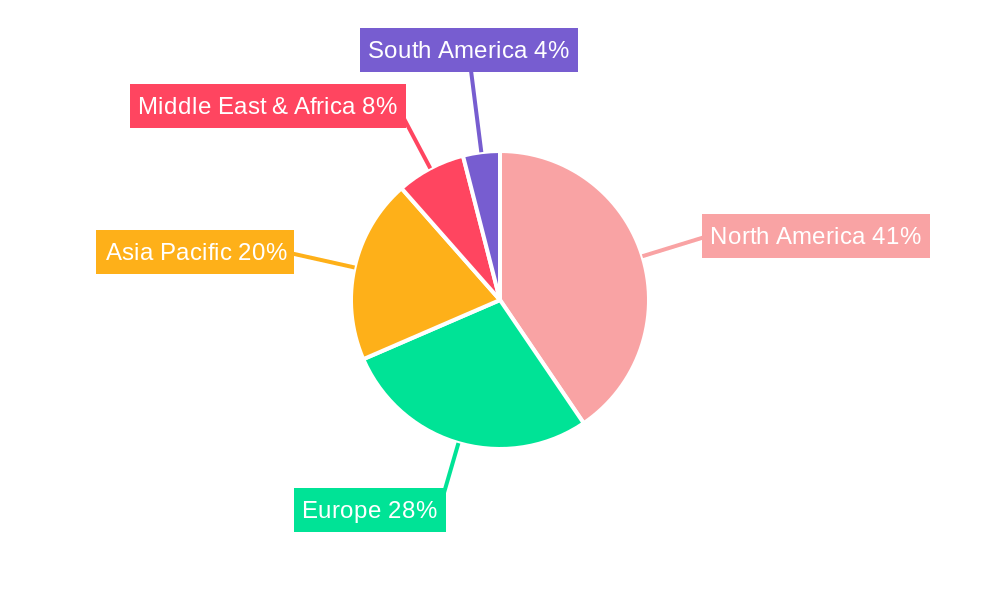
US Ophthalmic Devices Industry Regional Market Share
Geographic Coverage of US Ophthalmic Devices Industry
US Ophthalmic Devices Industry REPORT HIGHLIGHTS
| Aspects | Details |
|---|---|
| Study Period | 2020-2034 |
| Base Year | 2025 |
| Estimated Year | 2026 |
| Forecast Period | 2026-2034 |
| Historical Period | 2020-2025 |
| Growth Rate | CAGR of 8.6% from 2020-2034 |
| Segmentation |
|
Table of Contents
- 1. Introduction
- 1.1. Research Scope
- 1.2. Market Segmentation
- 1.3. Research Objective
- 1.4. Definitions and Assumptions
- 2. Executive Summary
- 2.1. Market Snapshot
- 3. Market Dynamics
- 3.1. Market Drivers
- 3.2. Market Restrains
- 3.3. Market Trends
- 3.4. Market Opportunities
- 4. Market Factor Analysis
- 4.1. Porters Five Forces
- 4.1.1. Bargaining Power of Suppliers
- 4.1.2. Bargaining Power of Buyers
- 4.1.3. Threat of New Entrants
- 4.1.4. Threat of Substitutes
- 4.1.5. Competitive Rivalry
- 4.2. PESTEL analysis
- 4.3. BCG Analysis
- 4.3.1. Stars (High Growth, High Market Share)
- 4.3.2. Cash Cows (Low Growth, High Market Share)
- 4.3.3. Question Mark (High Growth, Low Market Share)
- 4.3.4. Dogs (Low Growth, Low Market Share)
- 4.4. Ansoff Matrix Analysis
- 4.5. Supply Chain Analysis
- 4.6. Regulatory Landscape
- 4.7. Current Market Potential and Opportunity Assessment (TAM–SAM–SOM Framework)
- 4.8. RAX Analyst Note
- 4.1. Porters Five Forces
- 5. Market Analysis, Insights and Forecast 2021-2033
- 5.1. Market Analysis, Insights and Forecast - by Devices
- 5.1.1. Surgical Devices
- 5.1.1.1. Glaucoma Drainage Devices
- 5.1.1.2. Glaucoma Stents and Implants
- 5.1.1.3. Intraocular Lenses
- 5.1.1.4. Lasers
- 5.1.1.5. Other Surgical Devices
- 5.1.2. Diagnostic and Monitoring Devices
- 5.1.2.1. Autorefractors and Keratometers
- 5.1.2.2. Corneal Topography Systems
- 5.1.2.3. Ophthalmic Ultrasound Imaging Systems
- 5.1.2.4. Ophthalmoscopes
- 5.1.2.5. Optical Coherence Tomography Scanners
- 5.1.2.6. Other Diagnostic and Monitoring Devices
- 5.1.3. Vision Correction Devices
- 5.1.3.1. Spectacles
- 5.1.3.2. Contact Lenses
- 5.1.1. Surgical Devices
- 5.2. Market Analysis, Insights and Forecast - by Region
- 5.2.1. North America
- 5.2.2. South America
- 5.2.3. Europe
- 5.2.4. Middle East & Africa
- 5.2.5. Asia Pacific
- 5.1. Market Analysis, Insights and Forecast - by Devices
- 6. Global US Ophthalmic Devices Industry Analysis, Insights and Forecast, 2021-2033
- 6.1. Market Analysis, Insights and Forecast - by Devices
- 6.1.1. Surgical Devices
- 6.1.1.1. Glaucoma Drainage Devices
- 6.1.1.2. Glaucoma Stents and Implants
- 6.1.1.3. Intraocular Lenses
- 6.1.1.4. Lasers
- 6.1.1.5. Other Surgical Devices
- 6.1.2. Diagnostic and Monitoring Devices
- 6.1.2.1. Autorefractors and Keratometers
- 6.1.2.2. Corneal Topography Systems
- 6.1.2.3. Ophthalmic Ultrasound Imaging Systems
- 6.1.2.4. Ophthalmoscopes
- 6.1.2.5. Optical Coherence Tomography Scanners
- 6.1.2.6. Other Diagnostic and Monitoring Devices
- 6.1.3. Vision Correction Devices
- 6.1.3.1. Spectacles
- 6.1.3.2. Contact Lenses
- 6.1.1. Surgical Devices
- 6.1. Market Analysis, Insights and Forecast - by Devices
- 7. North America US Ophthalmic Devices Industry Analysis, Insights and Forecast, 2020-2032
- 7.1. Market Analysis, Insights and Forecast - by Devices
- 7.1.1. Surgical Devices
- 7.1.1.1. Glaucoma Drainage Devices
- 7.1.1.2. Glaucoma Stents and Implants
- 7.1.1.3. Intraocular Lenses
- 7.1.1.4. Lasers
- 7.1.1.5. Other Surgical Devices
- 7.1.2. Diagnostic and Monitoring Devices
- 7.1.2.1. Autorefractors and Keratometers
- 7.1.2.2. Corneal Topography Systems
- 7.1.2.3. Ophthalmic Ultrasound Imaging Systems
- 7.1.2.4. Ophthalmoscopes
- 7.1.2.5. Optical Coherence Tomography Scanners
- 7.1.2.6. Other Diagnostic and Monitoring Devices
- 7.1.3. Vision Correction Devices
- 7.1.3.1. Spectacles
- 7.1.3.2. Contact Lenses
- 7.1.1. Surgical Devices
- 7.1. Market Analysis, Insights and Forecast - by Devices
- 8. South America US Ophthalmic Devices Industry Analysis, Insights and Forecast, 2020-2032
- 8.1. Market Analysis, Insights and Forecast - by Devices
- 8.1.1. Surgical Devices
- 8.1.1.1. Glaucoma Drainage Devices
- 8.1.1.2. Glaucoma Stents and Implants
- 8.1.1.3. Intraocular Lenses
- 8.1.1.4. Lasers
- 8.1.1.5. Other Surgical Devices
- 8.1.2. Diagnostic and Monitoring Devices
- 8.1.2.1. Autorefractors and Keratometers
- 8.1.2.2. Corneal Topography Systems
- 8.1.2.3. Ophthalmic Ultrasound Imaging Systems
- 8.1.2.4. Ophthalmoscopes
- 8.1.2.5. Optical Coherence Tomography Scanners
- 8.1.2.6. Other Diagnostic and Monitoring Devices
- 8.1.3. Vision Correction Devices
- 8.1.3.1. Spectacles
- 8.1.3.2. Contact Lenses
- 8.1.1. Surgical Devices
- 8.1. Market Analysis, Insights and Forecast - by Devices
- 9. Europe US Ophthalmic Devices Industry Analysis, Insights and Forecast, 2020-2032
- 9.1. Market Analysis, Insights and Forecast - by Devices
- 9.1.1. Surgical Devices
- 9.1.1.1. Glaucoma Drainage Devices
- 9.1.1.2. Glaucoma Stents and Implants
- 9.1.1.3. Intraocular Lenses
- 9.1.1.4. Lasers
- 9.1.1.5. Other Surgical Devices
- 9.1.2. Diagnostic and Monitoring Devices
- 9.1.2.1. Autorefractors and Keratometers
- 9.1.2.2. Corneal Topography Systems
- 9.1.2.3. Ophthalmic Ultrasound Imaging Systems
- 9.1.2.4. Ophthalmoscopes
- 9.1.2.5. Optical Coherence Tomography Scanners
- 9.1.2.6. Other Diagnostic and Monitoring Devices
- 9.1.3. Vision Correction Devices
- 9.1.3.1. Spectacles
- 9.1.3.2. Contact Lenses
- 9.1.1. Surgical Devices
- 9.1. Market Analysis, Insights and Forecast - by Devices
- 10. Middle East & Africa US Ophthalmic Devices Industry Analysis, Insights and Forecast, 2020-2032
- 10.1. Market Analysis, Insights and Forecast - by Devices
- 10.1.1. Surgical Devices
- 10.1.1.1. Glaucoma Drainage Devices
- 10.1.1.2. Glaucoma Stents and Implants
- 10.1.1.3. Intraocular Lenses
- 10.1.1.4. Lasers
- 10.1.1.5. Other Surgical Devices
- 10.1.2. Diagnostic and Monitoring Devices
- 10.1.2.1. Autorefractors and Keratometers
- 10.1.2.2. Corneal Topography Systems
- 10.1.2.3. Ophthalmic Ultrasound Imaging Systems
- 10.1.2.4. Ophthalmoscopes
- 10.1.2.5. Optical Coherence Tomography Scanners
- 10.1.2.6. Other Diagnostic and Monitoring Devices
- 10.1.3. Vision Correction Devices
- 10.1.3.1. Spectacles
- 10.1.3.2. Contact Lenses
- 10.1.1. Surgical Devices
- 10.1. Market Analysis, Insights and Forecast - by Devices
- 11. Asia Pacific US Ophthalmic Devices Industry Analysis, Insights and Forecast, 2020-2032
- 11.1. Market Analysis, Insights and Forecast - by Devices
- 11.1.1. Surgical Devices
- 11.1.1.1. Glaucoma Drainage Devices
- 11.1.1.2. Glaucoma Stents and Implants
- 11.1.1.3. Intraocular Lenses
- 11.1.1.4. Lasers
- 11.1.1.5. Other Surgical Devices
- 11.1.2. Diagnostic and Monitoring Devices
- 11.1.2.1. Autorefractors and Keratometers
- 11.1.2.2. Corneal Topography Systems
- 11.1.2.3. Ophthalmic Ultrasound Imaging Systems
- 11.1.2.4. Ophthalmoscopes
- 11.1.2.5. Optical Coherence Tomography Scanners
- 11.1.2.6. Other Diagnostic and Monitoring Devices
- 11.1.3. Vision Correction Devices
- 11.1.3.1. Spectacles
- 11.1.3.2. Contact Lenses
- 11.1.1. Surgical Devices
- 11.1. Market Analysis, Insights and Forecast - by Devices
- 12. Competitive Analysis
- 12.1. Company Profiles
- 12.1.1 HAAG-Streit Group
- 12.1.1.1. Company Overview
- 12.1.1.2. Products
- 12.1.1.3. Company Financials
- 12.1.1.4. SWOT Analysis
- 12.1.2 Ziemer Ophthalmic Systems AG
- 12.1.2.1. Company Overview
- 12.1.2.2. Products
- 12.1.2.3. Company Financials
- 12.1.2.4. SWOT Analysis
- 12.1.3 Nidek Co Ltd
- 12.1.3.1. Company Overview
- 12.1.3.2. Products
- 12.1.3.3. Company Financials
- 12.1.3.4. SWOT Analysis
- 12.1.4 EssilorLuxottica SA
- 12.1.4.1. Company Overview
- 12.1.4.2. Products
- 12.1.4.3. Company Financials
- 12.1.4.4. SWOT Analysis
- 12.1.5 Johnson and Johnson
- 12.1.5.1. Company Overview
- 12.1.5.2. Products
- 12.1.5.3. Company Financials
- 12.1.5.4. SWOT Analysis
- 12.1.6 Carl Zeiss AG
- 12.1.6.1. Company Overview
- 12.1.6.2. Products
- 12.1.6.3. Company Financials
- 12.1.6.4. SWOT Analysis
- 12.1.7 Topcon Corporation
- 12.1.7.1. Company Overview
- 12.1.7.2. Products
- 12.1.7.3. Company Financials
- 12.1.7.4. SWOT Analysis
- 12.1.8 Alcon Inc
- 12.1.8.1. Company Overview
- 12.1.8.2. Products
- 12.1.8.3. Company Financials
- 12.1.8.4. SWOT Analysis
- 12.1.9 Bausch Health Companies Inc
- 12.1.9.1. Company Overview
- 12.1.9.2. Products
- 12.1.9.3. Company Financials
- 12.1.9.4. SWOT Analysis
- 12.1.10 Hoya Corporation
- 12.1.10.1. Company Overview
- 12.1.10.2. Products
- 12.1.10.3. Company Financials
- 12.1.10.4. SWOT Analysis
- 12.1.1 HAAG-Streit Group
- 12.2. Market Entropy
- 12.2.1 Company's Key Areas Served
- 12.2.2 Recent Developments
- 12.3. Company Market Share Analysis 2025
- 12.3.1 Top 5 Companies Market Share Analysis
- 12.3.2 Top 3 Companies Market Share Analysis
- 12.4. List of Potential Customers
- 13. Research Methodology
List of Figures
- Figure 1: Global US Ophthalmic Devices Industry Revenue Breakdown (billion, %) by Region 2025 & 2033
- Figure 2: Global US Ophthalmic Devices Industry Volume Breakdown (K Unit, %) by Region 2025 & 2033
- Figure 3: North America US Ophthalmic Devices Industry Revenue (billion), by Devices 2025 & 2033
- Figure 4: North America US Ophthalmic Devices Industry Volume (K Unit), by Devices 2025 & 2033
- Figure 5: North America US Ophthalmic Devices Industry Revenue Share (%), by Devices 2025 & 2033
- Figure 6: North America US Ophthalmic Devices Industry Volume Share (%), by Devices 2025 & 2033
- Figure 7: North America US Ophthalmic Devices Industry Revenue (billion), by Country 2025 & 2033
- Figure 8: North America US Ophthalmic Devices Industry Volume (K Unit), by Country 2025 & 2033
- Figure 9: North America US Ophthalmic Devices Industry Revenue Share (%), by Country 2025 & 2033
- Figure 10: North America US Ophthalmic Devices Industry Volume Share (%), by Country 2025 & 2033
- Figure 11: South America US Ophthalmic Devices Industry Revenue (billion), by Devices 2025 & 2033
- Figure 12: South America US Ophthalmic Devices Industry Volume (K Unit), by Devices 2025 & 2033
- Figure 13: South America US Ophthalmic Devices Industry Revenue Share (%), by Devices 2025 & 2033
- Figure 14: South America US Ophthalmic Devices Industry Volume Share (%), by Devices 2025 & 2033
- Figure 15: South America US Ophthalmic Devices Industry Revenue (billion), by Country 2025 & 2033
- Figure 16: South America US Ophthalmic Devices Industry Volume (K Unit), by Country 2025 & 2033
- Figure 17: South America US Ophthalmic Devices Industry Revenue Share (%), by Country 2025 & 2033
- Figure 18: South America US Ophthalmic Devices Industry Volume Share (%), by Country 2025 & 2033
- Figure 19: Europe US Ophthalmic Devices Industry Revenue (billion), by Devices 2025 & 2033
- Figure 20: Europe US Ophthalmic Devices Industry Volume (K Unit), by Devices 2025 & 2033
- Figure 21: Europe US Ophthalmic Devices Industry Revenue Share (%), by Devices 2025 & 2033
- Figure 22: Europe US Ophthalmic Devices Industry Volume Share (%), by Devices 2025 & 2033
- Figure 23: Europe US Ophthalmic Devices Industry Revenue (billion), by Country 2025 & 2033
- Figure 24: Europe US Ophthalmic Devices Industry Volume (K Unit), by Country 2025 & 2033
- Figure 25: Europe US Ophthalmic Devices Industry Revenue Share (%), by Country 2025 & 2033
- Figure 26: Europe US Ophthalmic Devices Industry Volume Share (%), by Country 2025 & 2033
- Figure 27: Middle East & Africa US Ophthalmic Devices Industry Revenue (billion), by Devices 2025 & 2033
- Figure 28: Middle East & Africa US Ophthalmic Devices Industry Volume (K Unit), by Devices 2025 & 2033
- Figure 29: Middle East & Africa US Ophthalmic Devices Industry Revenue Share (%), by Devices 2025 & 2033
- Figure 30: Middle East & Africa US Ophthalmic Devices Industry Volume Share (%), by Devices 2025 & 2033
- Figure 31: Middle East & Africa US Ophthalmic Devices Industry Revenue (billion), by Country 2025 & 2033
- Figure 32: Middle East & Africa US Ophthalmic Devices Industry Volume (K Unit), by Country 2025 & 2033
- Figure 33: Middle East & Africa US Ophthalmic Devices Industry Revenue Share (%), by Country 2025 & 2033
- Figure 34: Middle East & Africa US Ophthalmic Devices Industry Volume Share (%), by Country 2025 & 2033
- Figure 35: Asia Pacific US Ophthalmic Devices Industry Revenue (billion), by Devices 2025 & 2033
- Figure 36: Asia Pacific US Ophthalmic Devices Industry Volume (K Unit), by Devices 2025 & 2033
- Figure 37: Asia Pacific US Ophthalmic Devices Industry Revenue Share (%), by Devices 2025 & 2033
- Figure 38: Asia Pacific US Ophthalmic Devices Industry Volume Share (%), by Devices 2025 & 2033
- Figure 39: Asia Pacific US Ophthalmic Devices Industry Revenue (billion), by Country 2025 & 2033
- Figure 40: Asia Pacific US Ophthalmic Devices Industry Volume (K Unit), by Country 2025 & 2033
- Figure 41: Asia Pacific US Ophthalmic Devices Industry Revenue Share (%), by Country 2025 & 2033
- Figure 42: Asia Pacific US Ophthalmic Devices Industry Volume Share (%), by Country 2025 & 2033
List of Tables
- Table 1: Global US Ophthalmic Devices Industry Revenue billion Forecast, by Devices 2020 & 2033
- Table 2: Global US Ophthalmic Devices Industry Volume K Unit Forecast, by Devices 2020 & 2033
- Table 3: Global US Ophthalmic Devices Industry Revenue billion Forecast, by Region 2020 & 2033
- Table 4: Global US Ophthalmic Devices Industry Volume K Unit Forecast, by Region 2020 & 2033
- Table 5: Global US Ophthalmic Devices Industry Revenue billion Forecast, by Devices 2020 & 2033
- Table 6: Global US Ophthalmic Devices Industry Volume K Unit Forecast, by Devices 2020 & 2033
- Table 7: Global US Ophthalmic Devices Industry Revenue billion Forecast, by Country 2020 & 2033
- Table 8: Global US Ophthalmic Devices Industry Volume K Unit Forecast, by Country 2020 & 2033
- Table 9: United States US Ophthalmic Devices Industry Revenue (billion) Forecast, by Application 2020 & 2033
- Table 10: United States US Ophthalmic Devices Industry Volume (K Unit) Forecast, by Application 2020 & 2033
- Table 11: Canada US Ophthalmic Devices Industry Revenue (billion) Forecast, by Application 2020 & 2033
- Table 12: Canada US Ophthalmic Devices Industry Volume (K Unit) Forecast, by Application 2020 & 2033
- Table 13: Mexico US Ophthalmic Devices Industry Revenue (billion) Forecast, by Application 2020 & 2033
- Table 14: Mexico US Ophthalmic Devices Industry Volume (K Unit) Forecast, by Application 2020 & 2033
- Table 15: Global US Ophthalmic Devices Industry Revenue billion Forecast, by Devices 2020 & 2033
- Table 16: Global US Ophthalmic Devices Industry Volume K Unit Forecast, by Devices 2020 & 2033
- Table 17: Global US Ophthalmic Devices Industry Revenue billion Forecast, by Country 2020 & 2033
- Table 18: Global US Ophthalmic Devices Industry Volume K Unit Forecast, by Country 2020 & 2033
- Table 19: Brazil US Ophthalmic Devices Industry Revenue (billion) Forecast, by Application 2020 & 2033
- Table 20: Brazil US Ophthalmic Devices Industry Volume (K Unit) Forecast, by Application 2020 & 2033
- Table 21: Argentina US Ophthalmic Devices Industry Revenue (billion) Forecast, by Application 2020 & 2033
- Table 22: Argentina US Ophthalmic Devices Industry Volume (K Unit) Forecast, by Application 2020 & 2033
- Table 23: Rest of South America US Ophthalmic Devices Industry Revenue (billion) Forecast, by Application 2020 & 2033
- Table 24: Rest of South America US Ophthalmic Devices Industry Volume (K Unit) Forecast, by Application 2020 & 2033
- Table 25: Global US Ophthalmic Devices Industry Revenue billion Forecast, by Devices 2020 & 2033
- Table 26: Global US Ophthalmic Devices Industry Volume K Unit Forecast, by Devices 2020 & 2033
- Table 27: Global US Ophthalmic Devices Industry Revenue billion Forecast, by Country 2020 & 2033
- Table 28: Global US Ophthalmic Devices Industry Volume K Unit Forecast, by Country 2020 & 2033
- Table 29: United Kingdom US Ophthalmic Devices Industry Revenue (billion) Forecast, by Application 2020 & 2033
- Table 30: United Kingdom US Ophthalmic Devices Industry Volume (K Unit) Forecast, by Application 2020 & 2033
- Table 31: Germany US Ophthalmic Devices Industry Revenue (billion) Forecast, by Application 2020 & 2033
- Table 32: Germany US Ophthalmic Devices Industry Volume (K Unit) Forecast, by Application 2020 & 2033
- Table 33: France US Ophthalmic Devices Industry Revenue (billion) Forecast, by Application 2020 & 2033
- Table 34: France US Ophthalmic Devices Industry Volume (K Unit) Forecast, by Application 2020 & 2033
- Table 35: Italy US Ophthalmic Devices Industry Revenue (billion) Forecast, by Application 2020 & 2033
- Table 36: Italy US Ophthalmic Devices Industry Volume (K Unit) Forecast, by Application 2020 & 2033
- Table 37: Spain US Ophthalmic Devices Industry Revenue (billion) Forecast, by Application 2020 & 2033
- Table 38: Spain US Ophthalmic Devices Industry Volume (K Unit) Forecast, by Application 2020 & 2033
- Table 39: Russia US Ophthalmic Devices Industry Revenue (billion) Forecast, by Application 2020 & 2033
- Table 40: Russia US Ophthalmic Devices Industry Volume (K Unit) Forecast, by Application 2020 & 2033
- Table 41: Benelux US Ophthalmic Devices Industry Revenue (billion) Forecast, by Application 2020 & 2033
- Table 42: Benelux US Ophthalmic Devices Industry Volume (K Unit) Forecast, by Application 2020 & 2033
- Table 43: Nordics US Ophthalmic Devices Industry Revenue (billion) Forecast, by Application 2020 & 2033
- Table 44: Nordics US Ophthalmic Devices Industry Volume (K Unit) Forecast, by Application 2020 & 2033
- Table 45: Rest of Europe US Ophthalmic Devices Industry Revenue (billion) Forecast, by Application 2020 & 2033
- Table 46: Rest of Europe US Ophthalmic Devices Industry Volume (K Unit) Forecast, by Application 2020 & 2033
- Table 47: Global US Ophthalmic Devices Industry Revenue billion Forecast, by Devices 2020 & 2033
- Table 48: Global US Ophthalmic Devices Industry Volume K Unit Forecast, by Devices 2020 & 2033
- Table 49: Global US Ophthalmic Devices Industry Revenue billion Forecast, by Country 2020 & 2033
- Table 50: Global US Ophthalmic Devices Industry Volume K Unit Forecast, by Country 2020 & 2033
- Table 51: Turkey US Ophthalmic Devices Industry Revenue (billion) Forecast, by Application 2020 & 2033
- Table 52: Turkey US Ophthalmic Devices Industry Volume (K Unit) Forecast, by Application 2020 & 2033
- Table 53: Israel US Ophthalmic Devices Industry Revenue (billion) Forecast, by Application 2020 & 2033
- Table 54: Israel US Ophthalmic Devices Industry Volume (K Unit) Forecast, by Application 2020 & 2033
- Table 55: GCC US Ophthalmic Devices Industry Revenue (billion) Forecast, by Application 2020 & 2033
- Table 56: GCC US Ophthalmic Devices Industry Volume (K Unit) Forecast, by Application 2020 & 2033
- Table 57: North Africa US Ophthalmic Devices Industry Revenue (billion) Forecast, by Application 2020 & 2033
- Table 58: North Africa US Ophthalmic Devices Industry Volume (K Unit) Forecast, by Application 2020 & 2033
- Table 59: South Africa US Ophthalmic Devices Industry Revenue (billion) Forecast, by Application 2020 & 2033
- Table 60: South Africa US Ophthalmic Devices Industry Volume (K Unit) Forecast, by Application 2020 & 2033
- Table 61: Rest of Middle East & Africa US Ophthalmic Devices Industry Revenue (billion) Forecast, by Application 2020 & 2033
- Table 62: Rest of Middle East & Africa US Ophthalmic Devices Industry Volume (K Unit) Forecast, by Application 2020 & 2033
- Table 63: Global US Ophthalmic Devices Industry Revenue billion Forecast, by Devices 2020 & 2033
- Table 64: Global US Ophthalmic Devices Industry Volume K Unit Forecast, by Devices 2020 & 2033
- Table 65: Global US Ophthalmic Devices Industry Revenue billion Forecast, by Country 2020 & 2033
- Table 66: Global US Ophthalmic Devices Industry Volume K Unit Forecast, by Country 2020 & 2033
- Table 67: China US Ophthalmic Devices Industry Revenue (billion) Forecast, by Application 2020 & 2033
- Table 68: China US Ophthalmic Devices Industry Volume (K Unit) Forecast, by Application 2020 & 2033
- Table 69: India US Ophthalmic Devices Industry Revenue (billion) Forecast, by Application 2020 & 2033
- Table 70: India US Ophthalmic Devices Industry Volume (K Unit) Forecast, by Application 2020 & 2033
- Table 71: Japan US Ophthalmic Devices Industry Revenue (billion) Forecast, by Application 2020 & 2033
- Table 72: Japan US Ophthalmic Devices Industry Volume (K Unit) Forecast, by Application 2020 & 2033
- Table 73: South Korea US Ophthalmic Devices Industry Revenue (billion) Forecast, by Application 2020 & 2033
- Table 74: South Korea US Ophthalmic Devices Industry Volume (K Unit) Forecast, by Application 2020 & 2033
- Table 75: ASEAN US Ophthalmic Devices Industry Revenue (billion) Forecast, by Application 2020 & 2033
- Table 76: ASEAN US Ophthalmic Devices Industry Volume (K Unit) Forecast, by Application 2020 & 2033
- Table 77: Oceania US Ophthalmic Devices Industry Revenue (billion) Forecast, by Application 2020 & 2033
- Table 78: Oceania US Ophthalmic Devices Industry Volume (K Unit) Forecast, by Application 2020 & 2033
- Table 79: Rest of Asia Pacific US Ophthalmic Devices Industry Revenue (billion) Forecast, by Application 2020 & 2033
- Table 80: Rest of Asia Pacific US Ophthalmic Devices Industry Volume (K Unit) Forecast, by Application 2020 & 2033
Frequently Asked Questions
1. What is the projected Compound Annual Growth Rate (CAGR) of the US Ophthalmic Devices Industry?
The projected CAGR is approximately 8.6%.
2. Which companies are prominent players in the US Ophthalmic Devices Industry?
Key companies in the market include HAAG-Streit Group, Ziemer Ophthalmic Systems AG, Nidek Co Ltd, EssilorLuxottica SA, Johnson and Johnson, Carl Zeiss AG, Topcon Corporation, Alcon Inc, Bausch Health Companies Inc, Hoya Corporation.
3. What are the main segments of the US Ophthalmic Devices Industry?
The market segments include Devices.
4. Can you provide details about the market size?
The market size is estimated to be USD 20.5 billion as of 2022.
5. What are some drivers contributing to market growth?
Demographic Shift and Increasing Prevalence of Eye Diseases; Rising Geriatric Population; Technological Advancements in Ophthalmic Devices.
6. What are the notable trends driving market growth?
Contact Lens are Expected to Register a Significant Growth in the United States Ophthalmic Devices Market Over the Forecast Period.
7. Are there any restraints impacting market growth?
Risk Associated with Ophthalmic Procedures.
8. Can you provide examples of recent developments in the market?
November 2022: Sight Sciences reported a publication of clinical data demonstrating the standalone effectiveness of the OMNI Surgical System in pseudophakic glaucoma patients with uncontrolled pressure following a previous combination cataract stent procedure.
9. What pricing options are available for accessing the report?
Pricing options include single-user, multi-user, and enterprise licenses priced at USD 3800, USD 4500, and USD 5800 respectively.
10. Is the market size provided in terms of value or volume?
The market size is provided in terms of value, measured in billion and volume, measured in K Unit.
11. Are there any specific market keywords associated with the report?
Yes, the market keyword associated with the report is "US Ophthalmic Devices Industry," which aids in identifying and referencing the specific market segment covered.
12. How do I determine which pricing option suits my needs best?
The pricing options vary based on user requirements and access needs. Individual users may opt for single-user licenses, while businesses requiring broader access may choose multi-user or enterprise licenses for cost-effective access to the report.
13. Are there any additional resources or data provided in the US Ophthalmic Devices Industry report?
While the report offers comprehensive insights, it's advisable to review the specific contents or supplementary materials provided to ascertain if additional resources or data are available.
14. How can I stay updated on further developments or reports in the US Ophthalmic Devices Industry?
To stay informed about further developments, trends, and reports in the US Ophthalmic Devices Industry, consider subscribing to industry newsletters, following relevant companies and organizations, or regularly checking reputable industry news sources and publications.
Methodology
Step 1 - Identification of Relevant Samples Size from Population Database


Step 2 - Approaches for Defining Global Market Size (Value, Volume* & Price*)

Note*: In applicable scenarios
Step 3 - Data Sources
Primary Research
- Web Analytics
- Survey Reports
- Research Institute
- Latest Research Reports
- Opinion Leaders
Secondary Research
- Annual Reports
- White Paper
- Latest Press Release
- Industry Association
- Paid Database
- Investor Presentations

Step 4 - Data Triangulation
Involves using different sources of information in order to increase the validity of a study
These sources are likely to be stakeholders in a program - participants, other researchers, program staff, other community members, and so on.
Then we put all data in single framework & apply various statistical tools to find out the dynamic on the market.
During the analysis stage, feedback from the stakeholder groups would be compared to determine areas of agreement as well as areas of divergence