
Key Insights
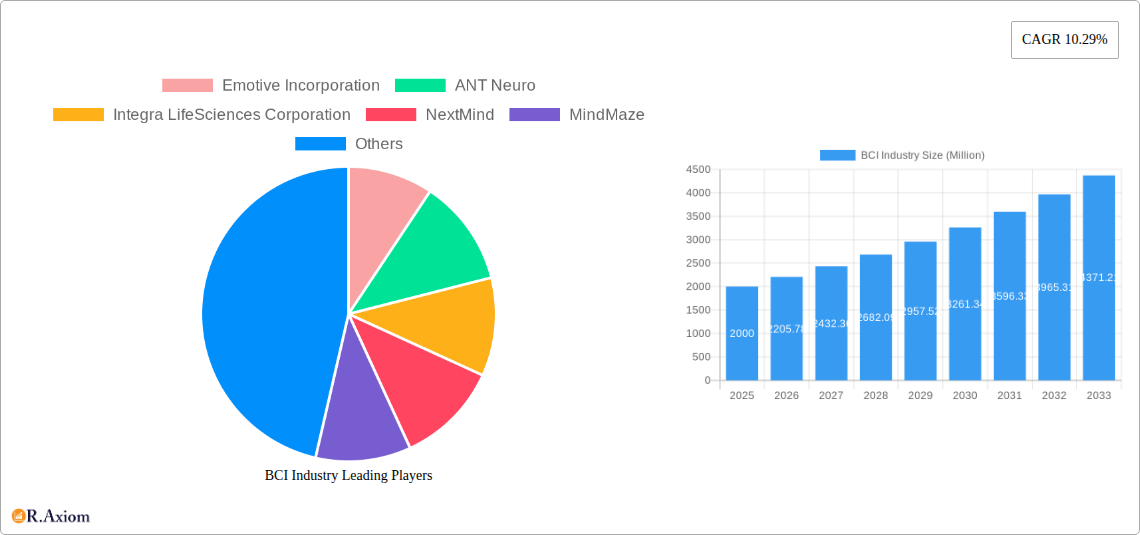
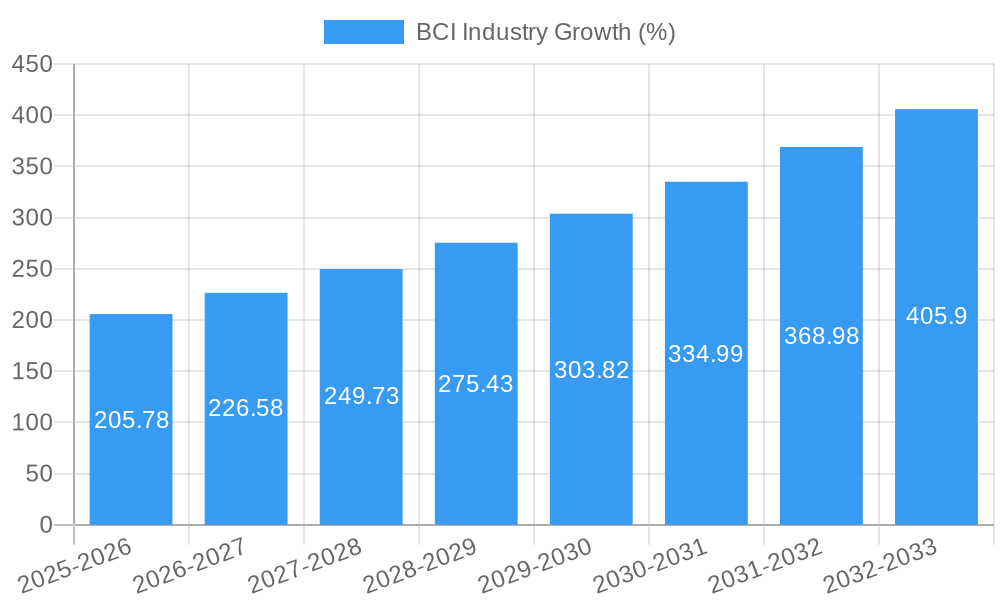
The Brain-Computer Interface (BCI) market is experiencing robust growth, projected to reach \$2.00 billion in 2025 and expand significantly over the forecast period (2025-2033). A Compound Annual Growth Rate (CAGR) of 10.29% indicates substantial market expansion driven by several key factors. Technological advancements in non-invasive BCI systems, making them more accessible and affordable, are a primary driver. Increasing prevalence of neurological disorders and the rising demand for effective rehabilitation solutions further fuel market growth. The restorative applications of BCIs, particularly in addressing disabilities and repairing brain function, are major market segments. While the invasive BCI segment holds a larger share currently due to its efficacy in specific applications, the non-invasive segment is expected to witness faster growth due to its lower risk profile and increased user acceptance. Furthermore, growing investments in research and development by both public and private entities are contributing to market expansion, leading to innovations in areas like improved signal processing, enhanced user interfaces, and miniaturization of devices.
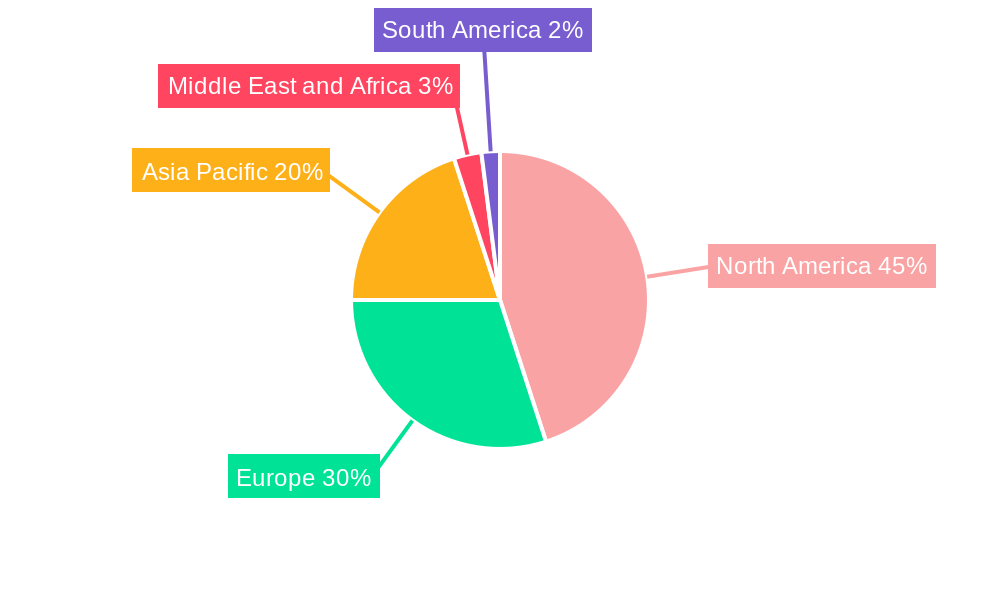
Competition within the BCI industry is intensifying, with established medical device companies like Medtronic and Natus Medical, alongside innovative startups like Emotiv and NextMind, vying for market share. Geographical distribution reflects a strong presence in North America and Europe, driven by advanced healthcare infrastructure and regulatory support. However, the Asia-Pacific region is anticipated to exhibit rapid growth due to the increasing prevalence of neurological diseases, growing healthcare expenditure, and a burgeoning technological landscape. Regulatory hurdles related to safety and efficacy, along with the high cost of BCI devices and procedures, represent some challenges that need to be addressed. Nevertheless, ongoing technological improvements, coupled with a growing awareness of the potential of BCIs, are poised to propel the market to unprecedented heights in the coming years. Future advancements might include the development of more sophisticated algorithms for decoding brain signals, leading to enhanced precision and efficacy in various applications.
Brain-Computer Interface (BCI) Industry Market Report: 2019-2033
This comprehensive report provides an in-depth analysis of the global Brain-Computer Interface (BCI) industry, offering invaluable insights for stakeholders, investors, and industry professionals. With a study period spanning 2019-2033, a base year of 2025, and an estimated year of 2025, this report forecasts market trends through 2033, analyzing historical data from 2019-2024. The report values the market in Millions of USD.
BCI Industry Market Concentration & Innovation
This section analyzes the competitive landscape of the BCI industry, examining market concentration, innovation drivers, regulatory frameworks, substitute products, end-user trends, and mergers & acquisitions (M&A) activities. The report reveals a moderately concentrated market with several key players holding significant market share. For example, Medtronic PLC and Integra LifeSciences Corporation are estimated to hold xx% and xx% of the market share respectively in 2025. The industry is characterized by high innovation, driven by advancements in neuroscience, microelectronics, and artificial intelligence. Regulatory hurdles, particularly concerning safety and efficacy, pose a significant challenge. The report details the impact of these regulations on market growth. Furthermore, it explores the influence of substitute technologies and evolving end-user preferences on market dynamics. M&A activities, with estimated deal values totaling xx Million in 2024, suggest a trend of consolidation within the industry. Specific deals are analyzed with respect to their impact on the market landscape. The report offers a granular analysis of market concentration metrics and identifies key innovation drivers and their influence on industry growth trajectories over the forecast period.
BCI Industry Industry Trends & Insights
This section delves into the key trends and insights shaping the BCI industry. The market is experiencing robust growth, with a Compound Annual Growth Rate (CAGR) projected at xx% from 2025 to 2033. Technological disruptions, such as advancements in machine learning algorithms and miniaturization of sensors, are fueling market expansion. Changing consumer preferences, notably an increasing acceptance of minimally invasive procedures and rising demand for improved quality of life, are driving market penetration. The competitive dynamics are analyzed, showcasing the strategies employed by leading players such as Emotive Incorporation, Integra LifeSciences Corporation, and Medtronic PLC to maintain market leadership. Specific examples are given to illustrate the increasing sophistication of BCI technology and its integration into various healthcare applications. Market penetration rates for different BCI types (invasive and non-invasive) are projected based on current trends and technological advancements.
Dominant Markets & Segments in BCI Industry
This section identifies the dominant markets and segments within the BCI industry. North America is projected as the leading region, driven by robust healthcare infrastructure, advanced research capabilities, and high adoption rates of innovative medical technologies. Within this region, the United States holds a substantial market share.
Key Drivers for North American Dominance:
- Strong regulatory support for medical device innovation.
- High healthcare expenditure and insurance coverage.
- Extensive research and development activities in neuroscience.
Segment Analysis:
The Non-invasive Brain-computer Interface segment is anticipated to dominate the "By Type" category due to its lower invasiveness, reduced risks and cost-effectiveness, while the "Restoration of Disabilities" application segment is likely to lead the "By Application" category due to the significant unmet medical needs in this area. A detailed analysis of the growth drivers for each segment is presented, considering economic policies and technological advances. The report provides a detailed analysis of market size and growth projections for each segment, highlighting their competitive dynamics.
BCI Industry Product Developments
Recent product innovations in the BCI industry showcase advancements in miniaturization, improved signal processing, and enhanced user interfaces. These advancements lead to increased comfort, reliability, and accuracy. Technological trends, such as the integration of artificial intelligence and machine learning, are driving the development of more sophisticated and adaptable BCI systems. Many new products are targeting specific applications, providing better market fit and clinical outcomes. The competitive advantage lies in the unique features and capabilities of each device, along with its efficiency and ease of use.
Report Scope & Segmentation Analysis
This report segments the BCI market by type (Invasive Brain-computer Interface, Non-invasive Brain-computer Interface, Other Types) and application (Restoration of Disabilities, Repair of Brain Function, Other Applications). Each segment's growth projections, market size estimates for 2025, and competitive dynamics are detailed. The invasive BCI segment is characterized by high growth potential but is limited by higher risks and costs. The non-invasive segment experiences relatively faster growth due to the higher market acceptance and affordability. The "Restoration of Disabilities" application segment showcases the largest market share, while the "Repair of Brain Function" segment is experiencing significant growth fueled by technological breakthroughs. The detailed segment analysis facilitates strategic decision-making for both established players and new entrants in the industry.
Key Drivers of BCI Industry Growth
Several factors drive the growth of the BCI industry. Technological advancements, particularly in areas such as neuroimaging, sensor technology, and signal processing, have been pivotal. Economic factors like increasing healthcare spending and government funding for research and development contribute significantly. Furthermore, supportive regulatory frameworks that facilitate innovation and market entry accelerate market expansion. The increasing prevalence of neurological disorders and the rising demand for improved quality of life also play crucial roles.
Challenges in the BCI Industry Sector
The BCI industry faces several challenges, including regulatory hurdles related to device safety and efficacy, which lead to significant delays in product approvals. Supply chain complexities and the high cost of manufacturing can constrain growth. Intense competition among established players and emerging companies poses an additional pressure. These challenges, along with their quantitative impacts on market growth and profitability, are carefully analyzed.
Emerging Opportunities in BCI Industry
The BCI industry presents significant emerging opportunities. Expansion into new therapeutic applications, such as treatment of depression and anxiety, holds substantial promise. Development of new and improved technologies, such as wireless and implantable BCI systems, will further increase market growth. Moreover, changes in consumer preferences, particularly an increasing willingness to adopt BCI technology for health improvement, will broaden the market's reach.
Leading Players in the BCI Industry Market
- Emotive Incorporation
- ANT Neuro
- Integra LifeSciences Corporation
- NextMind
- MindMaze
- NIRx Medical Technologies
- Natus Medical Inc
- Compumedics Ltd
- Medtronic PLC
- Advanced Brain Monitoring Inc
- NeuroSky
- Brain Products GmbH
- Cadwell Industries Inc
- g tec medical engineering GmbH
- Nihon Kohden Corporation
Key Developments in BCI Industry Industry
- 2024 Q4: Medtronic PLC announced the launch of a new implantable BCI system.
- 2023 Q3: Integra LifeSciences Corporation acquired a smaller BCI company, expanding its product portfolio.
- 2022 Q2: Significant investment in R&D across the industry resulting in multiple patents filed. (Specific examples of products and their impact can be provided within the complete report)
- (Further key developments with year/month and impact details will be included in the full report)
Strategic Outlook for BCI Industry Market
The BCI industry is poised for significant growth, driven by continued technological innovation, increasing adoption of advanced healthcare technologies, and expansion into new applications. The future market potential is substantial, driven by advancements in data analytics and machine learning, resulting in more personalized and effective BCI solutions. This will lead to greater market penetration and an overall growth in the industry. The strategic outlook focuses on the opportunities presented by these developments, guiding companies to capitalize on this rapid technological advancement and expansion in various application areas.
BCI Industry Segmentation
-
1. Type
- 1.1. Invasive Brain-computer Interface
- 1.2. Non-invasive Brain-computer Interface
- 1.3. Other Types
-
2. Application
- 2.1. Restoration of Disabilities
- 2.2. Repair of Brain Function
- 2.3. Other Applications
BCI Industry Segmentation By Geography
-
1. North America
- 1.1. United States
- 1.2. Canada
- 1.3. Mexico
-
2. Europe
- 2.1. Germany
- 2.2. United Kingdom
- 2.3. France
- 2.4. Italy
- 2.5. Spain
- 2.6. Rest of Europe
-
3. Asia Pacific
- 3.1. China
- 3.2. Japan
- 3.3. India
- 3.4. Australia
- 3.5. South Korea
- 3.6. Rest of Asia Pacific
-
4. Middle East and Africa
- 4.1. GCC
- 4.2. South Africa
- 4.3. Rest of Middle East and Africa
-
5. South America
- 5.1. Brazil
- 5.2. Argentina
- 5.3. Rest of South America
BCI Industry REPORT HIGHLIGHTS
| Aspects | Details |
|---|---|
| Study Period | 2019-2033 |
| Base Year | 2024 |
| Estimated Year | 2025 |
| Forecast Period | 2025-2033 |
| Historical Period | 2019-2024 |
| Growth Rate | CAGR of 10.29% from 2019-2033 |
| Segmentation |
|
Table of Contents
- 1. Introduction
- 1.1. Research Scope
- 1.2. Market Segmentation
- 1.3. Research Methodology
- 1.4. Definitions and Assumptions
- 2. Executive Summary
- 2.1. Introduction
- 3. Market Dynamics
- 3.1. Introduction
- 3.2. Market Drivers
- 3.2.1. Increasing Prevalence of Neurodegenerative Disorders; Rising R&D Activities by Government to Improve the Brain-computer Interface Technology; Various Technological Advancements such as Miniaturization of Devices
- 3.3. Market Restrains
- 3.3.1. High Cost of Brain-computer Interface Devices; Lack of Expertise in Implementing the Systems
- 3.4. Market Trends
- 3.4.1. The Non-invasive Brain-computer Interface Segment is Expected to Dominate the Market During the Forecast Period
- 4. Market Factor Analysis
- 4.1. Porters Five Forces
- 4.2. Supply/Value Chain
- 4.3. PESTEL analysis
- 4.4. Market Entropy
- 4.5. Patent/Trademark Analysis
- 5. Global BCI Industry Analysis, Insights and Forecast, 2019-2031
- 5.1. Market Analysis, Insights and Forecast - by Type
- 5.1.1. Invasive Brain-computer Interface
- 5.1.2. Non-invasive Brain-computer Interface
- 5.1.3. Other Types
- 5.2. Market Analysis, Insights and Forecast - by Application
- 5.2.1. Restoration of Disabilities
- 5.2.2. Repair of Brain Function
- 5.2.3. Other Applications
- 5.3. Market Analysis, Insights and Forecast - by Region
- 5.3.1. North America
- 5.3.2. Europe
- 5.3.3. Asia Pacific
- 5.3.4. Middle East and Africa
- 5.3.5. South America
- 5.1. Market Analysis, Insights and Forecast - by Type
- 6. North America BCI Industry Analysis, Insights and Forecast, 2019-2031
- 6.1. Market Analysis, Insights and Forecast - by Type
- 6.1.1. Invasive Brain-computer Interface
- 6.1.2. Non-invasive Brain-computer Interface
- 6.1.3. Other Types
- 6.2. Market Analysis, Insights and Forecast - by Application
- 6.2.1. Restoration of Disabilities
- 6.2.2. Repair of Brain Function
- 6.2.3. Other Applications
- 6.1. Market Analysis, Insights and Forecast - by Type
- 7. Europe BCI Industry Analysis, Insights and Forecast, 2019-2031
- 7.1. Market Analysis, Insights and Forecast - by Type
- 7.1.1. Invasive Brain-computer Interface
- 7.1.2. Non-invasive Brain-computer Interface
- 7.1.3. Other Types
- 7.2. Market Analysis, Insights and Forecast - by Application
- 7.2.1. Restoration of Disabilities
- 7.2.2. Repair of Brain Function
- 7.2.3. Other Applications
- 7.1. Market Analysis, Insights and Forecast - by Type
- 8. Asia Pacific BCI Industry Analysis, Insights and Forecast, 2019-2031
- 8.1. Market Analysis, Insights and Forecast - by Type
- 8.1.1. Invasive Brain-computer Interface
- 8.1.2. Non-invasive Brain-computer Interface
- 8.1.3. Other Types
- 8.2. Market Analysis, Insights and Forecast - by Application
- 8.2.1. Restoration of Disabilities
- 8.2.2. Repair of Brain Function
- 8.2.3. Other Applications
- 8.1. Market Analysis, Insights and Forecast - by Type
- 9. Middle East and Africa BCI Industry Analysis, Insights and Forecast, 2019-2031
- 9.1. Market Analysis, Insights and Forecast - by Type
- 9.1.1. Invasive Brain-computer Interface
- 9.1.2. Non-invasive Brain-computer Interface
- 9.1.3. Other Types
- 9.2. Market Analysis, Insights and Forecast - by Application
- 9.2.1. Restoration of Disabilities
- 9.2.2. Repair of Brain Function
- 9.2.3. Other Applications
- 9.1. Market Analysis, Insights and Forecast - by Type
- 10. South America BCI Industry Analysis, Insights and Forecast, 2019-2031
- 10.1. Market Analysis, Insights and Forecast - by Type
- 10.1.1. Invasive Brain-computer Interface
- 10.1.2. Non-invasive Brain-computer Interface
- 10.1.3. Other Types
- 10.2. Market Analysis, Insights and Forecast - by Application
- 10.2.1. Restoration of Disabilities
- 10.2.2. Repair of Brain Function
- 10.2.3. Other Applications
- 10.1. Market Analysis, Insights and Forecast - by Type
- 11. North America BCI Industry Analysis, Insights and Forecast, 2019-2031
- 11.1. Market Analysis, Insights and Forecast - By Country/Sub-region
- 11.1.1 United States
- 11.1.2 Canada
- 11.1.3 Mexico
- 12. Europe BCI Industry Analysis, Insights and Forecast, 2019-2031
- 12.1. Market Analysis, Insights and Forecast - By Country/Sub-region
- 12.1.1 Germany
- 12.1.2 United Kingdom
- 12.1.3 France
- 12.1.4 Italy
- 12.1.5 Spain
- 12.1.6 Rest of Europe
- 13. Asia Pacific BCI Industry Analysis, Insights and Forecast, 2019-2031
- 13.1. Market Analysis, Insights and Forecast - By Country/Sub-region
- 13.1.1 China
- 13.1.2 Japan
- 13.1.3 India
- 13.1.4 Australia
- 13.1.5 South Korea
- 13.1.6 Rest of Asia Pacific
- 14. Middle East and Africa BCI Industry Analysis, Insights and Forecast, 2019-2031
- 14.1. Market Analysis, Insights and Forecast - By Country/Sub-region
- 14.1.1 GCC
- 14.1.2 South Africa
- 14.1.3 Rest of Middle East and Africa
- 15. South America BCI Industry Analysis, Insights and Forecast, 2019-2031
- 15.1. Market Analysis, Insights and Forecast - By Country/Sub-region
- 15.1.1 Brazil
- 15.1.2 Argentina
- 15.1.3 Rest of South America
- 16. Competitive Analysis
- 16.1. Global Market Share Analysis 2024
- 16.2. Company Profiles
- 16.2.1 Emotive Incorporation
- 16.2.1.1. Overview
- 16.2.1.2. Products
- 16.2.1.3. SWOT Analysis
- 16.2.1.4. Recent Developments
- 16.2.1.5. Financials (Based on Availability)
- 16.2.2 ANT Neuro
- 16.2.2.1. Overview
- 16.2.2.2. Products
- 16.2.2.3. SWOT Analysis
- 16.2.2.4. Recent Developments
- 16.2.2.5. Financials (Based on Availability)
- 16.2.3 Integra LifeSciences Corporation
- 16.2.3.1. Overview
- 16.2.3.2. Products
- 16.2.3.3. SWOT Analysis
- 16.2.3.4. Recent Developments
- 16.2.3.5. Financials (Based on Availability)
- 16.2.4 NextMind
- 16.2.4.1. Overview
- 16.2.4.2. Products
- 16.2.4.3. SWOT Analysis
- 16.2.4.4. Recent Developments
- 16.2.4.5. Financials (Based on Availability)
- 16.2.5 MindMaze
- 16.2.5.1. Overview
- 16.2.5.2. Products
- 16.2.5.3. SWOT Analysis
- 16.2.5.4. Recent Developments
- 16.2.5.5. Financials (Based on Availability)
- 16.2.6 NIRx Medical Technologies
- 16.2.6.1. Overview
- 16.2.6.2. Products
- 16.2.6.3. SWOT Analysis
- 16.2.6.4. Recent Developments
- 16.2.6.5. Financials (Based on Availability)
- 16.2.7 Natus Medical Inc
- 16.2.7.1. Overview
- 16.2.7.2. Products
- 16.2.7.3. SWOT Analysis
- 16.2.7.4. Recent Developments
- 16.2.7.5. Financials (Based on Availability)
- 16.2.8 Compumedics Ltd
- 16.2.8.1. Overview
- 16.2.8.2. Products
- 16.2.8.3. SWOT Analysis
- 16.2.8.4. Recent Developments
- 16.2.8.5. Financials (Based on Availability)
- 16.2.9 Medtronic PLC
- 16.2.9.1. Overview
- 16.2.9.2. Products
- 16.2.9.3. SWOT Analysis
- 16.2.9.4. Recent Developments
- 16.2.9.5. Financials (Based on Availability)
- 16.2.10 Advanced Brain Monitoring Inc
- 16.2.10.1. Overview
- 16.2.10.2. Products
- 16.2.10.3. SWOT Analysis
- 16.2.10.4. Recent Developments
- 16.2.10.5. Financials (Based on Availability)
- 16.2.11 NeuroSky
- 16.2.11.1. Overview
- 16.2.11.2. Products
- 16.2.11.3. SWOT Analysis
- 16.2.11.4. Recent Developments
- 16.2.11.5. Financials (Based on Availability)
- 16.2.12 Brain Products GmbH
- 16.2.12.1. Overview
- 16.2.12.2. Products
- 16.2.12.3. SWOT Analysis
- 16.2.12.4. Recent Developments
- 16.2.12.5. Financials (Based on Availability)
- 16.2.13 Cadwell Industries Inc
- 16.2.13.1. Overview
- 16.2.13.2. Products
- 16.2.13.3. SWOT Analysis
- 16.2.13.4. Recent Developments
- 16.2.13.5. Financials (Based on Availability)
- 16.2.14 g tec medical engineering GmbH
- 16.2.14.1. Overview
- 16.2.14.2. Products
- 16.2.14.3. SWOT Analysis
- 16.2.14.4. Recent Developments
- 16.2.14.5. Financials (Based on Availability)
- 16.2.15 Nihon Kohden Corporation
- 16.2.15.1. Overview
- 16.2.15.2. Products
- 16.2.15.3. SWOT Analysis
- 16.2.15.4. Recent Developments
- 16.2.15.5. Financials (Based on Availability)
- 16.2.1 Emotive Incorporation
List of Figures
- Figure 1: Global BCI Industry Revenue Breakdown (Million, %) by Region 2024 & 2032
- Figure 2: Global BCI Industry Volume Breakdown (K Unit, %) by Region 2024 & 2032
- Figure 3: North America BCI Industry Revenue (Million), by Country 2024 & 2032
- Figure 4: North America BCI Industry Volume (K Unit), by Country 2024 & 2032
- Figure 5: North America BCI Industry Revenue Share (%), by Country 2024 & 2032
- Figure 6: North America BCI Industry Volume Share (%), by Country 2024 & 2032
- Figure 7: Europe BCI Industry Revenue (Million), by Country 2024 & 2032
- Figure 8: Europe BCI Industry Volume (K Unit), by Country 2024 & 2032
- Figure 9: Europe BCI Industry Revenue Share (%), by Country 2024 & 2032
- Figure 10: Europe BCI Industry Volume Share (%), by Country 2024 & 2032
- Figure 11: Asia Pacific BCI Industry Revenue (Million), by Country 2024 & 2032
- Figure 12: Asia Pacific BCI Industry Volume (K Unit), by Country 2024 & 2032
- Figure 13: Asia Pacific BCI Industry Revenue Share (%), by Country 2024 & 2032
- Figure 14: Asia Pacific BCI Industry Volume Share (%), by Country 2024 & 2032
- Figure 15: Middle East and Africa BCI Industry Revenue (Million), by Country 2024 & 2032
- Figure 16: Middle East and Africa BCI Industry Volume (K Unit), by Country 2024 & 2032
- Figure 17: Middle East and Africa BCI Industry Revenue Share (%), by Country 2024 & 2032
- Figure 18: Middle East and Africa BCI Industry Volume Share (%), by Country 2024 & 2032
- Figure 19: South America BCI Industry Revenue (Million), by Country 2024 & 2032
- Figure 20: South America BCI Industry Volume (K Unit), by Country 2024 & 2032
- Figure 21: South America BCI Industry Revenue Share (%), by Country 2024 & 2032
- Figure 22: South America BCI Industry Volume Share (%), by Country 2024 & 2032
- Figure 23: North America BCI Industry Revenue (Million), by Type 2024 & 2032
- Figure 24: North America BCI Industry Volume (K Unit), by Type 2024 & 2032
- Figure 25: North America BCI Industry Revenue Share (%), by Type 2024 & 2032
- Figure 26: North America BCI Industry Volume Share (%), by Type 2024 & 2032
- Figure 27: North America BCI Industry Revenue (Million), by Application 2024 & 2032
- Figure 28: North America BCI Industry Volume (K Unit), by Application 2024 & 2032
- Figure 29: North America BCI Industry Revenue Share (%), by Application 2024 & 2032
- Figure 30: North America BCI Industry Volume Share (%), by Application 2024 & 2032
- Figure 31: North America BCI Industry Revenue (Million), by Country 2024 & 2032
- Figure 32: North America BCI Industry Volume (K Unit), by Country 2024 & 2032
- Figure 33: North America BCI Industry Revenue Share (%), by Country 2024 & 2032
- Figure 34: North America BCI Industry Volume Share (%), by Country 2024 & 2032
- Figure 35: Europe BCI Industry Revenue (Million), by Type 2024 & 2032
- Figure 36: Europe BCI Industry Volume (K Unit), by Type 2024 & 2032
- Figure 37: Europe BCI Industry Revenue Share (%), by Type 2024 & 2032
- Figure 38: Europe BCI Industry Volume Share (%), by Type 2024 & 2032
- Figure 39: Europe BCI Industry Revenue (Million), by Application 2024 & 2032
- Figure 40: Europe BCI Industry Volume (K Unit), by Application 2024 & 2032
- Figure 41: Europe BCI Industry Revenue Share (%), by Application 2024 & 2032
- Figure 42: Europe BCI Industry Volume Share (%), by Application 2024 & 2032
- Figure 43: Europe BCI Industry Revenue (Million), by Country 2024 & 2032
- Figure 44: Europe BCI Industry Volume (K Unit), by Country 2024 & 2032
- Figure 45: Europe BCI Industry Revenue Share (%), by Country 2024 & 2032
- Figure 46: Europe BCI Industry Volume Share (%), by Country 2024 & 2032
- Figure 47: Asia Pacific BCI Industry Revenue (Million), by Type 2024 & 2032
- Figure 48: Asia Pacific BCI Industry Volume (K Unit), by Type 2024 & 2032
- Figure 49: Asia Pacific BCI Industry Revenue Share (%), by Type 2024 & 2032
- Figure 50: Asia Pacific BCI Industry Volume Share (%), by Type 2024 & 2032
- Figure 51: Asia Pacific BCI Industry Revenue (Million), by Application 2024 & 2032
- Figure 52: Asia Pacific BCI Industry Volume (K Unit), by Application 2024 & 2032
- Figure 53: Asia Pacific BCI Industry Revenue Share (%), by Application 2024 & 2032
- Figure 54: Asia Pacific BCI Industry Volume Share (%), by Application 2024 & 2032
- Figure 55: Asia Pacific BCI Industry Revenue (Million), by Country 2024 & 2032
- Figure 56: Asia Pacific BCI Industry Volume (K Unit), by Country 2024 & 2032
- Figure 57: Asia Pacific BCI Industry Revenue Share (%), by Country 2024 & 2032
- Figure 58: Asia Pacific BCI Industry Volume Share (%), by Country 2024 & 2032
- Figure 59: Middle East and Africa BCI Industry Revenue (Million), by Type 2024 & 2032
- Figure 60: Middle East and Africa BCI Industry Volume (K Unit), by Type 2024 & 2032
- Figure 61: Middle East and Africa BCI Industry Revenue Share (%), by Type 2024 & 2032
- Figure 62: Middle East and Africa BCI Industry Volume Share (%), by Type 2024 & 2032
- Figure 63: Middle East and Africa BCI Industry Revenue (Million), by Application 2024 & 2032
- Figure 64: Middle East and Africa BCI Industry Volume (K Unit), by Application 2024 & 2032
- Figure 65: Middle East and Africa BCI Industry Revenue Share (%), by Application 2024 & 2032
- Figure 66: Middle East and Africa BCI Industry Volume Share (%), by Application 2024 & 2032
- Figure 67: Middle East and Africa BCI Industry Revenue (Million), by Country 2024 & 2032
- Figure 68: Middle East and Africa BCI Industry Volume (K Unit), by Country 2024 & 2032
- Figure 69: Middle East and Africa BCI Industry Revenue Share (%), by Country 2024 & 2032
- Figure 70: Middle East and Africa BCI Industry Volume Share (%), by Country 2024 & 2032
- Figure 71: South America BCI Industry Revenue (Million), by Type 2024 & 2032
- Figure 72: South America BCI Industry Volume (K Unit), by Type 2024 & 2032
- Figure 73: South America BCI Industry Revenue Share (%), by Type 2024 & 2032
- Figure 74: South America BCI Industry Volume Share (%), by Type 2024 & 2032
- Figure 75: South America BCI Industry Revenue (Million), by Application 2024 & 2032
- Figure 76: South America BCI Industry Volume (K Unit), by Application 2024 & 2032
- Figure 77: South America BCI Industry Revenue Share (%), by Application 2024 & 2032
- Figure 78: South America BCI Industry Volume Share (%), by Application 2024 & 2032
- Figure 79: South America BCI Industry Revenue (Million), by Country 2024 & 2032
- Figure 80: South America BCI Industry Volume (K Unit), by Country 2024 & 2032
- Figure 81: South America BCI Industry Revenue Share (%), by Country 2024 & 2032
- Figure 82: South America BCI Industry Volume Share (%), by Country 2024 & 2032
List of Tables
- Table 1: Global BCI Industry Revenue Million Forecast, by Region 2019 & 2032
- Table 2: Global BCI Industry Volume K Unit Forecast, by Region 2019 & 2032
- Table 3: Global BCI Industry Revenue Million Forecast, by Type 2019 & 2032
- Table 4: Global BCI Industry Volume K Unit Forecast, by Type 2019 & 2032
- Table 5: Global BCI Industry Revenue Million Forecast, by Application 2019 & 2032
- Table 6: Global BCI Industry Volume K Unit Forecast, by Application 2019 & 2032
- Table 7: Global BCI Industry Revenue Million Forecast, by Region 2019 & 2032
- Table 8: Global BCI Industry Volume K Unit Forecast, by Region 2019 & 2032
- Table 9: Global BCI Industry Revenue Million Forecast, by Country 2019 & 2032
- Table 10: Global BCI Industry Volume K Unit Forecast, by Country 2019 & 2032
- Table 11: United States BCI Industry Revenue (Million) Forecast, by Application 2019 & 2032
- Table 12: United States BCI Industry Volume (K Unit) Forecast, by Application 2019 & 2032
- Table 13: Canada BCI Industry Revenue (Million) Forecast, by Application 2019 & 2032
- Table 14: Canada BCI Industry Volume (K Unit) Forecast, by Application 2019 & 2032
- Table 15: Mexico BCI Industry Revenue (Million) Forecast, by Application 2019 & 2032
- Table 16: Mexico BCI Industry Volume (K Unit) Forecast, by Application 2019 & 2032
- Table 17: Global BCI Industry Revenue Million Forecast, by Country 2019 & 2032
- Table 18: Global BCI Industry Volume K Unit Forecast, by Country 2019 & 2032
- Table 19: Germany BCI Industry Revenue (Million) Forecast, by Application 2019 & 2032
- Table 20: Germany BCI Industry Volume (K Unit) Forecast, by Application 2019 & 2032
- Table 21: United Kingdom BCI Industry Revenue (Million) Forecast, by Application 2019 & 2032
- Table 22: United Kingdom BCI Industry Volume (K Unit) Forecast, by Application 2019 & 2032
- Table 23: France BCI Industry Revenue (Million) Forecast, by Application 2019 & 2032
- Table 24: France BCI Industry Volume (K Unit) Forecast, by Application 2019 & 2032
- Table 25: Italy BCI Industry Revenue (Million) Forecast, by Application 2019 & 2032
- Table 26: Italy BCI Industry Volume (K Unit) Forecast, by Application 2019 & 2032
- Table 27: Spain BCI Industry Revenue (Million) Forecast, by Application 2019 & 2032
- Table 28: Spain BCI Industry Volume (K Unit) Forecast, by Application 2019 & 2032
- Table 29: Rest of Europe BCI Industry Revenue (Million) Forecast, by Application 2019 & 2032
- Table 30: Rest of Europe BCI Industry Volume (K Unit) Forecast, by Application 2019 & 2032
- Table 31: Global BCI Industry Revenue Million Forecast, by Country 2019 & 2032
- Table 32: Global BCI Industry Volume K Unit Forecast, by Country 2019 & 2032
- Table 33: China BCI Industry Revenue (Million) Forecast, by Application 2019 & 2032
- Table 34: China BCI Industry Volume (K Unit) Forecast, by Application 2019 & 2032
- Table 35: Japan BCI Industry Revenue (Million) Forecast, by Application 2019 & 2032
- Table 36: Japan BCI Industry Volume (K Unit) Forecast, by Application 2019 & 2032
- Table 37: India BCI Industry Revenue (Million) Forecast, by Application 2019 & 2032
- Table 38: India BCI Industry Volume (K Unit) Forecast, by Application 2019 & 2032
- Table 39: Australia BCI Industry Revenue (Million) Forecast, by Application 2019 & 2032
- Table 40: Australia BCI Industry Volume (K Unit) Forecast, by Application 2019 & 2032
- Table 41: South Korea BCI Industry Revenue (Million) Forecast, by Application 2019 & 2032
- Table 42: South Korea BCI Industry Volume (K Unit) Forecast, by Application 2019 & 2032
- Table 43: Rest of Asia Pacific BCI Industry Revenue (Million) Forecast, by Application 2019 & 2032
- Table 44: Rest of Asia Pacific BCI Industry Volume (K Unit) Forecast, by Application 2019 & 2032
- Table 45: Global BCI Industry Revenue Million Forecast, by Country 2019 & 2032
- Table 46: Global BCI Industry Volume K Unit Forecast, by Country 2019 & 2032
- Table 47: GCC BCI Industry Revenue (Million) Forecast, by Application 2019 & 2032
- Table 48: GCC BCI Industry Volume (K Unit) Forecast, by Application 2019 & 2032
- Table 49: South Africa BCI Industry Revenue (Million) Forecast, by Application 2019 & 2032
- Table 50: South Africa BCI Industry Volume (K Unit) Forecast, by Application 2019 & 2032
- Table 51: Rest of Middle East and Africa BCI Industry Revenue (Million) Forecast, by Application 2019 & 2032
- Table 52: Rest of Middle East and Africa BCI Industry Volume (K Unit) Forecast, by Application 2019 & 2032
- Table 53: Global BCI Industry Revenue Million Forecast, by Country 2019 & 2032
- Table 54: Global BCI Industry Volume K Unit Forecast, by Country 2019 & 2032
- Table 55: Brazil BCI Industry Revenue (Million) Forecast, by Application 2019 & 2032
- Table 56: Brazil BCI Industry Volume (K Unit) Forecast, by Application 2019 & 2032
- Table 57: Argentina BCI Industry Revenue (Million) Forecast, by Application 2019 & 2032
- Table 58: Argentina BCI Industry Volume (K Unit) Forecast, by Application 2019 & 2032
- Table 59: Rest of South America BCI Industry Revenue (Million) Forecast, by Application 2019 & 2032
- Table 60: Rest of South America BCI Industry Volume (K Unit) Forecast, by Application 2019 & 2032
- Table 61: Global BCI Industry Revenue Million Forecast, by Type 2019 & 2032
- Table 62: Global BCI Industry Volume K Unit Forecast, by Type 2019 & 2032
- Table 63: Global BCI Industry Revenue Million Forecast, by Application 2019 & 2032
- Table 64: Global BCI Industry Volume K Unit Forecast, by Application 2019 & 2032
- Table 65: Global BCI Industry Revenue Million Forecast, by Country 2019 & 2032
- Table 66: Global BCI Industry Volume K Unit Forecast, by Country 2019 & 2032
- Table 67: United States BCI Industry Revenue (Million) Forecast, by Application 2019 & 2032
- Table 68: United States BCI Industry Volume (K Unit) Forecast, by Application 2019 & 2032
- Table 69: Canada BCI Industry Revenue (Million) Forecast, by Application 2019 & 2032
- Table 70: Canada BCI Industry Volume (K Unit) Forecast, by Application 2019 & 2032
- Table 71: Mexico BCI Industry Revenue (Million) Forecast, by Application 2019 & 2032
- Table 72: Mexico BCI Industry Volume (K Unit) Forecast, by Application 2019 & 2032
- Table 73: Global BCI Industry Revenue Million Forecast, by Type 2019 & 2032
- Table 74: Global BCI Industry Volume K Unit Forecast, by Type 2019 & 2032
- Table 75: Global BCI Industry Revenue Million Forecast, by Application 2019 & 2032
- Table 76: Global BCI Industry Volume K Unit Forecast, by Application 2019 & 2032
- Table 77: Global BCI Industry Revenue Million Forecast, by Country 2019 & 2032
- Table 78: Global BCI Industry Volume K Unit Forecast, by Country 2019 & 2032
- Table 79: Germany BCI Industry Revenue (Million) Forecast, by Application 2019 & 2032
- Table 80: Germany BCI Industry Volume (K Unit) Forecast, by Application 2019 & 2032
- Table 81: United Kingdom BCI Industry Revenue (Million) Forecast, by Application 2019 & 2032
- Table 82: United Kingdom BCI Industry Volume (K Unit) Forecast, by Application 2019 & 2032
- Table 83: France BCI Industry Revenue (Million) Forecast, by Application 2019 & 2032
- Table 84: France BCI Industry Volume (K Unit) Forecast, by Application 2019 & 2032
- Table 85: Italy BCI Industry Revenue (Million) Forecast, by Application 2019 & 2032
- Table 86: Italy BCI Industry Volume (K Unit) Forecast, by Application 2019 & 2032
- Table 87: Spain BCI Industry Revenue (Million) Forecast, by Application 2019 & 2032
- Table 88: Spain BCI Industry Volume (K Unit) Forecast, by Application 2019 & 2032
- Table 89: Rest of Europe BCI Industry Revenue (Million) Forecast, by Application 2019 & 2032
- Table 90: Rest of Europe BCI Industry Volume (K Unit) Forecast, by Application 2019 & 2032
- Table 91: Global BCI Industry Revenue Million Forecast, by Type 2019 & 2032
- Table 92: Global BCI Industry Volume K Unit Forecast, by Type 2019 & 2032
- Table 93: Global BCI Industry Revenue Million Forecast, by Application 2019 & 2032
- Table 94: Global BCI Industry Volume K Unit Forecast, by Application 2019 & 2032
- Table 95: Global BCI Industry Revenue Million Forecast, by Country 2019 & 2032
- Table 96: Global BCI Industry Volume K Unit Forecast, by Country 2019 & 2032
- Table 97: China BCI Industry Revenue (Million) Forecast, by Application 2019 & 2032
- Table 98: China BCI Industry Volume (K Unit) Forecast, by Application 2019 & 2032
- Table 99: Japan BCI Industry Revenue (Million) Forecast, by Application 2019 & 2032
- Table 100: Japan BCI Industry Volume (K Unit) Forecast, by Application 2019 & 2032
- Table 101: India BCI Industry Revenue (Million) Forecast, by Application 2019 & 2032
- Table 102: India BCI Industry Volume (K Unit) Forecast, by Application 2019 & 2032
- Table 103: Australia BCI Industry Revenue (Million) Forecast, by Application 2019 & 2032
- Table 104: Australia BCI Industry Volume (K Unit) Forecast, by Application 2019 & 2032
- Table 105: South Korea BCI Industry Revenue (Million) Forecast, by Application 2019 & 2032
- Table 106: South Korea BCI Industry Volume (K Unit) Forecast, by Application 2019 & 2032
- Table 107: Rest of Asia Pacific BCI Industry Revenue (Million) Forecast, by Application 2019 & 2032
- Table 108: Rest of Asia Pacific BCI Industry Volume (K Unit) Forecast, by Application 2019 & 2032
- Table 109: Global BCI Industry Revenue Million Forecast, by Type 2019 & 2032
- Table 110: Global BCI Industry Volume K Unit Forecast, by Type 2019 & 2032
- Table 111: Global BCI Industry Revenue Million Forecast, by Application 2019 & 2032
- Table 112: Global BCI Industry Volume K Unit Forecast, by Application 2019 & 2032
- Table 113: Global BCI Industry Revenue Million Forecast, by Country 2019 & 2032
- Table 114: Global BCI Industry Volume K Unit Forecast, by Country 2019 & 2032
- Table 115: GCC BCI Industry Revenue (Million) Forecast, by Application 2019 & 2032
- Table 116: GCC BCI Industry Volume (K Unit) Forecast, by Application 2019 & 2032
- Table 117: South Africa BCI Industry Revenue (Million) Forecast, by Application 2019 & 2032
- Table 118: South Africa BCI Industry Volume (K Unit) Forecast, by Application 2019 & 2032
- Table 119: Rest of Middle East and Africa BCI Industry Revenue (Million) Forecast, by Application 2019 & 2032
- Table 120: Rest of Middle East and Africa BCI Industry Volume (K Unit) Forecast, by Application 2019 & 2032
- Table 121: Global BCI Industry Revenue Million Forecast, by Type 2019 & 2032
- Table 122: Global BCI Industry Volume K Unit Forecast, by Type 2019 & 2032
- Table 123: Global BCI Industry Revenue Million Forecast, by Application 2019 & 2032
- Table 124: Global BCI Industry Volume K Unit Forecast, by Application 2019 & 2032
- Table 125: Global BCI Industry Revenue Million Forecast, by Country 2019 & 2032
- Table 126: Global BCI Industry Volume K Unit Forecast, by Country 2019 & 2032
- Table 127: Brazil BCI Industry Revenue (Million) Forecast, by Application 2019 & 2032
- Table 128: Brazil BCI Industry Volume (K Unit) Forecast, by Application 2019 & 2032
- Table 129: Argentina BCI Industry Revenue (Million) Forecast, by Application 2019 & 2032
- Table 130: Argentina BCI Industry Volume (K Unit) Forecast, by Application 2019 & 2032
- Table 131: Rest of South America BCI Industry Revenue (Million) Forecast, by Application 2019 & 2032
- Table 132: Rest of South America BCI Industry Volume (K Unit) Forecast, by Application 2019 & 2032
Frequently Asked Questions
1. What is the projected Compound Annual Growth Rate (CAGR) of the BCI Industry?
The projected CAGR is approximately 10.29%.
2. Which companies are prominent players in the BCI Industry?
Key companies in the market include Emotive Incorporation, ANT Neuro, Integra LifeSciences Corporation, NextMind, MindMaze, NIRx Medical Technologies, Natus Medical Inc, Compumedics Ltd, Medtronic PLC, Advanced Brain Monitoring Inc, NeuroSky, Brain Products GmbH, Cadwell Industries Inc, g tec medical engineering GmbH, Nihon Kohden Corporation.
3. What are the main segments of the BCI Industry?
The market segments include Type, Application.
4. Can you provide details about the market size?
The market size is estimated to be USD 2.00 Million as of 2022.
5. What are some drivers contributing to market growth?
Increasing Prevalence of Neurodegenerative Disorders; Rising R&D Activities by Government to Improve the Brain-computer Interface Technology; Various Technological Advancements such as Miniaturization of Devices.
6. What are the notable trends driving market growth?
The Non-invasive Brain-computer Interface Segment is Expected to Dominate the Market During the Forecast Period.
7. Are there any restraints impacting market growth?
High Cost of Brain-computer Interface Devices; Lack of Expertise in Implementing the Systems.
8. Can you provide examples of recent developments in the market?
N/A
9. What pricing options are available for accessing the report?
Pricing options include single-user, multi-user, and enterprise licenses priced at USD 4750, USD 5250, and USD 8750 respectively.
10. Is the market size provided in terms of value or volume?
The market size is provided in terms of value, measured in Million and volume, measured in K Unit.
11. Are there any specific market keywords associated with the report?
Yes, the market keyword associated with the report is "BCI Industry," which aids in identifying and referencing the specific market segment covered.
12. How do I determine which pricing option suits my needs best?
The pricing options vary based on user requirements and access needs. Individual users may opt for single-user licenses, while businesses requiring broader access may choose multi-user or enterprise licenses for cost-effective access to the report.
13. Are there any additional resources or data provided in the BCI Industry report?
While the report offers comprehensive insights, it's advisable to review the specific contents or supplementary materials provided to ascertain if additional resources or data are available.
14. How can I stay updated on further developments or reports in the BCI Industry?
To stay informed about further developments, trends, and reports in the BCI Industry, consider subscribing to industry newsletters, following relevant companies and organizations, or regularly checking reputable industry news sources and publications.
Methodology
Step 1 - Identification of Relevant Samples Size from Population Database


Step 2 - Approaches for Defining Global Market Size (Value, Volume* & Price*)

Note*: In applicable scenarios
Step 3 - Data Sources
Primary Research
- Web Analytics
- Survey Reports
- Research Institute
- Latest Research Reports
- Opinion Leaders
Secondary Research
- Annual Reports
- White Paper
- Latest Press Release
- Industry Association
- Paid Database
- Investor Presentations

Step 4 - Data Triangulation
Involves using different sources of information in order to increase the validity of a study
These sources are likely to be stakeholders in a program - participants, other researchers, program staff, other community members, and so on.
Then we put all data in single framework & apply various statistical tools to find out the dynamic on the market.
During the analysis stage, feedback from the stakeholder groups would be compared to determine areas of agreement as well as areas of divergence


