
Key Insights
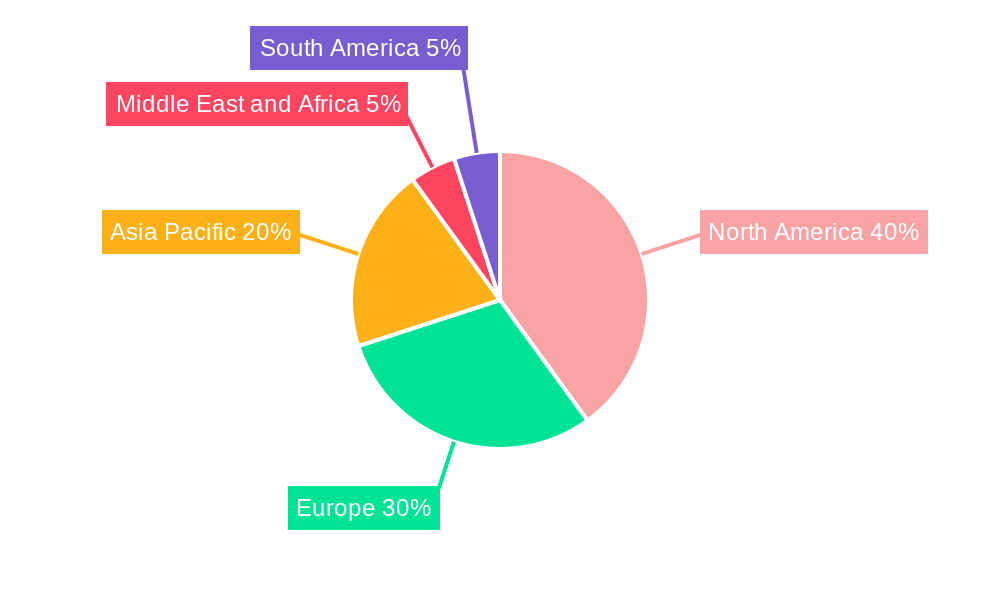
The global bionic eye market is experiencing robust growth, driven by a rising prevalence of age-related vision impairment, technological advancements in retinal implants and visual prosthetics, and increasing investments in research and development. The market's Compound Annual Growth Rate (CAGR) of 12.97% from 2019 to 2024 suggests a significant expansion, projected to continue through 2033. This growth is fueled by the increasing success of clinical trials demonstrating improved visual acuity and quality of life for patients with various forms of vision loss, including age-related macular degeneration (AMD) and retinitis pigmentosa. Segmentation analysis reveals a strong emphasis on implanted eye technologies, driven by their potential for more effective and long-lasting vision restoration compared to external devices. The electronic segment within bionic eye technologies is expected to dominate due to its sophisticated capabilities and ongoing development. Geographically, North America currently holds a significant market share due to the presence of advanced medical infrastructure and high adoption rates of novel medical technologies. However, the Asia-Pacific region is anticipated to show substantial growth in the coming years, driven by increasing healthcare expenditure and a burgeoning elderly population. The market is characterized by a competitive landscape with both established players and emerging innovative companies involved in developing and commercializing various bionic eye solutions.
The market faces challenges such as high costs associated with bionic eye surgeries and devices, limited insurance coverage, and the need for continuous technological improvements to enhance the functionality and longevity of the implants. Regulatory hurdles and ethical considerations surrounding the use of such advanced technologies also play a role in shaping market dynamics. Despite these challenges, the increasing demand for effective vision restoration solutions, coupled with ongoing research and development efforts to address existing limitations, suggests a promising future for the bionic eye market. Ongoing innovations in areas such as image processing, biocompatibility of implant materials, and minimally invasive surgical techniques are expected to propel the market toward greater accessibility and improved patient outcomes, ultimately expanding market size and accessibility in the coming years.
Bionic Eyes Market: A Comprehensive Report (2019-2033)
This comprehensive report provides an in-depth analysis of the Bionic Eyes Market, offering valuable insights into market dynamics, growth drivers, challenges, and opportunities from 2019 to 2033. The study period covers the historical period (2019-2024), the base year (2025), and the forecast period (2025-2033), with a focus on the estimated year 2025. The report segments the market by type, technology, indication, and end-user, offering a granular view of the competitive landscape and future prospects. With a projected market value reaching xx Million by 2033, this report is an essential resource for industry stakeholders, investors, and researchers.
Bionic Eyes Market Market Concentration & Innovation
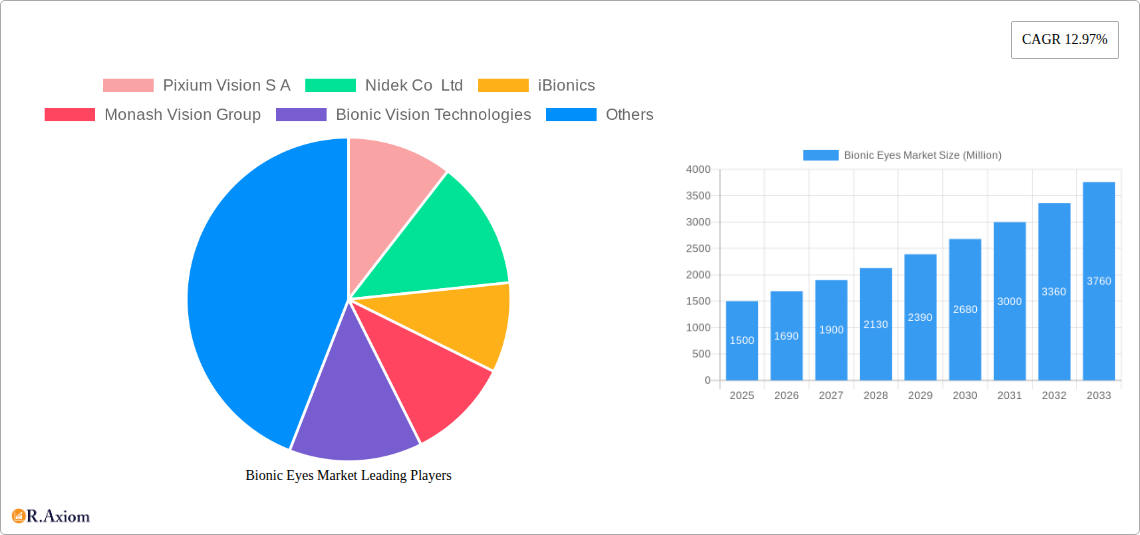
The Bionic Eyes market is currently characterized by moderate concentration, with a few key players dominating the landscape. Market share data for 2024 suggests Pixium Vision S A holds approximately xx% market share, followed by Nidek Co Ltd at xx%, and other players accounting for the remaining xx%. Innovation is driven by advancements in microelectronics, biocompatible materials, and image processing algorithms. Regulatory frameworks, such as those set by the FDA and EMA, significantly influence product development and market entry. Product substitutes include traditional vision correction methods like glasses and contact lenses, along with emerging technologies like gene therapy. End-user trends indicate a growing preference for minimally invasive procedures and improved visual outcomes.
M&A Activities:
- Limited significant M&A activity observed in recent years, with deal values totaling approximately xx Million in the past five years. This relatively low level of activity may indicate a cautious approach driven by the high regulatory hurdles and long development timelines in this sector.
- Further consolidation is anticipated as the technology matures and larger players seek to expand their market presence.
Bionic Eyes Market Industry Trends & Insights
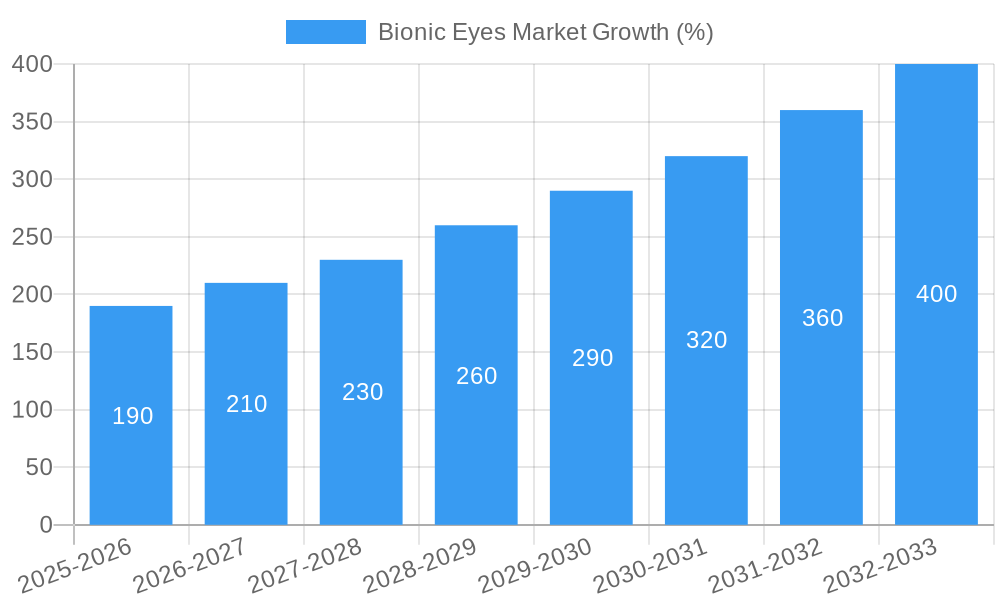
The Bionic Eyes market is experiencing significant growth, fueled by a rising prevalence of vision loss and impairment globally, coupled with technological advancements that promise improved visual outcomes. The market is expected to witness a Compound Annual Growth Rate (CAGR) of xx% during the forecast period (2025-2033). Technological disruptions, particularly in areas such as AI-powered image processing and bio-integrated sensors, are reshaping the competitive landscape and enhancing product efficacy. Consumer preferences increasingly favor less invasive procedures, improved cosmetic outcomes, and higher levels of functional vision restoration. Competitive dynamics are characterized by ongoing R&D efforts, patent filings, and strategic partnerships to secure market share and enhance technological capabilities. The market penetration of bionic eyes is currently low, but it is projected to increase significantly as the technology matures and becomes more accessible.
Dominant Markets & Segments in Bionic Eyes Market
Leading Region: North America currently holds the largest market share due to high adoption rates, advanced healthcare infrastructure, and a large patient population. Key drivers include robust economic conditions, supportive regulatory environments, and substantial investments in medical research and development.
Dominant Segment (By Type): Implanted eyes are currently the dominant segment, owing to their potential for providing more substantial and long-lasting vision restoration. However, External Eye technologies are gaining traction, driven by reduced invasiveness.
Dominant Segment (By Technology): Electronic bionic eyes are the leading segment, due to their superior capabilities in image processing and visual acuity compared to mechanical counterparts.
Dominant Segment (By Indication): Dry Age-related Macular Degeneration (dry AMD) represents the largest indication, given the substantial number of patients affected by this condition.
Dominant Segment (By End User): Hospitals and ophthalmic clinics dominate the market due to specialized infrastructure and experienced medical professionals.
Bionic Eyes Market Product Developments
Recent product innovations have focused on enhancing image resolution, improving biocompatibility, and reducing the invasiveness of implantation procedures. These advancements are enabling more effective vision restoration and improved patient outcomes, thus expanding the market's reach. The competitive advantages lie in superior image processing algorithms, smaller and more efficient device designs, and longer battery life. Technological trends point towards the integration of AI and machine learning for further enhancement of visual acuity and image processing capabilities, leading to improved market fit.
Report Scope & Segmentation Analysis
This report provides a comprehensive segmentation of the bionic eyes market:
By Type: External Eye and Implanted Eye segments show significant growth projections, with Implanted Eye expected to hold a larger market share due to superior visual restoration capabilities.
By Technology: Electronic bionic eyes dominate the market, showing rapid growth; however, advancements in mechanical technologies may drive an increase in market share for this segment in the future.
By Indication: Dry Age-related Macular Degeneration (dry AMD) is a major growth driver, and this report provides detailed insights into this segment. Other vision loss indications also represent significant opportunities for growth.
By End User: Hospitals and ophthalmic clinics remain the dominant end users, though the market is expected to see expansion into other settings as technology progresses.
Key Drivers of Bionic Eyes Market Growth
Technological Advancements: Continuous improvements in sensor technology, image processing algorithms, and biocompatible materials are significantly enhancing the performance and safety of bionic eye implants, thereby fueling market growth.
Rising Prevalence of Vision Impairment: The growing global incidence of age-related macular degeneration (AMD) and other vision impairments is creating a larger pool of potential patients, driving market expansion.
Favorable Regulatory Environment: Regulatory approvals and supportive policies from health authorities are facilitating market entry for new products and fostering innovation.
Challenges in the Bionic Eyes Market Sector
The Bionic Eyes market faces several challenges, including high costs associated with research, development, and manufacturing, which limit accessibility. Strict regulatory approvals and lengthy clinical trials further impede market expansion. Supply chain complexities, especially sourcing specialized components, pose additional challenges. Lastly, the current competitive landscape features limited players and high barriers to entry.
Emerging Opportunities in Bionic Eyes Market
Emerging opportunities include advancements in wireless technology, improving device miniaturization and biointegration, leading to enhanced comfort and functionality. Expanding into new indications beyond AMD, such as retinitis pigmentosa, will also unlock significant growth potential. Finally, developments in personalized medicine and tailored treatment approaches offer new avenues for market expansion.
Leading Players in the Bionic Eyes Market Market
- Pixium Vision S A
- Nidek Co Ltd
- iBionics
- Monash Vision Group
- Bionic Vision Technologies
- Vivani Medical Inc
- Nano Retina Ltd
- Optobionics Corporation
Key Developments in Bionic Eyes Market Industry
- July 2022: Pixium Vision SA successfully implanted its Prima System device in a patient in the Netherlands as part of the PRIMAvera trial for dry AMD, marking a significant milestone for the company.
- January 2022: Pixium Vision's Prima System was implanted in the first patient in France, offering hope for partial vision restoration in dry AMD patients.
Strategic Outlook for Bionic Eyes Market Market
The future of the Bionic Eyes market is promising, driven by continued technological innovation, a growing patient population, and supportive regulatory environments. Further advancements in miniaturization, biointegration, and wireless technology will expand market access and affordability. Strategic partnerships, collaborations, and investments in research and development will play a crucial role in driving future growth and ensuring the long-term success of the sector.
Bionic Eyes Market Segmentation
-
1. Type
- 1.1. External Eye
- 1.2. Implanted Eye
-
2. Technology
- 2.1. Mechanical
- 2.2. Electronic
-
3. Indication
- 3.1. Vision Loss and Impairment
- 3.2. Dry Age-related Macular Degeneration (dry AMD)
- 3.3. Others
-
4. End User
- 4.1. Hospitals
- 4.2. Ophthalmic Clinics
- 4.3. Others
Bionic Eyes Market Segmentation By Geography
-
1. North America
- 1.1. United States
- 1.2. Canada
- 1.3. Mexico
-
2. Europe
- 2.1. United Kingdom
- 2.2. France
- 2.3. Germany
- 2.4. Italy
- 2.5. Spain
- 2.6. Rest of Europe
-
3. Asia Pacific
- 3.1. India
- 3.2. China
- 3.3. Japan
- 3.4. Australia
- 3.5. South Korea
- 3.6. Rest of Asia Pacific
-
4. Middle East and Africa
- 4.1. GCC
- 4.2. South Africa
- 4.3. Rest of Middle East and Africa
-
5. South America
- 5.1. Brazil
- 5.2. Argentina
- 5.3. Rest of South America
Bionic Eyes Market REPORT HIGHLIGHTS
| Aspects | Details |
|---|---|
| Study Period | 2019-2033 |
| Base Year | 2024 |
| Estimated Year | 2025 |
| Forecast Period | 2025-2033 |
| Historical Period | 2019-2024 |
| Growth Rate | CAGR of 12.97% from 2019-2033 |
| Segmentation |
|
Table of Contents
- 1. Introduction
- 1.1. Research Scope
- 1.2. Market Segmentation
- 1.3. Research Methodology
- 1.4. Definitions and Assumptions
- 2. Executive Summary
- 2.1. Introduction
- 3. Market Dynamics
- 3.1. Introduction
- 3.2. Market Drivers
- 3.2.1. Growing Prevalence of Vision Loss and Other Chronic Eye Diseases; Increasing Funding by Private and Public Organizations; Rapid Advancements in Technological Developments
- 3.3. Market Restrains
- 3.3.1. High Research and Development Costs; Low Awareness Among Target Population Regarding Available Products
- 3.4. Market Trends
- 3.4.1. Implanted Eye Segment is Predicted to Grow Significantly Over the Forecast Period
- 4. Market Factor Analysis
- 4.1. Porters Five Forces
- 4.2. Supply/Value Chain
- 4.3. PESTEL analysis
- 4.4. Market Entropy
- 4.5. Patent/Trademark Analysis
- 5. Global Bionic Eyes Market Analysis, Insights and Forecast, 2019-2031
- 5.1. Market Analysis, Insights and Forecast - by Type
- 5.1.1. External Eye
- 5.1.2. Implanted Eye
- 5.2. Market Analysis, Insights and Forecast - by Technology
- 5.2.1. Mechanical
- 5.2.2. Electronic
- 5.3. Market Analysis, Insights and Forecast - by Indication
- 5.3.1. Vision Loss and Impairment
- 5.3.2. Dry Age-related Macular Degeneration (dry AMD)
- 5.3.3. Others
- 5.4. Market Analysis, Insights and Forecast - by End User
- 5.4.1. Hospitals
- 5.4.2. Ophthalmic Clinics
- 5.4.3. Others
- 5.5. Market Analysis, Insights and Forecast - by Region
- 5.5.1. North America
- 5.5.2. Europe
- 5.5.3. Asia Pacific
- 5.5.4. Middle East and Africa
- 5.5.5. South America
- 5.1. Market Analysis, Insights and Forecast - by Type
- 6. North America Bionic Eyes Market Analysis, Insights and Forecast, 2019-2031
- 6.1. Market Analysis, Insights and Forecast - by Type
- 6.1.1. External Eye
- 6.1.2. Implanted Eye
- 6.2. Market Analysis, Insights and Forecast - by Technology
- 6.2.1. Mechanical
- 6.2.2. Electronic
- 6.3. Market Analysis, Insights and Forecast - by Indication
- 6.3.1. Vision Loss and Impairment
- 6.3.2. Dry Age-related Macular Degeneration (dry AMD)
- 6.3.3. Others
- 6.4. Market Analysis, Insights and Forecast - by End User
- 6.4.1. Hospitals
- 6.4.2. Ophthalmic Clinics
- 6.4.3. Others
- 6.1. Market Analysis, Insights and Forecast - by Type
- 7. Europe Bionic Eyes Market Analysis, Insights and Forecast, 2019-2031
- 7.1. Market Analysis, Insights and Forecast - by Type
- 7.1.1. External Eye
- 7.1.2. Implanted Eye
- 7.2. Market Analysis, Insights and Forecast - by Technology
- 7.2.1. Mechanical
- 7.2.2. Electronic
- 7.3. Market Analysis, Insights and Forecast - by Indication
- 7.3.1. Vision Loss and Impairment
- 7.3.2. Dry Age-related Macular Degeneration (dry AMD)
- 7.3.3. Others
- 7.4. Market Analysis, Insights and Forecast - by End User
- 7.4.1. Hospitals
- 7.4.2. Ophthalmic Clinics
- 7.4.3. Others
- 7.1. Market Analysis, Insights and Forecast - by Type
- 8. Asia Pacific Bionic Eyes Market Analysis, Insights and Forecast, 2019-2031
- 8.1. Market Analysis, Insights and Forecast - by Type
- 8.1.1. External Eye
- 8.1.2. Implanted Eye
- 8.2. Market Analysis, Insights and Forecast - by Technology
- 8.2.1. Mechanical
- 8.2.2. Electronic
- 8.3. Market Analysis, Insights and Forecast - by Indication
- 8.3.1. Vision Loss and Impairment
- 8.3.2. Dry Age-related Macular Degeneration (dry AMD)
- 8.3.3. Others
- 8.4. Market Analysis, Insights and Forecast - by End User
- 8.4.1. Hospitals
- 8.4.2. Ophthalmic Clinics
- 8.4.3. Others
- 8.1. Market Analysis, Insights and Forecast - by Type
- 9. Middle East and Africa Bionic Eyes Market Analysis, Insights and Forecast, 2019-2031
- 9.1. Market Analysis, Insights and Forecast - by Type
- 9.1.1. External Eye
- 9.1.2. Implanted Eye
- 9.2. Market Analysis, Insights and Forecast - by Technology
- 9.2.1. Mechanical
- 9.2.2. Electronic
- 9.3. Market Analysis, Insights and Forecast - by Indication
- 9.3.1. Vision Loss and Impairment
- 9.3.2. Dry Age-related Macular Degeneration (dry AMD)
- 9.3.3. Others
- 9.4. Market Analysis, Insights and Forecast - by End User
- 9.4.1. Hospitals
- 9.4.2. Ophthalmic Clinics
- 9.4.3. Others
- 9.1. Market Analysis, Insights and Forecast - by Type
- 10. South America Bionic Eyes Market Analysis, Insights and Forecast, 2019-2031
- 10.1. Market Analysis, Insights and Forecast - by Type
- 10.1.1. External Eye
- 10.1.2. Implanted Eye
- 10.2. Market Analysis, Insights and Forecast - by Technology
- 10.2.1. Mechanical
- 10.2.2. Electronic
- 10.3. Market Analysis, Insights and Forecast - by Indication
- 10.3.1. Vision Loss and Impairment
- 10.3.2. Dry Age-related Macular Degeneration (dry AMD)
- 10.3.3. Others
- 10.4. Market Analysis, Insights and Forecast - by End User
- 10.4.1. Hospitals
- 10.4.2. Ophthalmic Clinics
- 10.4.3. Others
- 10.1. Market Analysis, Insights and Forecast - by Type
- 11. North America Bionic Eyes Market Analysis, Insights and Forecast, 2019-2031
- 11.1. Market Analysis, Insights and Forecast - By Country/Sub-region
- 11.1.1 United States
- 11.1.2 Canada
- 11.1.3 Mexico
- 12. Europe Bionic Eyes Market Analysis, Insights and Forecast, 2019-2031
- 12.1. Market Analysis, Insights and Forecast - By Country/Sub-region
- 12.1.1 United Kingdom
- 12.1.2 France
- 12.1.3 Germany
- 12.1.4 Italy
- 12.1.5 Spain
- 12.1.6 Rest of Europe
- 13. Asia Pacific Bionic Eyes Market Analysis, Insights and Forecast, 2019-2031
- 13.1. Market Analysis, Insights and Forecast - By Country/Sub-region
- 13.1.1 India
- 13.1.2 China
- 13.1.3 Japan
- 13.1.4 Australia
- 13.1.5 South Korea
- 13.1.6 Rest of Asia Pacific
- 14. Middle East and Africa Bionic Eyes Market Analysis, Insights and Forecast, 2019-2031
- 14.1. Market Analysis, Insights and Forecast - By Country/Sub-region
- 14.1.1 GCC
- 14.1.2 South Africa
- 14.1.3 Rest of Middle East and Africa
- 15. South America Bionic Eyes Market Analysis, Insights and Forecast, 2019-2031
- 15.1. Market Analysis, Insights and Forecast - By Country/Sub-region
- 15.1.1 Brazil
- 15.1.2 Argentina
- 15.1.3 Rest of South America
- 16. Competitive Analysis
- 16.1. Global Market Share Analysis 2024
- 16.2. Company Profiles
- 16.2.1 Pixium Vision S A
- 16.2.1.1. Overview
- 16.2.1.2. Products
- 16.2.1.3. SWOT Analysis
- 16.2.1.4. Recent Developments
- 16.2.1.5. Financials (Based on Availability)
- 16.2.2 Nidek Co Ltd
- 16.2.2.1. Overview
- 16.2.2.2. Products
- 16.2.2.3. SWOT Analysis
- 16.2.2.4. Recent Developments
- 16.2.2.5. Financials (Based on Availability)
- 16.2.3 iBionics
- 16.2.3.1. Overview
- 16.2.3.2. Products
- 16.2.3.3. SWOT Analysis
- 16.2.3.4. Recent Developments
- 16.2.3.5. Financials (Based on Availability)
- 16.2.4 Monash Vision Group
- 16.2.4.1. Overview
- 16.2.4.2. Products
- 16.2.4.3. SWOT Analysis
- 16.2.4.4. Recent Developments
- 16.2.4.5. Financials (Based on Availability)
- 16.2.5 Bionic Vision Technologies
- 16.2.5.1. Overview
- 16.2.5.2. Products
- 16.2.5.3. SWOT Analysis
- 16.2.5.4. Recent Developments
- 16.2.5.5. Financials (Based on Availability)
- 16.2.6 Vivani Medical Inc
- 16.2.6.1. Overview
- 16.2.6.2. Products
- 16.2.6.3. SWOT Analysis
- 16.2.6.4. Recent Developments
- 16.2.6.5. Financials (Based on Availability)
- 16.2.7 Nano Retina Ltd
- 16.2.7.1. Overview
- 16.2.7.2. Products
- 16.2.7.3. SWOT Analysis
- 16.2.7.4. Recent Developments
- 16.2.7.5. Financials (Based on Availability)
- 16.2.8 Optobionics Corporation
- 16.2.8.1. Overview
- 16.2.8.2. Products
- 16.2.8.3. SWOT Analysis
- 16.2.8.4. Recent Developments
- 16.2.8.5. Financials (Based on Availability)
- 16.2.1 Pixium Vision S A
List of Figures
- Figure 1: Global Bionic Eyes Market Revenue Breakdown (Million, %) by Region 2024 & 2032
- Figure 2: Global Bionic Eyes Market Volume Breakdown (K Unit, %) by Region 2024 & 2032
- Figure 3: North America Bionic Eyes Market Revenue (Million), by Country 2024 & 2032
- Figure 4: North America Bionic Eyes Market Volume (K Unit), by Country 2024 & 2032
- Figure 5: North America Bionic Eyes Market Revenue Share (%), by Country 2024 & 2032
- Figure 6: North America Bionic Eyes Market Volume Share (%), by Country 2024 & 2032
- Figure 7: Europe Bionic Eyes Market Revenue (Million), by Country 2024 & 2032
- Figure 8: Europe Bionic Eyes Market Volume (K Unit), by Country 2024 & 2032
- Figure 9: Europe Bionic Eyes Market Revenue Share (%), by Country 2024 & 2032
- Figure 10: Europe Bionic Eyes Market Volume Share (%), by Country 2024 & 2032
- Figure 11: Asia Pacific Bionic Eyes Market Revenue (Million), by Country 2024 & 2032
- Figure 12: Asia Pacific Bionic Eyes Market Volume (K Unit), by Country 2024 & 2032
- Figure 13: Asia Pacific Bionic Eyes Market Revenue Share (%), by Country 2024 & 2032
- Figure 14: Asia Pacific Bionic Eyes Market Volume Share (%), by Country 2024 & 2032
- Figure 15: Middle East and Africa Bionic Eyes Market Revenue (Million), by Country 2024 & 2032
- Figure 16: Middle East and Africa Bionic Eyes Market Volume (K Unit), by Country 2024 & 2032
- Figure 17: Middle East and Africa Bionic Eyes Market Revenue Share (%), by Country 2024 & 2032
- Figure 18: Middle East and Africa Bionic Eyes Market Volume Share (%), by Country 2024 & 2032
- Figure 19: South America Bionic Eyes Market Revenue (Million), by Country 2024 & 2032
- Figure 20: South America Bionic Eyes Market Volume (K Unit), by Country 2024 & 2032
- Figure 21: South America Bionic Eyes Market Revenue Share (%), by Country 2024 & 2032
- Figure 22: South America Bionic Eyes Market Volume Share (%), by Country 2024 & 2032
- Figure 23: North America Bionic Eyes Market Revenue (Million), by Type 2024 & 2032
- Figure 24: North America Bionic Eyes Market Volume (K Unit), by Type 2024 & 2032
- Figure 25: North America Bionic Eyes Market Revenue Share (%), by Type 2024 & 2032
- Figure 26: North America Bionic Eyes Market Volume Share (%), by Type 2024 & 2032
- Figure 27: North America Bionic Eyes Market Revenue (Million), by Technology 2024 & 2032
- Figure 28: North America Bionic Eyes Market Volume (K Unit), by Technology 2024 & 2032
- Figure 29: North America Bionic Eyes Market Revenue Share (%), by Technology 2024 & 2032
- Figure 30: North America Bionic Eyes Market Volume Share (%), by Technology 2024 & 2032
- Figure 31: North America Bionic Eyes Market Revenue (Million), by Indication 2024 & 2032
- Figure 32: North America Bionic Eyes Market Volume (K Unit), by Indication 2024 & 2032
- Figure 33: North America Bionic Eyes Market Revenue Share (%), by Indication 2024 & 2032
- Figure 34: North America Bionic Eyes Market Volume Share (%), by Indication 2024 & 2032
- Figure 35: North America Bionic Eyes Market Revenue (Million), by End User 2024 & 2032
- Figure 36: North America Bionic Eyes Market Volume (K Unit), by End User 2024 & 2032
- Figure 37: North America Bionic Eyes Market Revenue Share (%), by End User 2024 & 2032
- Figure 38: North America Bionic Eyes Market Volume Share (%), by End User 2024 & 2032
- Figure 39: North America Bionic Eyes Market Revenue (Million), by Country 2024 & 2032
- Figure 40: North America Bionic Eyes Market Volume (K Unit), by Country 2024 & 2032
- Figure 41: North America Bionic Eyes Market Revenue Share (%), by Country 2024 & 2032
- Figure 42: North America Bionic Eyes Market Volume Share (%), by Country 2024 & 2032
- Figure 43: Europe Bionic Eyes Market Revenue (Million), by Type 2024 & 2032
- Figure 44: Europe Bionic Eyes Market Volume (K Unit), by Type 2024 & 2032
- Figure 45: Europe Bionic Eyes Market Revenue Share (%), by Type 2024 & 2032
- Figure 46: Europe Bionic Eyes Market Volume Share (%), by Type 2024 & 2032
- Figure 47: Europe Bionic Eyes Market Revenue (Million), by Technology 2024 & 2032
- Figure 48: Europe Bionic Eyes Market Volume (K Unit), by Technology 2024 & 2032
- Figure 49: Europe Bionic Eyes Market Revenue Share (%), by Technology 2024 & 2032
- Figure 50: Europe Bionic Eyes Market Volume Share (%), by Technology 2024 & 2032
- Figure 51: Europe Bionic Eyes Market Revenue (Million), by Indication 2024 & 2032
- Figure 52: Europe Bionic Eyes Market Volume (K Unit), by Indication 2024 & 2032
- Figure 53: Europe Bionic Eyes Market Revenue Share (%), by Indication 2024 & 2032
- Figure 54: Europe Bionic Eyes Market Volume Share (%), by Indication 2024 & 2032
- Figure 55: Europe Bionic Eyes Market Revenue (Million), by End User 2024 & 2032
- Figure 56: Europe Bionic Eyes Market Volume (K Unit), by End User 2024 & 2032
- Figure 57: Europe Bionic Eyes Market Revenue Share (%), by End User 2024 & 2032
- Figure 58: Europe Bionic Eyes Market Volume Share (%), by End User 2024 & 2032
- Figure 59: Europe Bionic Eyes Market Revenue (Million), by Country 2024 & 2032
- Figure 60: Europe Bionic Eyes Market Volume (K Unit), by Country 2024 & 2032
- Figure 61: Europe Bionic Eyes Market Revenue Share (%), by Country 2024 & 2032
- Figure 62: Europe Bionic Eyes Market Volume Share (%), by Country 2024 & 2032
- Figure 63: Asia Pacific Bionic Eyes Market Revenue (Million), by Type 2024 & 2032
- Figure 64: Asia Pacific Bionic Eyes Market Volume (K Unit), by Type 2024 & 2032
- Figure 65: Asia Pacific Bionic Eyes Market Revenue Share (%), by Type 2024 & 2032
- Figure 66: Asia Pacific Bionic Eyes Market Volume Share (%), by Type 2024 & 2032
- Figure 67: Asia Pacific Bionic Eyes Market Revenue (Million), by Technology 2024 & 2032
- Figure 68: Asia Pacific Bionic Eyes Market Volume (K Unit), by Technology 2024 & 2032
- Figure 69: Asia Pacific Bionic Eyes Market Revenue Share (%), by Technology 2024 & 2032
- Figure 70: Asia Pacific Bionic Eyes Market Volume Share (%), by Technology 2024 & 2032
- Figure 71: Asia Pacific Bionic Eyes Market Revenue (Million), by Indication 2024 & 2032
- Figure 72: Asia Pacific Bionic Eyes Market Volume (K Unit), by Indication 2024 & 2032
- Figure 73: Asia Pacific Bionic Eyes Market Revenue Share (%), by Indication 2024 & 2032
- Figure 74: Asia Pacific Bionic Eyes Market Volume Share (%), by Indication 2024 & 2032
- Figure 75: Asia Pacific Bionic Eyes Market Revenue (Million), by End User 2024 & 2032
- Figure 76: Asia Pacific Bionic Eyes Market Volume (K Unit), by End User 2024 & 2032
- Figure 77: Asia Pacific Bionic Eyes Market Revenue Share (%), by End User 2024 & 2032
- Figure 78: Asia Pacific Bionic Eyes Market Volume Share (%), by End User 2024 & 2032
- Figure 79: Asia Pacific Bionic Eyes Market Revenue (Million), by Country 2024 & 2032
- Figure 80: Asia Pacific Bionic Eyes Market Volume (K Unit), by Country 2024 & 2032
- Figure 81: Asia Pacific Bionic Eyes Market Revenue Share (%), by Country 2024 & 2032
- Figure 82: Asia Pacific Bionic Eyes Market Volume Share (%), by Country 2024 & 2032
- Figure 83: Middle East and Africa Bionic Eyes Market Revenue (Million), by Type 2024 & 2032
- Figure 84: Middle East and Africa Bionic Eyes Market Volume (K Unit), by Type 2024 & 2032
- Figure 85: Middle East and Africa Bionic Eyes Market Revenue Share (%), by Type 2024 & 2032
- Figure 86: Middle East and Africa Bionic Eyes Market Volume Share (%), by Type 2024 & 2032
- Figure 87: Middle East and Africa Bionic Eyes Market Revenue (Million), by Technology 2024 & 2032
- Figure 88: Middle East and Africa Bionic Eyes Market Volume (K Unit), by Technology 2024 & 2032
- Figure 89: Middle East and Africa Bionic Eyes Market Revenue Share (%), by Technology 2024 & 2032
- Figure 90: Middle East and Africa Bionic Eyes Market Volume Share (%), by Technology 2024 & 2032
- Figure 91: Middle East and Africa Bionic Eyes Market Revenue (Million), by Indication 2024 & 2032
- Figure 92: Middle East and Africa Bionic Eyes Market Volume (K Unit), by Indication 2024 & 2032
- Figure 93: Middle East and Africa Bionic Eyes Market Revenue Share (%), by Indication 2024 & 2032
- Figure 94: Middle East and Africa Bionic Eyes Market Volume Share (%), by Indication 2024 & 2032
- Figure 95: Middle East and Africa Bionic Eyes Market Revenue (Million), by End User 2024 & 2032
- Figure 96: Middle East and Africa Bionic Eyes Market Volume (K Unit), by End User 2024 & 2032
- Figure 97: Middle East and Africa Bionic Eyes Market Revenue Share (%), by End User 2024 & 2032
- Figure 98: Middle East and Africa Bionic Eyes Market Volume Share (%), by End User 2024 & 2032
- Figure 99: Middle East and Africa Bionic Eyes Market Revenue (Million), by Country 2024 & 2032
- Figure 100: Middle East and Africa Bionic Eyes Market Volume (K Unit), by Country 2024 & 2032
- Figure 101: Middle East and Africa Bionic Eyes Market Revenue Share (%), by Country 2024 & 2032
- Figure 102: Middle East and Africa Bionic Eyes Market Volume Share (%), by Country 2024 & 2032
- Figure 103: South America Bionic Eyes Market Revenue (Million), by Type 2024 & 2032
- Figure 104: South America Bionic Eyes Market Volume (K Unit), by Type 2024 & 2032
- Figure 105: South America Bionic Eyes Market Revenue Share (%), by Type 2024 & 2032
- Figure 106: South America Bionic Eyes Market Volume Share (%), by Type 2024 & 2032
- Figure 107: South America Bionic Eyes Market Revenue (Million), by Technology 2024 & 2032
- Figure 108: South America Bionic Eyes Market Volume (K Unit), by Technology 2024 & 2032
- Figure 109: South America Bionic Eyes Market Revenue Share (%), by Technology 2024 & 2032
- Figure 110: South America Bionic Eyes Market Volume Share (%), by Technology 2024 & 2032
- Figure 111: South America Bionic Eyes Market Revenue (Million), by Indication 2024 & 2032
- Figure 112: South America Bionic Eyes Market Volume (K Unit), by Indication 2024 & 2032
- Figure 113: South America Bionic Eyes Market Revenue Share (%), by Indication 2024 & 2032
- Figure 114: South America Bionic Eyes Market Volume Share (%), by Indication 2024 & 2032
- Figure 115: South America Bionic Eyes Market Revenue (Million), by End User 2024 & 2032
- Figure 116: South America Bionic Eyes Market Volume (K Unit), by End User 2024 & 2032
- Figure 117: South America Bionic Eyes Market Revenue Share (%), by End User 2024 & 2032
- Figure 118: South America Bionic Eyes Market Volume Share (%), by End User 2024 & 2032
- Figure 119: South America Bionic Eyes Market Revenue (Million), by Country 2024 & 2032
- Figure 120: South America Bionic Eyes Market Volume (K Unit), by Country 2024 & 2032
- Figure 121: South America Bionic Eyes Market Revenue Share (%), by Country 2024 & 2032
- Figure 122: South America Bionic Eyes Market Volume Share (%), by Country 2024 & 2032
List of Tables
- Table 1: Global Bionic Eyes Market Revenue Million Forecast, by Region 2019 & 2032
- Table 2: Global Bionic Eyes Market Volume K Unit Forecast, by Region 2019 & 2032
- Table 3: Global Bionic Eyes Market Revenue Million Forecast, by Type 2019 & 2032
- Table 4: Global Bionic Eyes Market Volume K Unit Forecast, by Type 2019 & 2032
- Table 5: Global Bionic Eyes Market Revenue Million Forecast, by Technology 2019 & 2032
- Table 6: Global Bionic Eyes Market Volume K Unit Forecast, by Technology 2019 & 2032
- Table 7: Global Bionic Eyes Market Revenue Million Forecast, by Indication 2019 & 2032
- Table 8: Global Bionic Eyes Market Volume K Unit Forecast, by Indication 2019 & 2032
- Table 9: Global Bionic Eyes Market Revenue Million Forecast, by End User 2019 & 2032
- Table 10: Global Bionic Eyes Market Volume K Unit Forecast, by End User 2019 & 2032
- Table 11: Global Bionic Eyes Market Revenue Million Forecast, by Region 2019 & 2032
- Table 12: Global Bionic Eyes Market Volume K Unit Forecast, by Region 2019 & 2032
- Table 13: Global Bionic Eyes Market Revenue Million Forecast, by Country 2019 & 2032
- Table 14: Global Bionic Eyes Market Volume K Unit Forecast, by Country 2019 & 2032
- Table 15: United States Bionic Eyes Market Revenue (Million) Forecast, by Application 2019 & 2032
- Table 16: United States Bionic Eyes Market Volume (K Unit) Forecast, by Application 2019 & 2032
- Table 17: Canada Bionic Eyes Market Revenue (Million) Forecast, by Application 2019 & 2032
- Table 18: Canada Bionic Eyes Market Volume (K Unit) Forecast, by Application 2019 & 2032
- Table 19: Mexico Bionic Eyes Market Revenue (Million) Forecast, by Application 2019 & 2032
- Table 20: Mexico Bionic Eyes Market Volume (K Unit) Forecast, by Application 2019 & 2032
- Table 21: Global Bionic Eyes Market Revenue Million Forecast, by Country 2019 & 2032
- Table 22: Global Bionic Eyes Market Volume K Unit Forecast, by Country 2019 & 2032
- Table 23: United Kingdom Bionic Eyes Market Revenue (Million) Forecast, by Application 2019 & 2032
- Table 24: United Kingdom Bionic Eyes Market Volume (K Unit) Forecast, by Application 2019 & 2032
- Table 25: France Bionic Eyes Market Revenue (Million) Forecast, by Application 2019 & 2032
- Table 26: France Bionic Eyes Market Volume (K Unit) Forecast, by Application 2019 & 2032
- Table 27: Germany Bionic Eyes Market Revenue (Million) Forecast, by Application 2019 & 2032
- Table 28: Germany Bionic Eyes Market Volume (K Unit) Forecast, by Application 2019 & 2032
- Table 29: Italy Bionic Eyes Market Revenue (Million) Forecast, by Application 2019 & 2032
- Table 30: Italy Bionic Eyes Market Volume (K Unit) Forecast, by Application 2019 & 2032
- Table 31: Spain Bionic Eyes Market Revenue (Million) Forecast, by Application 2019 & 2032
- Table 32: Spain Bionic Eyes Market Volume (K Unit) Forecast, by Application 2019 & 2032
- Table 33: Rest of Europe Bionic Eyes Market Revenue (Million) Forecast, by Application 2019 & 2032
- Table 34: Rest of Europe Bionic Eyes Market Volume (K Unit) Forecast, by Application 2019 & 2032
- Table 35: Global Bionic Eyes Market Revenue Million Forecast, by Country 2019 & 2032
- Table 36: Global Bionic Eyes Market Volume K Unit Forecast, by Country 2019 & 2032
- Table 37: India Bionic Eyes Market Revenue (Million) Forecast, by Application 2019 & 2032
- Table 38: India Bionic Eyes Market Volume (K Unit) Forecast, by Application 2019 & 2032
- Table 39: China Bionic Eyes Market Revenue (Million) Forecast, by Application 2019 & 2032
- Table 40: China Bionic Eyes Market Volume (K Unit) Forecast, by Application 2019 & 2032
- Table 41: Japan Bionic Eyes Market Revenue (Million) Forecast, by Application 2019 & 2032
- Table 42: Japan Bionic Eyes Market Volume (K Unit) Forecast, by Application 2019 & 2032
- Table 43: Australia Bionic Eyes Market Revenue (Million) Forecast, by Application 2019 & 2032
- Table 44: Australia Bionic Eyes Market Volume (K Unit) Forecast, by Application 2019 & 2032
- Table 45: South Korea Bionic Eyes Market Revenue (Million) Forecast, by Application 2019 & 2032
- Table 46: South Korea Bionic Eyes Market Volume (K Unit) Forecast, by Application 2019 & 2032
- Table 47: Rest of Asia Pacific Bionic Eyes Market Revenue (Million) Forecast, by Application 2019 & 2032
- Table 48: Rest of Asia Pacific Bionic Eyes Market Volume (K Unit) Forecast, by Application 2019 & 2032
- Table 49: Global Bionic Eyes Market Revenue Million Forecast, by Country 2019 & 2032
- Table 50: Global Bionic Eyes Market Volume K Unit Forecast, by Country 2019 & 2032
- Table 51: GCC Bionic Eyes Market Revenue (Million) Forecast, by Application 2019 & 2032
- Table 52: GCC Bionic Eyes Market Volume (K Unit) Forecast, by Application 2019 & 2032
- Table 53: South Africa Bionic Eyes Market Revenue (Million) Forecast, by Application 2019 & 2032
- Table 54: South Africa Bionic Eyes Market Volume (K Unit) Forecast, by Application 2019 & 2032
- Table 55: Rest of Middle East and Africa Bionic Eyes Market Revenue (Million) Forecast, by Application 2019 & 2032
- Table 56: Rest of Middle East and Africa Bionic Eyes Market Volume (K Unit) Forecast, by Application 2019 & 2032
- Table 57: Global Bionic Eyes Market Revenue Million Forecast, by Country 2019 & 2032
- Table 58: Global Bionic Eyes Market Volume K Unit Forecast, by Country 2019 & 2032
- Table 59: Brazil Bionic Eyes Market Revenue (Million) Forecast, by Application 2019 & 2032
- Table 60: Brazil Bionic Eyes Market Volume (K Unit) Forecast, by Application 2019 & 2032
- Table 61: Argentina Bionic Eyes Market Revenue (Million) Forecast, by Application 2019 & 2032
- Table 62: Argentina Bionic Eyes Market Volume (K Unit) Forecast, by Application 2019 & 2032
- Table 63: Rest of South America Bionic Eyes Market Revenue (Million) Forecast, by Application 2019 & 2032
- Table 64: Rest of South America Bionic Eyes Market Volume (K Unit) Forecast, by Application 2019 & 2032
- Table 65: Global Bionic Eyes Market Revenue Million Forecast, by Type 2019 & 2032
- Table 66: Global Bionic Eyes Market Volume K Unit Forecast, by Type 2019 & 2032
- Table 67: Global Bionic Eyes Market Revenue Million Forecast, by Technology 2019 & 2032
- Table 68: Global Bionic Eyes Market Volume K Unit Forecast, by Technology 2019 & 2032
- Table 69: Global Bionic Eyes Market Revenue Million Forecast, by Indication 2019 & 2032
- Table 70: Global Bionic Eyes Market Volume K Unit Forecast, by Indication 2019 & 2032
- Table 71: Global Bionic Eyes Market Revenue Million Forecast, by End User 2019 & 2032
- Table 72: Global Bionic Eyes Market Volume K Unit Forecast, by End User 2019 & 2032
- Table 73: Global Bionic Eyes Market Revenue Million Forecast, by Country 2019 & 2032
- Table 74: Global Bionic Eyes Market Volume K Unit Forecast, by Country 2019 & 2032
- Table 75: United States Bionic Eyes Market Revenue (Million) Forecast, by Application 2019 & 2032
- Table 76: United States Bionic Eyes Market Volume (K Unit) Forecast, by Application 2019 & 2032
- Table 77: Canada Bionic Eyes Market Revenue (Million) Forecast, by Application 2019 & 2032
- Table 78: Canada Bionic Eyes Market Volume (K Unit) Forecast, by Application 2019 & 2032
- Table 79: Mexico Bionic Eyes Market Revenue (Million) Forecast, by Application 2019 & 2032
- Table 80: Mexico Bionic Eyes Market Volume (K Unit) Forecast, by Application 2019 & 2032
- Table 81: Global Bionic Eyes Market Revenue Million Forecast, by Type 2019 & 2032
- Table 82: Global Bionic Eyes Market Volume K Unit Forecast, by Type 2019 & 2032
- Table 83: Global Bionic Eyes Market Revenue Million Forecast, by Technology 2019 & 2032
- Table 84: Global Bionic Eyes Market Volume K Unit Forecast, by Technology 2019 & 2032
- Table 85: Global Bionic Eyes Market Revenue Million Forecast, by Indication 2019 & 2032
- Table 86: Global Bionic Eyes Market Volume K Unit Forecast, by Indication 2019 & 2032
- Table 87: Global Bionic Eyes Market Revenue Million Forecast, by End User 2019 & 2032
- Table 88: Global Bionic Eyes Market Volume K Unit Forecast, by End User 2019 & 2032
- Table 89: Global Bionic Eyes Market Revenue Million Forecast, by Country 2019 & 2032
- Table 90: Global Bionic Eyes Market Volume K Unit Forecast, by Country 2019 & 2032
- Table 91: United Kingdom Bionic Eyes Market Revenue (Million) Forecast, by Application 2019 & 2032
- Table 92: United Kingdom Bionic Eyes Market Volume (K Unit) Forecast, by Application 2019 & 2032
- Table 93: France Bionic Eyes Market Revenue (Million) Forecast, by Application 2019 & 2032
- Table 94: France Bionic Eyes Market Volume (K Unit) Forecast, by Application 2019 & 2032
- Table 95: Germany Bionic Eyes Market Revenue (Million) Forecast, by Application 2019 & 2032
- Table 96: Germany Bionic Eyes Market Volume (K Unit) Forecast, by Application 2019 & 2032
- Table 97: Italy Bionic Eyes Market Revenue (Million) Forecast, by Application 2019 & 2032
- Table 98: Italy Bionic Eyes Market Volume (K Unit) Forecast, by Application 2019 & 2032
- Table 99: Spain Bionic Eyes Market Revenue (Million) Forecast, by Application 2019 & 2032
- Table 100: Spain Bionic Eyes Market Volume (K Unit) Forecast, by Application 2019 & 2032
- Table 101: Rest of Europe Bionic Eyes Market Revenue (Million) Forecast, by Application 2019 & 2032
- Table 102: Rest of Europe Bionic Eyes Market Volume (K Unit) Forecast, by Application 2019 & 2032
- Table 103: Global Bionic Eyes Market Revenue Million Forecast, by Type 2019 & 2032
- Table 104: Global Bionic Eyes Market Volume K Unit Forecast, by Type 2019 & 2032
- Table 105: Global Bionic Eyes Market Revenue Million Forecast, by Technology 2019 & 2032
- Table 106: Global Bionic Eyes Market Volume K Unit Forecast, by Technology 2019 & 2032
- Table 107: Global Bionic Eyes Market Revenue Million Forecast, by Indication 2019 & 2032
- Table 108: Global Bionic Eyes Market Volume K Unit Forecast, by Indication 2019 & 2032
- Table 109: Global Bionic Eyes Market Revenue Million Forecast, by End User 2019 & 2032
- Table 110: Global Bionic Eyes Market Volume K Unit Forecast, by End User 2019 & 2032
- Table 111: Global Bionic Eyes Market Revenue Million Forecast, by Country 2019 & 2032
- Table 112: Global Bionic Eyes Market Volume K Unit Forecast, by Country 2019 & 2032
- Table 113: India Bionic Eyes Market Revenue (Million) Forecast, by Application 2019 & 2032
- Table 114: India Bionic Eyes Market Volume (K Unit) Forecast, by Application 2019 & 2032
- Table 115: China Bionic Eyes Market Revenue (Million) Forecast, by Application 2019 & 2032
- Table 116: China Bionic Eyes Market Volume (K Unit) Forecast, by Application 2019 & 2032
- Table 117: Japan Bionic Eyes Market Revenue (Million) Forecast, by Application 2019 & 2032
- Table 118: Japan Bionic Eyes Market Volume (K Unit) Forecast, by Application 2019 & 2032
- Table 119: Australia Bionic Eyes Market Revenue (Million) Forecast, by Application 2019 & 2032
- Table 120: Australia Bionic Eyes Market Volume (K Unit) Forecast, by Application 2019 & 2032
- Table 121: South Korea Bionic Eyes Market Revenue (Million) Forecast, by Application 2019 & 2032
- Table 122: South Korea Bionic Eyes Market Volume (K Unit) Forecast, by Application 2019 & 2032
- Table 123: Rest of Asia Pacific Bionic Eyes Market Revenue (Million) Forecast, by Application 2019 & 2032
- Table 124: Rest of Asia Pacific Bionic Eyes Market Volume (K Unit) Forecast, by Application 2019 & 2032
- Table 125: Global Bionic Eyes Market Revenue Million Forecast, by Type 2019 & 2032
- Table 126: Global Bionic Eyes Market Volume K Unit Forecast, by Type 2019 & 2032
- Table 127: Global Bionic Eyes Market Revenue Million Forecast, by Technology 2019 & 2032
- Table 128: Global Bionic Eyes Market Volume K Unit Forecast, by Technology 2019 & 2032
- Table 129: Global Bionic Eyes Market Revenue Million Forecast, by Indication 2019 & 2032
- Table 130: Global Bionic Eyes Market Volume K Unit Forecast, by Indication 2019 & 2032
- Table 131: Global Bionic Eyes Market Revenue Million Forecast, by End User 2019 & 2032
- Table 132: Global Bionic Eyes Market Volume K Unit Forecast, by End User 2019 & 2032
- Table 133: Global Bionic Eyes Market Revenue Million Forecast, by Country 2019 & 2032
- Table 134: Global Bionic Eyes Market Volume K Unit Forecast, by Country 2019 & 2032
- Table 135: GCC Bionic Eyes Market Revenue (Million) Forecast, by Application 2019 & 2032
- Table 136: GCC Bionic Eyes Market Volume (K Unit) Forecast, by Application 2019 & 2032
- Table 137: South Africa Bionic Eyes Market Revenue (Million) Forecast, by Application 2019 & 2032
- Table 138: South Africa Bionic Eyes Market Volume (K Unit) Forecast, by Application 2019 & 2032
- Table 139: Rest of Middle East and Africa Bionic Eyes Market Revenue (Million) Forecast, by Application 2019 & 2032
- Table 140: Rest of Middle East and Africa Bionic Eyes Market Volume (K Unit) Forecast, by Application 2019 & 2032
- Table 141: Global Bionic Eyes Market Revenue Million Forecast, by Type 2019 & 2032
- Table 142: Global Bionic Eyes Market Volume K Unit Forecast, by Type 2019 & 2032
- Table 143: Global Bionic Eyes Market Revenue Million Forecast, by Technology 2019 & 2032
- Table 144: Global Bionic Eyes Market Volume K Unit Forecast, by Technology 2019 & 2032
- Table 145: Global Bionic Eyes Market Revenue Million Forecast, by Indication 2019 & 2032
- Table 146: Global Bionic Eyes Market Volume K Unit Forecast, by Indication 2019 & 2032
- Table 147: Global Bionic Eyes Market Revenue Million Forecast, by End User 2019 & 2032
- Table 148: Global Bionic Eyes Market Volume K Unit Forecast, by End User 2019 & 2032
- Table 149: Global Bionic Eyes Market Revenue Million Forecast, by Country 2019 & 2032
- Table 150: Global Bionic Eyes Market Volume K Unit Forecast, by Country 2019 & 2032
- Table 151: Brazil Bionic Eyes Market Revenue (Million) Forecast, by Application 2019 & 2032
- Table 152: Brazil Bionic Eyes Market Volume (K Unit) Forecast, by Application 2019 & 2032
- Table 153: Argentina Bionic Eyes Market Revenue (Million) Forecast, by Application 2019 & 2032
- Table 154: Argentina Bionic Eyes Market Volume (K Unit) Forecast, by Application 2019 & 2032
- Table 155: Rest of South America Bionic Eyes Market Revenue (Million) Forecast, by Application 2019 & 2032
- Table 156: Rest of South America Bionic Eyes Market Volume (K Unit) Forecast, by Application 2019 & 2032
Frequently Asked Questions
1. What is the projected Compound Annual Growth Rate (CAGR) of the Bionic Eyes Market?
The projected CAGR is approximately 12.97%.
2. Which companies are prominent players in the Bionic Eyes Market?
Key companies in the market include Pixium Vision S A, Nidek Co Ltd, iBionics, Monash Vision Group, Bionic Vision Technologies, Vivani Medical Inc, Nano Retina Ltd, Optobionics Corporation.
3. What are the main segments of the Bionic Eyes Market?
The market segments include Type, Technology, Indication, End User.
4. Can you provide details about the market size?
The market size is estimated to be USD XX Million as of 2022.
5. What are some drivers contributing to market growth?
Growing Prevalence of Vision Loss and Other Chronic Eye Diseases; Increasing Funding by Private and Public Organizations; Rapid Advancements in Technological Developments.
6. What are the notable trends driving market growth?
Implanted Eye Segment is Predicted to Grow Significantly Over the Forecast Period.
7. Are there any restraints impacting market growth?
High Research and Development Costs; Low Awareness Among Target Population Regarding Available Products.
8. Can you provide examples of recent developments in the market?
July 2022: Pixium Vision SA, a bioelectronics company focused on developing bionic vision systems, reported the successful implantation of the first patient in the Netherlands in the PRIMAvera pivotal trial in atrophic dry age-related macular degeneration (dry AMD) following approval of the PRIMAvera study by the Dutch Ministry of Health, Welfare, and Sport and the opening of the first PRIMAvera clinical site in the Netherlands at the Rotterdam Eye Hospital.
9. What pricing options are available for accessing the report?
Pricing options include single-user, multi-user, and enterprise licenses priced at USD 4750, USD 5250, and USD 8750 respectively.
10. Is the market size provided in terms of value or volume?
The market size is provided in terms of value, measured in Million and volume, measured in K Unit.
11. Are there any specific market keywords associated with the report?
Yes, the market keyword associated with the report is "Bionic Eyes Market," which aids in identifying and referencing the specific market segment covered.
12. How do I determine which pricing option suits my needs best?
The pricing options vary based on user requirements and access needs. Individual users may opt for single-user licenses, while businesses requiring broader access may choose multi-user or enterprise licenses for cost-effective access to the report.
13. Are there any additional resources or data provided in the Bionic Eyes Market report?
While the report offers comprehensive insights, it's advisable to review the specific contents or supplementary materials provided to ascertain if additional resources or data are available.
14. How can I stay updated on further developments or reports in the Bionic Eyes Market?
To stay informed about further developments, trends, and reports in the Bionic Eyes Market, consider subscribing to industry newsletters, following relevant companies and organizations, or regularly checking reputable industry news sources and publications.
Methodology
Step 1 - Identification of Relevant Samples Size from Population Database


Step 2 - Approaches for Defining Global Market Size (Value, Volume* & Price*)

Note*: In applicable scenarios
Step 3 - Data Sources
Primary Research
- Web Analytics
- Survey Reports
- Research Institute
- Latest Research Reports
- Opinion Leaders
Secondary Research
- Annual Reports
- White Paper
- Latest Press Release
- Industry Association
- Paid Database
- Investor Presentations

Step 4 - Data Triangulation
Involves using different sources of information in order to increase the validity of a study
These sources are likely to be stakeholders in a program - participants, other researchers, program staff, other community members, and so on.
Then we put all data in single framework & apply various statistical tools to find out the dynamic on the market.
During the analysis stage, feedback from the stakeholder groups would be compared to determine areas of agreement as well as areas of divergence


